AI can suggest a chart, write a headline, and lay out a slide—but it may not know whether dates are irregular, percentages share a valid total, or a title overstates the evidence. This guide maps common presentation questions to chart choices, then shows reproducible examples, prompts, and checks for the finished slide. Example datasets below are synthetic, not real business results.
Two Chart Choices: Before and After
The first pair changes a poor-fit chart for a ranking question; the second corrects a misleading bar baseline. Both are controlled editorial examples with synthetic values, not output from an AI-tool benchmark.
Open full-size examples and editable HTML layoutsCompare category size with bars
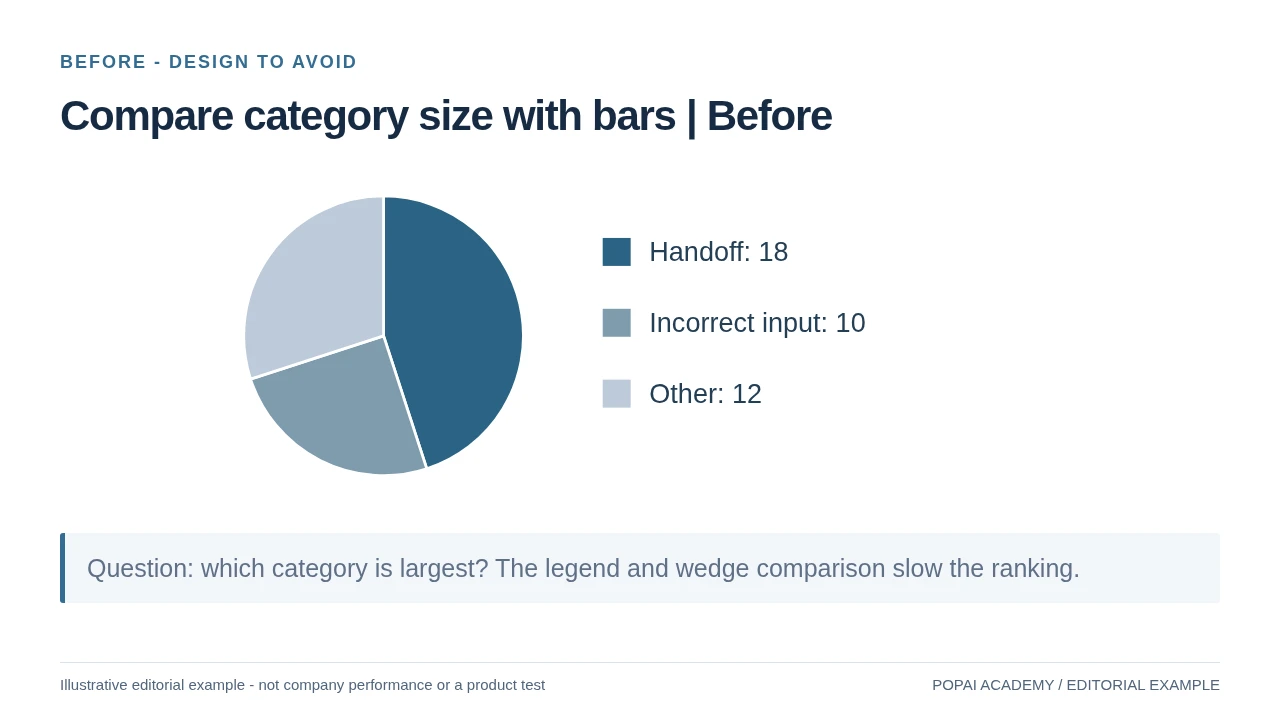
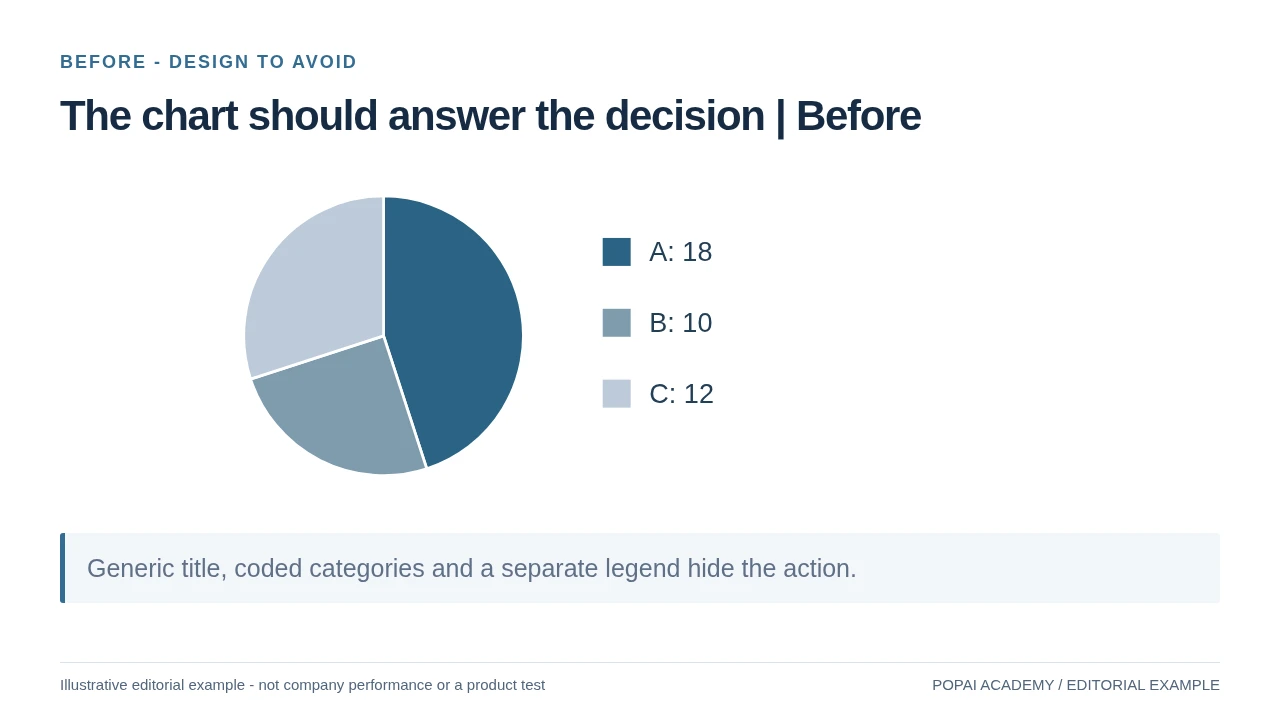
Before: a pie is less direct for ranking these three category counts (18, 10, 12). The bar version uses the same values.
Read or copy the slide content
Handoff: 18
Incorrect input: 10
Other: 12
Question: which category is largest? The legend and wedge comparison slow the ranking.
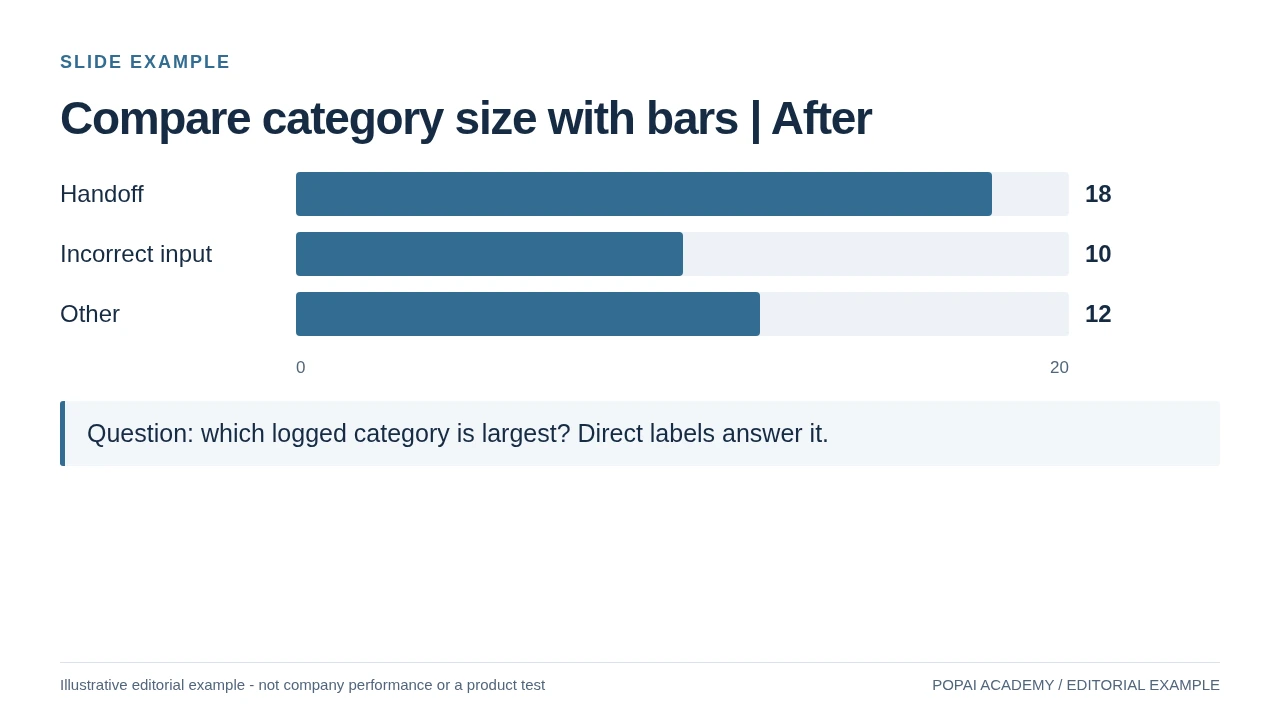
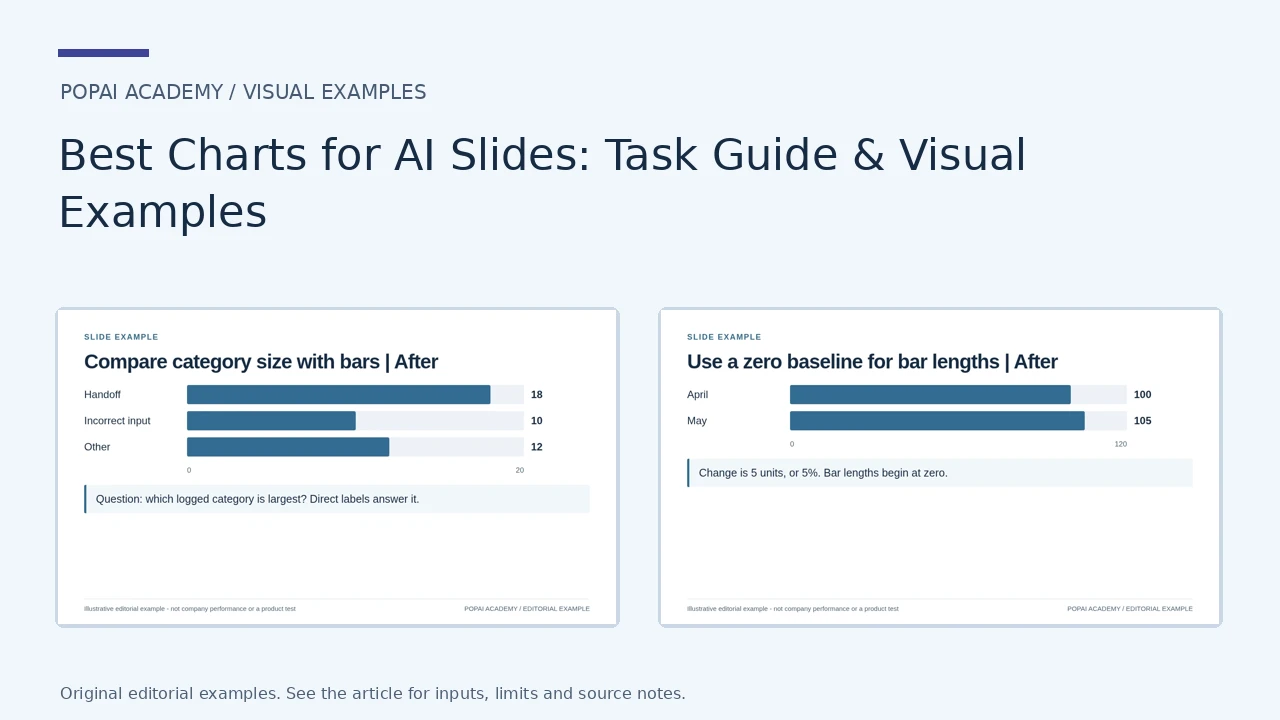
After: Category comparison example. These synthetic counts are used for chart selection, not incident analysis.
Read or copy the slide content
Handoff
18
Incorrect input
10
Other
12
0
20
Question: which logged category is largest? Direct labels answer it.
Prompt for Compare category size with bars
Create a slide with the purpose "Compare category size with bars | After". Use these approved source fields or replace the illustrative inputs before use: Handoff 18 Incorrect input 10 Other 12 0 20 Question: which logged category is largest? Direct labels answer it.. Preserve labels, units, source notes and any uncertainty. Do not add results, claims, customers or capabilities. Suggest a readable layout and keep the output editable in the chosen tool.
Use a zero baseline for bar lengths
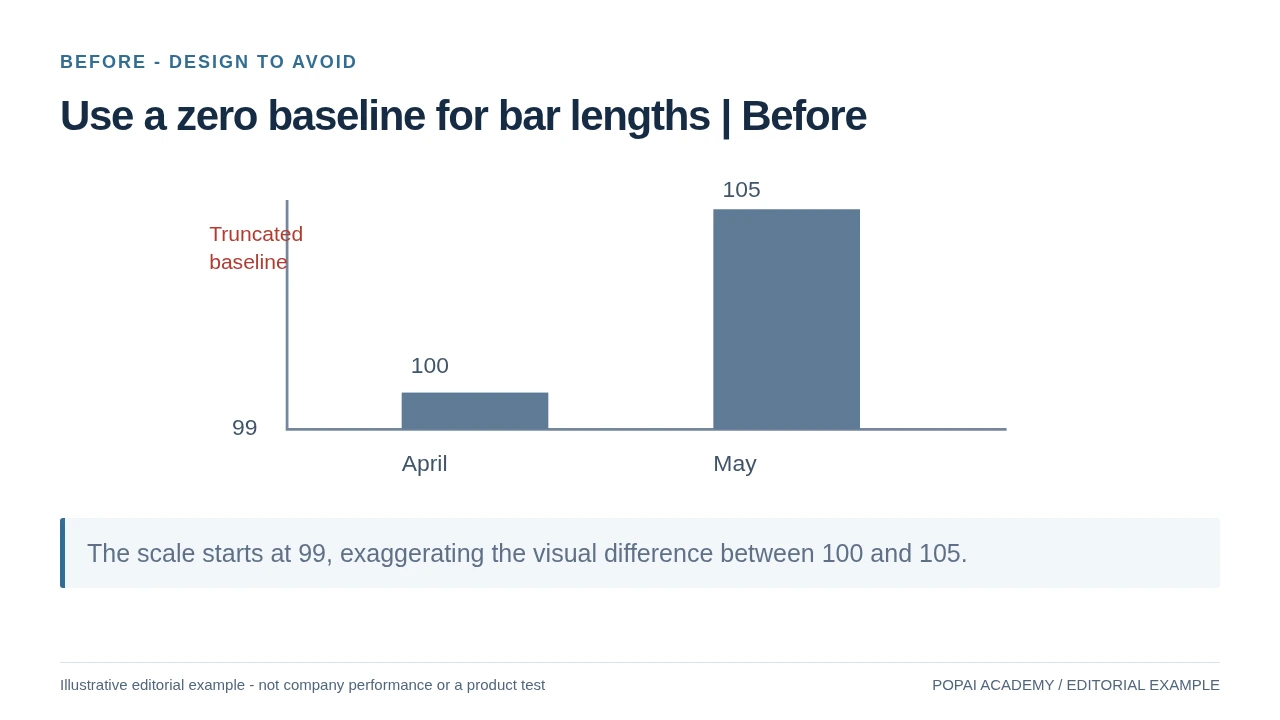
Before: Same values before and after; the improved version does not exaggerate magnitude.
Read or copy the slide content
100
105
99
April
May
Truncated
baseline
The scale starts at 99, exaggerating the visual difference between 100 and 105.
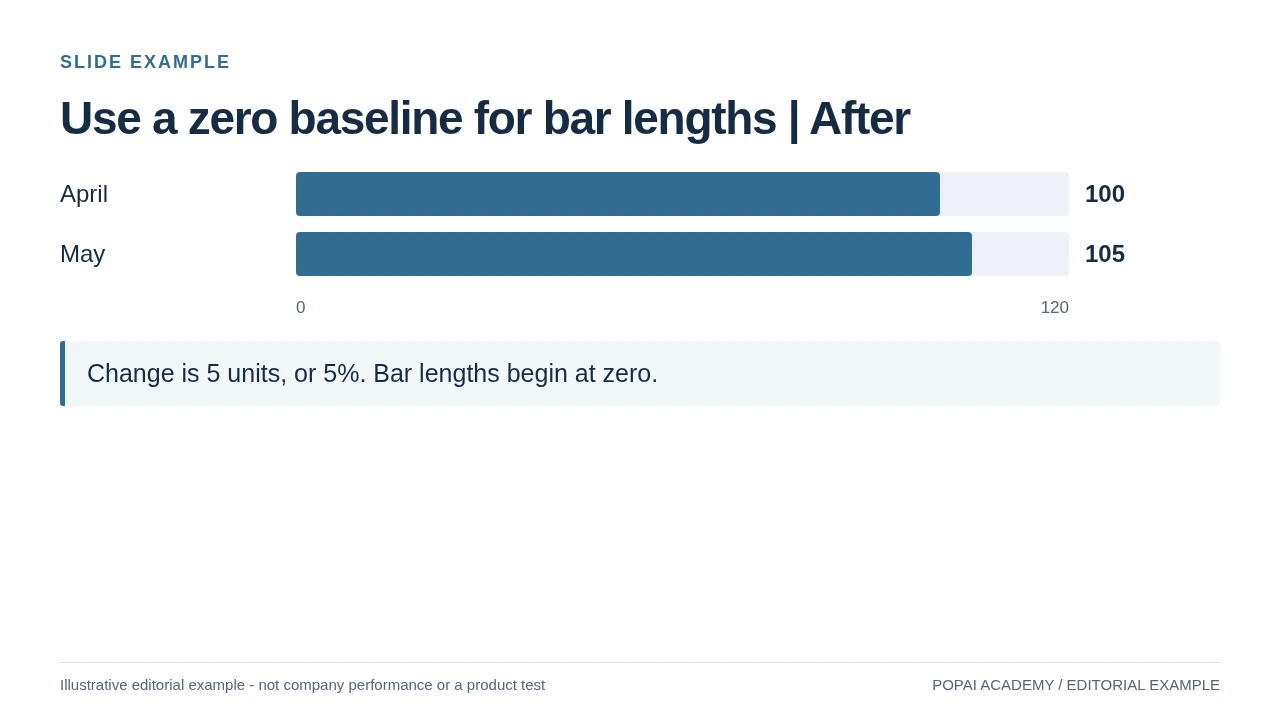
After: Same values before and after; the improved version does not exaggerate magnitude.
Read or copy the slide content
April
100
May
105
0
120
Change is 5 units, or 5%. Bar lengths begin at zero.
Prompt for Use a zero baseline for bar lengths
Create a slide with the purpose "Use a zero baseline for bar lengths | After". Use these approved source fields or replace the illustrative inputs before use: April 100 May 105 0 120 Change is 5 units, or 5%. Bar lengths begin at zero.. Preserve labels, units, source notes and any uncertainty. Do not add results, claims, customers or capabilities. Suggest a readable layout and keep the output editable in the chosen tool.
Best charts for AI slides: start with the question
Choose the visual that makes the required comparison easiest to verify, not the one that looks most elaborate.
Before prompting an AI tool, write the question the audience needs answered: Which group is larger? How has a measure changed? What makes up the total? AI can help draft and format the answer, but you must supply the data definitions and confirm the interpretation.
| Question | Good starting point | Use it when / avoid it when |
|---|---|---|
| Which categories differ? | Sorted bar chart | Good for precise comparisons and long labels. Use a table instead when readers need exact values for many categories. |
| How does a measure change over time? | Line chart | Good for ordered, comparable time points. Keep dates chronological; for irregular intervals, use a true date axis or label the gaps. Avoid connecting unrelated categories as if they were continuous. |
| How does a whole divide into parts? | Stacked bar or 100% stacked bar | Use when categories form a meaningful whole. Stacked bars make the total visible, but intermediate segments are hard to compare because they do not share a baseline. |
| How much does each part contribute? | Pie or donut, for a few distinct shares | Use only when the values are parts of the same total. Close-sized slices are difficult to compare; use a sorted bar chart when precision matters. |
| How are values distributed? | Histogram or box plot | A histogram shows frequency across numeric bins; a box plot summarizes median and spread across groups. Show sample sizes or raw points when small samples could make summaries misleading. |
| Do two numeric measures move together? | Scatter plot | Use paired observations to show association, not proof of causation. Add a trend line only if it helps and its method is clear. |
| How do stages or amounts connect? | Funnel, waterfall, or Sankey | A funnel compares counts across ordered stages; a waterfall explains additions and subtractions between a start and end value. A Sankey shows flows between sources and destinations and needs quantities for each flow. A flowchart shows steps or decisions, not quantities. |
Quick test: if the audience needs to read exact values, use a table or label the chart directly. If they need to spot a pattern, use a chart that makes that pattern visible.
Area charts are most useful when the magnitude of a continuous total matters, such as cumulative volume over time. A stacked area chart can show how components contribute to that total, but it makes individual series harder to compare. For small or noisy datasets, avoid smoothing away variation; show the observations or explain any aggregation.
Chart examples for trends, shares, and comparisons
These synthetic datasets show how the same figures become a chart, a defensible title, and a checkable takeaway.
Trend example: ticket volume and response time
Suppose a support team wants to know whether rising ticket volume coincided with slower responses. The following invented monthly figures are enough to reproduce the example:
| Month | Tickets (count) | Median first response (hours) |
|---|---|---|
| January | 420 | 5.2 |
| February | 460 | 5.0 |
| March | 510 | 5.4 |
| April | 560 | 5.1 |
Chart choice: use columns for ticket counts and a line for median response time if both series must appear on one slide. Label the axes “Tickets (count)” and “Median first response (hours),” and title it “Ticket volume rose 33%; median first response stayed near five hours.” The calculation is (560 − 420) ÷ 420 = 33%. The data supports “stayed near five hours,” not a claim that higher ticket volume had no effect on service.
A combo chart is useful here because the audience is comparing two monthly patterns in the same period. Since the measures use different units, a secondary axis may be needed—but its range can make two lines appear more or less aligned. If the relationship is not the main question, use two aligned charts with the same month order instead; that avoids implying a relationship through overlapping shapes.
Composition example: support issue shares
For a separate synthetic snapshot of 200 support requests, the categories are Billing: 92, Login: 48, Shipping: 36, and Other: 24. These sum to 200, so the shares are 46%, 24%, 18%, and 12%, respectively. A pie chart can work because there are four categories and the values represent the full set of requests in this example.
A useful title is “Billing made up 46% of support requests.” Label each slice with its category and percentage, and include the period and total (n=200). Before presenting, check that the counts sum to 200 and the displayed percentages sum to 100%. If viewers need to compare Login with Shipping precisely, a sorted bar chart is easier to read than similarly sized slices.
Copy-ready prompts for better AI slide charts
Give the tool a tidy data payload and explicit rules for calculations, uncertainty, and unsupported conclusions.
Paste data with one header row and one observation per row. Include units and the reporting period in the prompt, not just in a chart title. The prompt below uses the synthetic support data above; it asks the tool to flag ambiguity rather than silently fill gaps.
Complete prompt: compare two monthly measures
“Create one presentation slide for an operations review using only this data:
Month, Tickets (count), Median first response (hours)
January, 420, 5.2
February, 460, 5.0
March, 510, 5.4
April, 560, 5.1
Use columns for ticket count and a line for median response time. Label both axes with units and keep the months in chronological order. Use the title ‘Ticket volume rose 33%; median first response stayed near five hours’ only if you verify the calculation from the supplied values. Do not infer cause or add forecasts. Do not invent missing values; if a value, definition, or scale is ambiguous, ask a question before charting. Show the source as ‘Synthetic example data’ and the period as January–April. Return the plotted values and the calculation used for the title so I can check them.”
Prompt: inspect a distribution or relationship
“Recommend either a histogram or a box plot for the supplied numeric observations. State what each option would show and choose one based on the audience’s question. Preserve the original observations; do not remove outliers or fill missing values. Report the sample size, flag missing or unusual values, and do not describe a pattern as representative if the sample is small. If I provide paired measures, use a scatter plot and describe association only—not causation. Ask before making assumptions about units or data definitions.”
After generation, compare the returned values and any derived percentages with the source yourself. This is especially important when a tool creates a title or annotation: a correct chart can still carry an unsupported claim. The same review applies to output from AI presentation makers.
Choose the chart only after identifying the question and data type. Keep the dataset, units and reporting period beside the draft. For chart creation, editing and export steps, use the chart-editor workflow. This page focuses on which visual comparison to choose, not on repeating the editing tutorial.
Chart pitfalls: accuracy, readability, and accessibility
Prioritize errors that could change the audience’s interpretation; visual polish comes after data integrity.
Data integrity and claims
First verify that the plotted values, units, and time period match the source. Then check that the title and annotations say no more than the data supports. For small samples, show the sample size and avoid broad conclusions; for estimates, show the uncertainty interval or explain the limitation. If values are missing, disclose the gap or omit the affected comparison—do not let an AI tool silently interpolate.
Scales and visual interpretation
- Bar charts: start the value axis at zero in most cases because bar length encodes magnitude. A nonzero baseline can make modest differences look large. If a different range is essential, mark it clearly and explain why.
- Line charts: a narrower range can be defensible when small changes matter, but label the scale so viewers do not mistake the visual slope for a large absolute change. Avoid undisclosed scale breaks.
- Dual axes: use them only when both measures and their units are necessary on one slide. Different axis ranges can create apparent alignment; show the scales clearly or use separate, aligned charts.
- Too much detail: reduce the number of categories or series before shrinking labels. Group categories only when the grouping is meaningful and named.
Accessibility and viewing distance
Do not encode a distinction by color alone: pair color with direct labels, markers, or line styles. Check text and chart labels in presentation mode from the back of the room, not only on a laptop; if labels cannot be read without zooming, simplify the chart or move detail to an appendix. For digital slides, check text/background contrast against the relevant WCAG contrast guidance.
A reliable chart makes its claim easy to inspect: viewers can identify the measure, read the scale, and understand the limits of the evidence.
Before presenting, do one final “trace test”: pick a labeled point or segment, find its source value, and follow the calculation to the title or takeaway. Then check the exported file for shifted labels, substituted fonts, compressed legends, or static chart images. If the chart fails either check, fix the mapping or simplify the design before adding decoration.
Choose charts by presentation scenario
Start with the decision each audience needs to make, then include only the context required to make it responsibly.
| Scenario | Slide question | Chart approach and trade-off |
|---|---|---|
| Executive update | Is the metric on track, and what needs attention? | Use a KPI with a target and a short trend line. A single current value without a time period or target can conceal whether performance is improving. |
| Investor pitch | What has happened, and what is forecast? | Separate historical results from projections with clear labels and assumptions. Do not use the same visual treatment in a way that makes a forecast look like observed data. |
| Teaching slide | What should learners compare or understand next? | Use a simple bar or line chart and annotate the relevant feature. Reveal steps in sequence when the goal is to explain a process, rather than crowding every detail onto one slide. |
| Financial analysis | Which changes bridge the starting value to the ending value? | Use a waterfall and label each increase and decrease. Check that the intermediate steps reconcile to the final total. |
| Research presentation | How variable are the observations, and what can the sample support? | Use a distribution plot or scatter plot as appropriate, and state sample size, method, and relevant limitations. Averages alone can hide spread or outliers. |
For any of these audiences, keep the source table and calculation notes available even when they do not belong on the slide. That makes it easier to answer questions without forcing the audience to decode a dense chart during the presentation.
Choose the Chart by the Question
| Question | Useful first choice | Avoid / check |
|---|---|---|
| Which category is larger? | Sorted bars | Unequal widths or a truncated bar baseline |
| How did it change over time? | Line with a consistent time axis | A pie for a temporal trend |
| How is a whole divided? | Stacked bar; pie only for a few clear shares | Overlapping categories or totals above 100% |
| How are values distributed? | Histogram or box plot | A mean with no spread when variation matters |
| Are two variables associated? | Scatter plot | A causal claim from correlation alone |
| How does a total change? | Reconciled waterfall / bridge | Unreconciled category sums or mixed units |
This is an editorial selection guide, not a guarantee that a particular tool supports every chart. For page composition, use the layout examples; for editing and export, use the chart workflow.