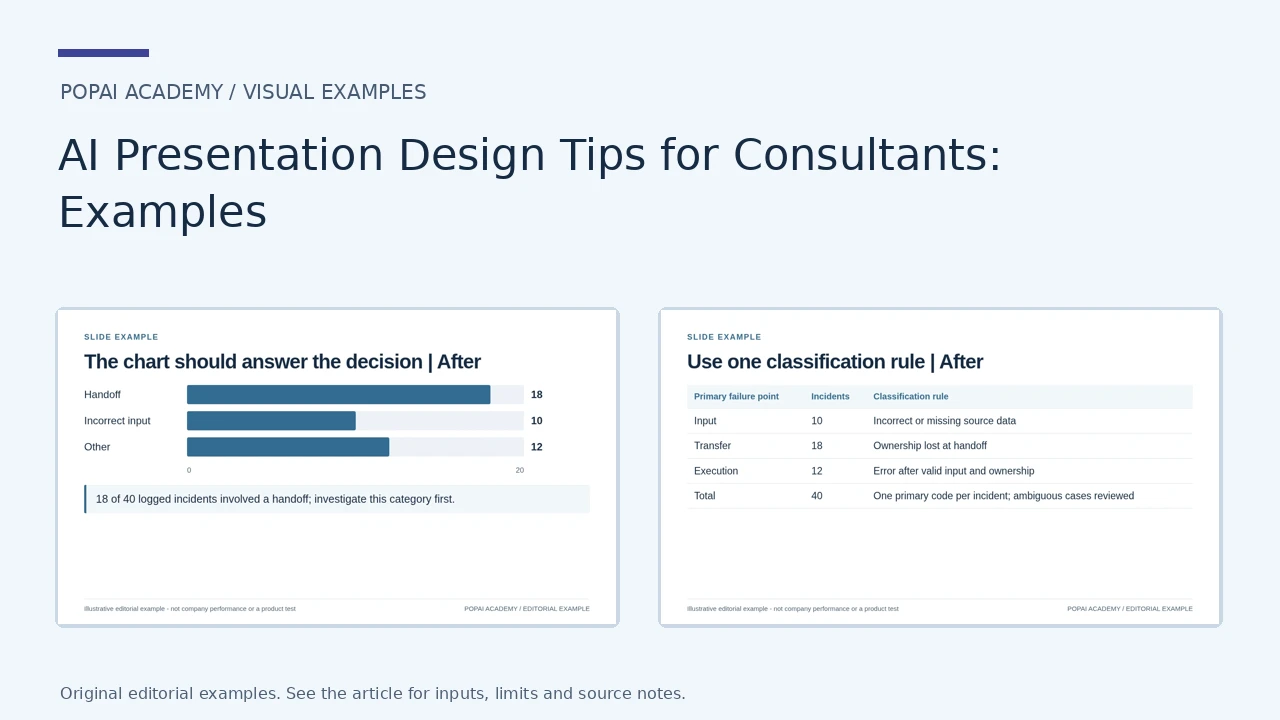
Start with an existing consulting slide and ask what a client should conclude from it. Improve the title, evidence and spatial hierarchy before changing the theme. The examples below show visual edits to a chart, an evidence layout and a classification page; they do not replace the client-proposal workflow.
Three Consulting Slide Before-and-After Comparisons
Each pair uses the same underlying information, changing only the communication design. The classification example requires one agreed primary code per incident; a neat layout does not prove the taxonomy is exhaustive.
Open full-size examples and editable HTML layoutsThe chart should answer the decision
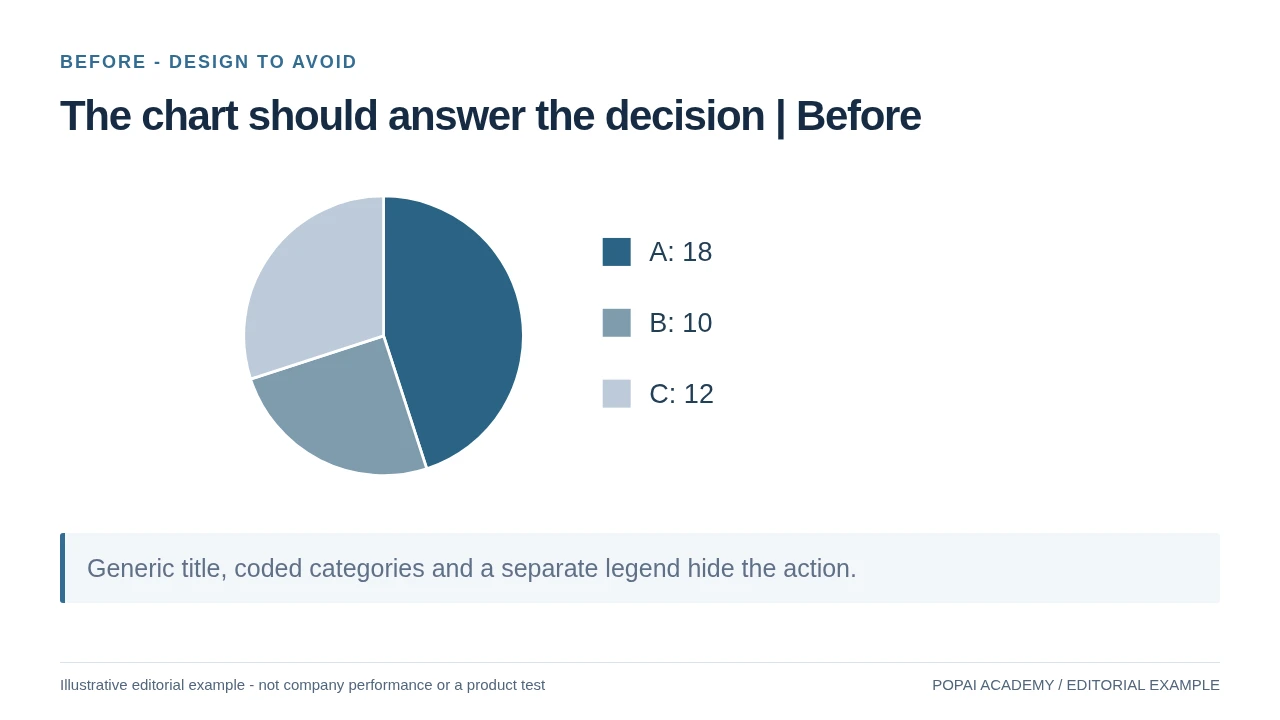
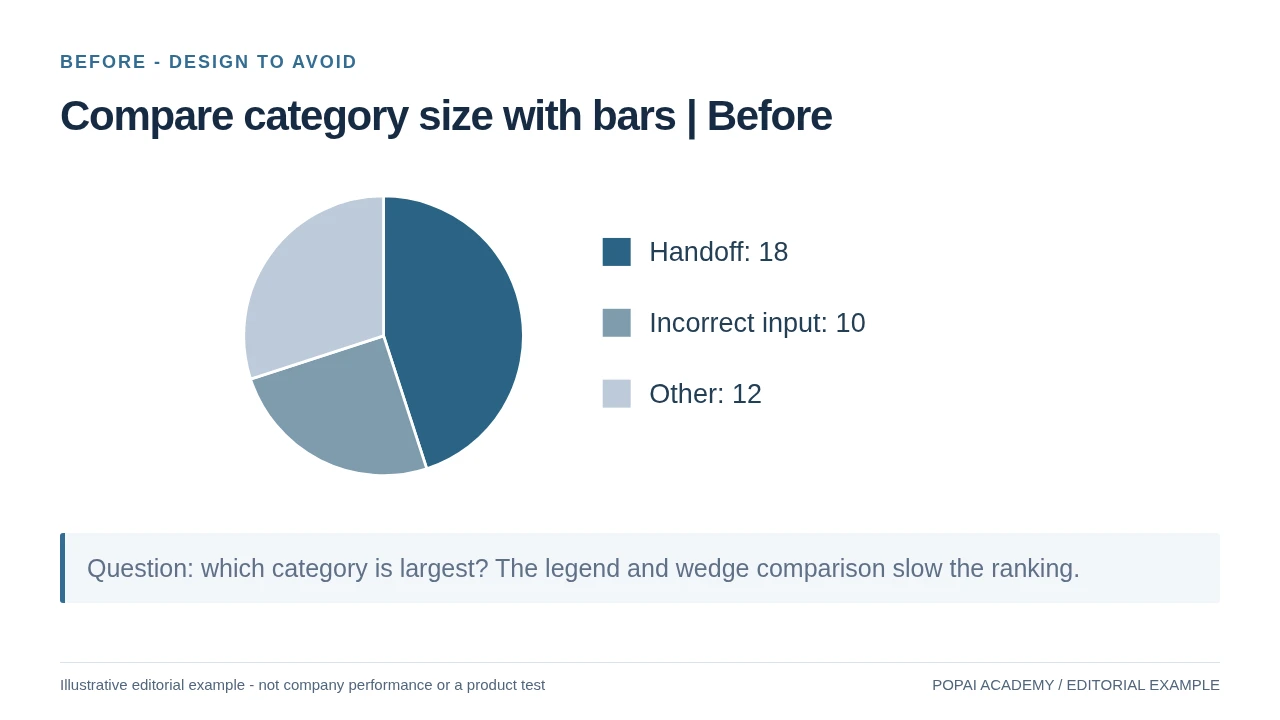
Before: the same incident counts lack meaningful labels and a decision-led headline.
Read or copy the slide content
A: 18
B: 10
C: 12
Generic title, coded categories and a separate legend hide the action.
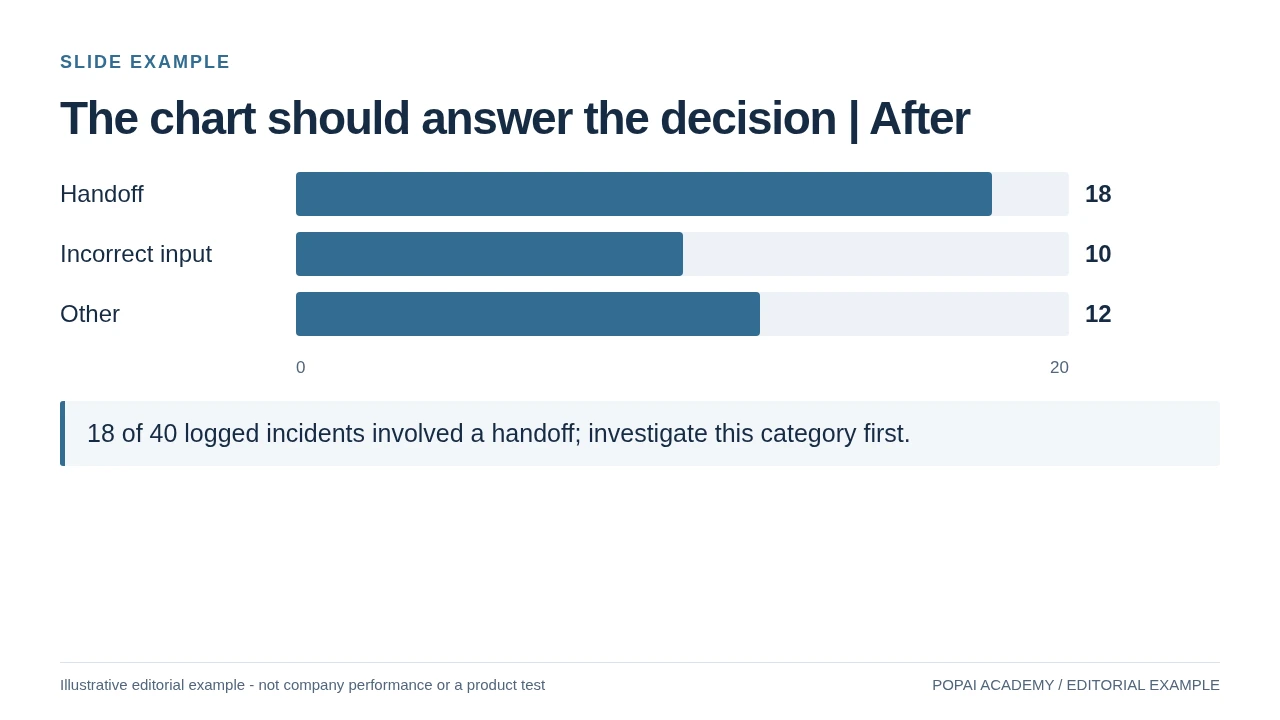
After: a zero-baseline bar chart names the categories and shows 18 of 40 incidents. The count does not prove causality.
Read or copy the slide content
Handoff
18
Incorrect input
10
Other
12
0
20
18 of 40 logged incidents involved a handoff; investigate this category first.
Prompt for The chart should answer the decision
Create a slide with the purpose "The chart should answer the decision | After". Use these approved source fields or replace the illustrative inputs before use: Handoff 18 Incorrect input 10 Other 12 0 20 18 of 40 logged incidents involved a handoff; investigate this category first.. Preserve labels, units, source notes and any uncertainty. Do not add results, claims, customers or capabilities. Suggest a readable layout and keep the output editable in the chosen tool.
Give the headline an evidence home
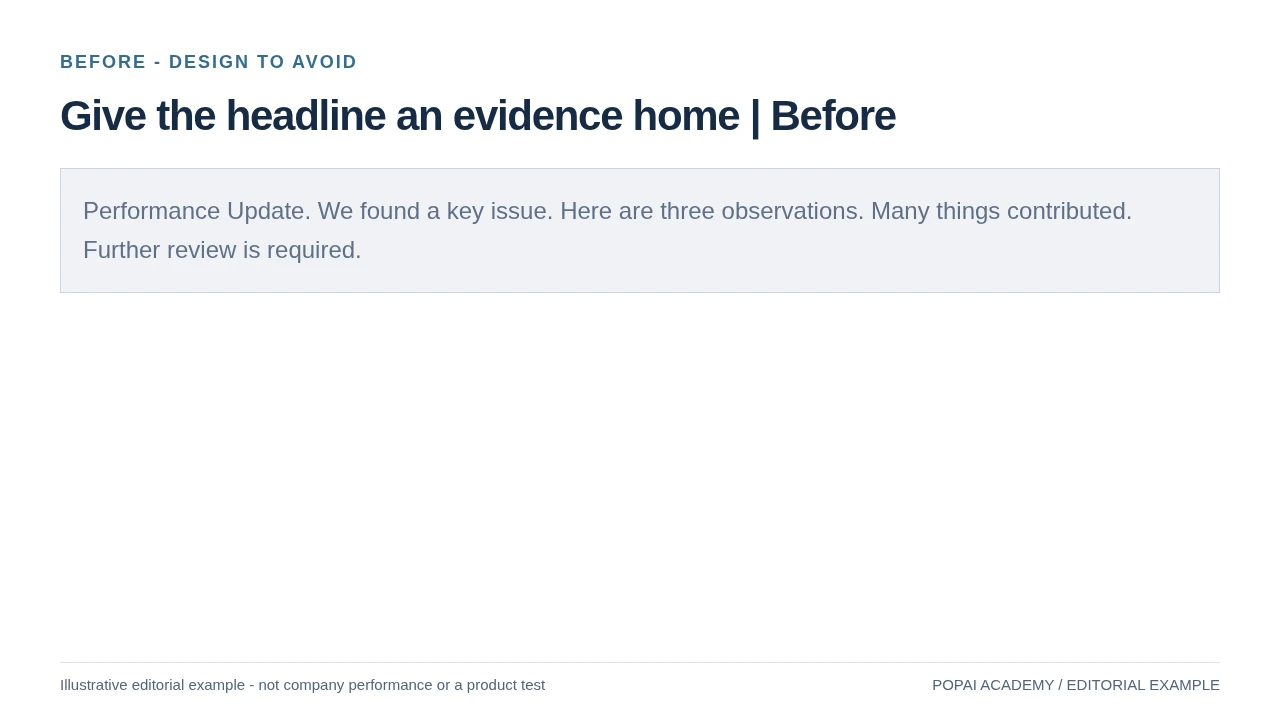
Before: Separate claim, evidence and decision; do not turn an incident count into causality.
Read or copy the slide content
Performance Update. We found a key issue. Here are three observations. Many things contributed. Further review is required.
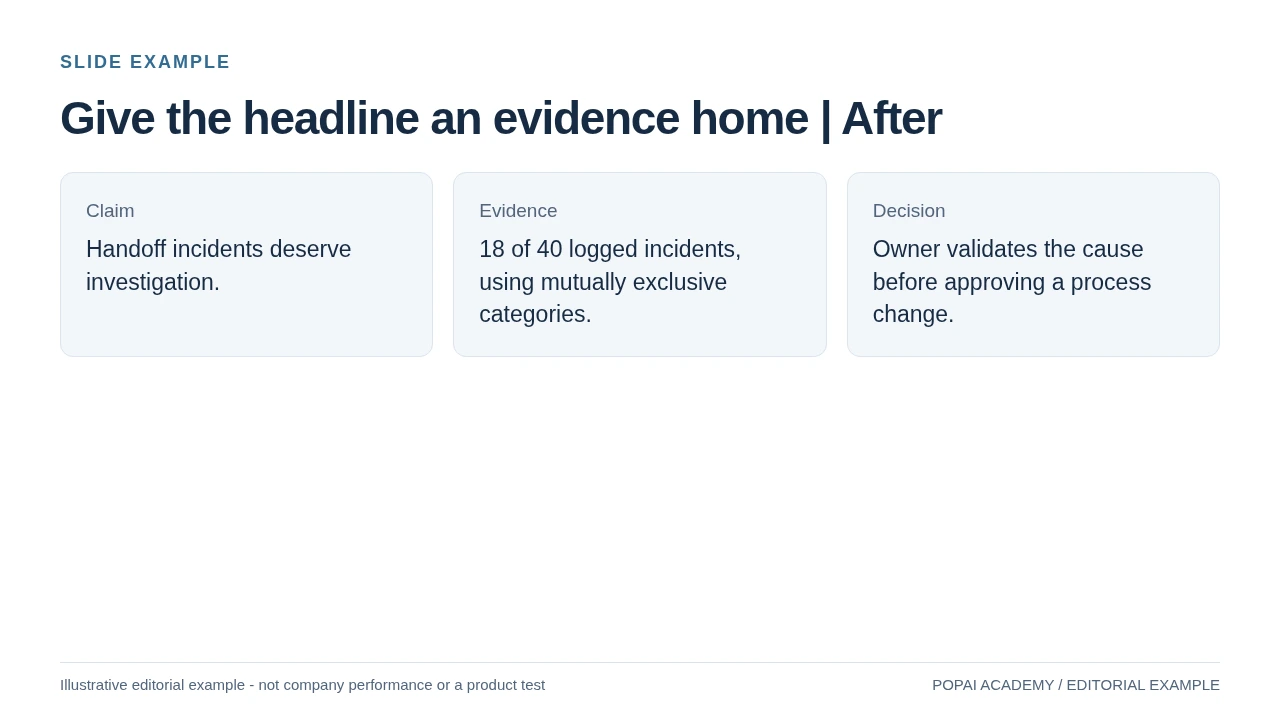
After: Separate claim, evidence and decision; do not turn an incident count into causality.
Read or copy the slide content
Claim
Handoff incidents deserve investigation.
Evidence
18 of 40 logged incidents, using mutually exclusive categories.
Decision
Owner validates the cause before approving a process change.
Prompt for Give the headline an evidence home
Create a slide with the purpose "Give the headline an evidence home | After". Use these approved source fields or replace the illustrative inputs before use: Claim Handoff incidents deserve investigation. Evidence 18 of 40 logged incidents, using mutually exclusive categories. Decision Owner validates the cause before approving a process change.. Preserve labels, units, source notes and any uncertainty. Do not add results, claims, customers or capabilities. Suggest a readable layout and keep the output editable in the chosen tool.
Use one classification rule
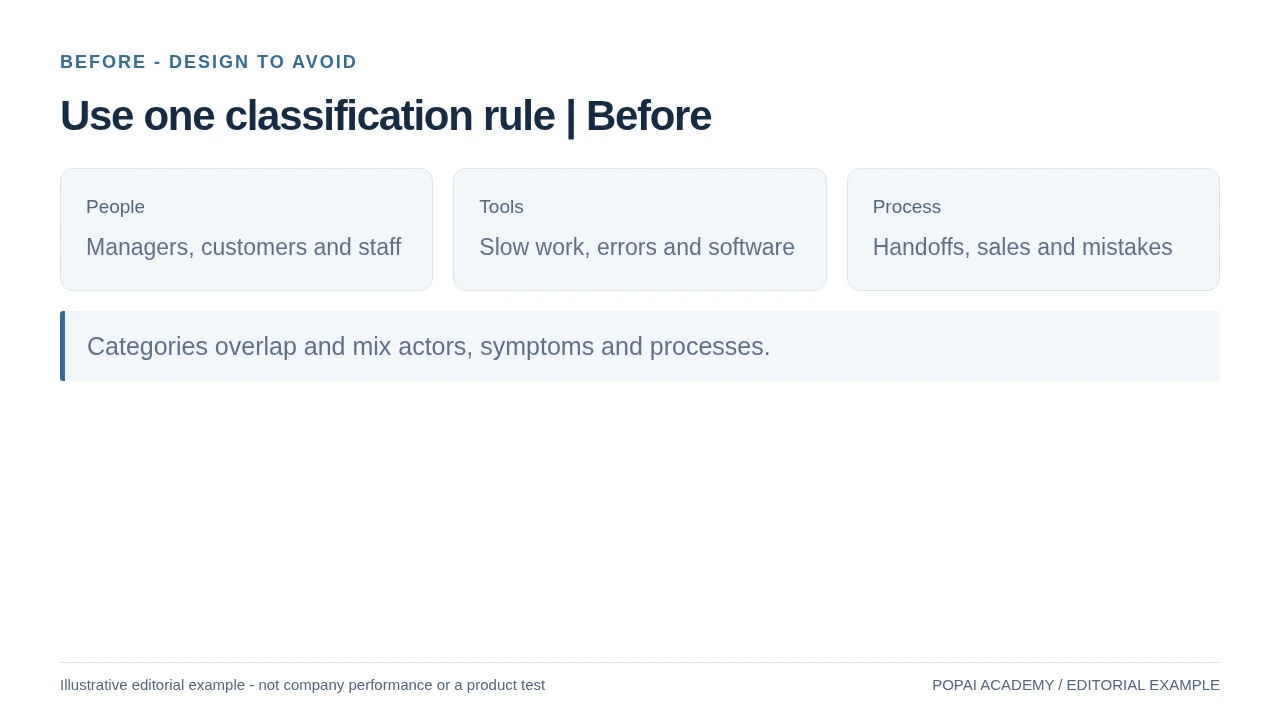
Before: The mutually exclusive rule is visible; do not claim a taxonomy is exhaustive without checking it.
Read or copy the slide content
People
Managers, customers and staff
Tools
Slow work, errors and software
Process
Handoffs, sales and mistakes
Categories overlap and mix actors, symptoms and processes.
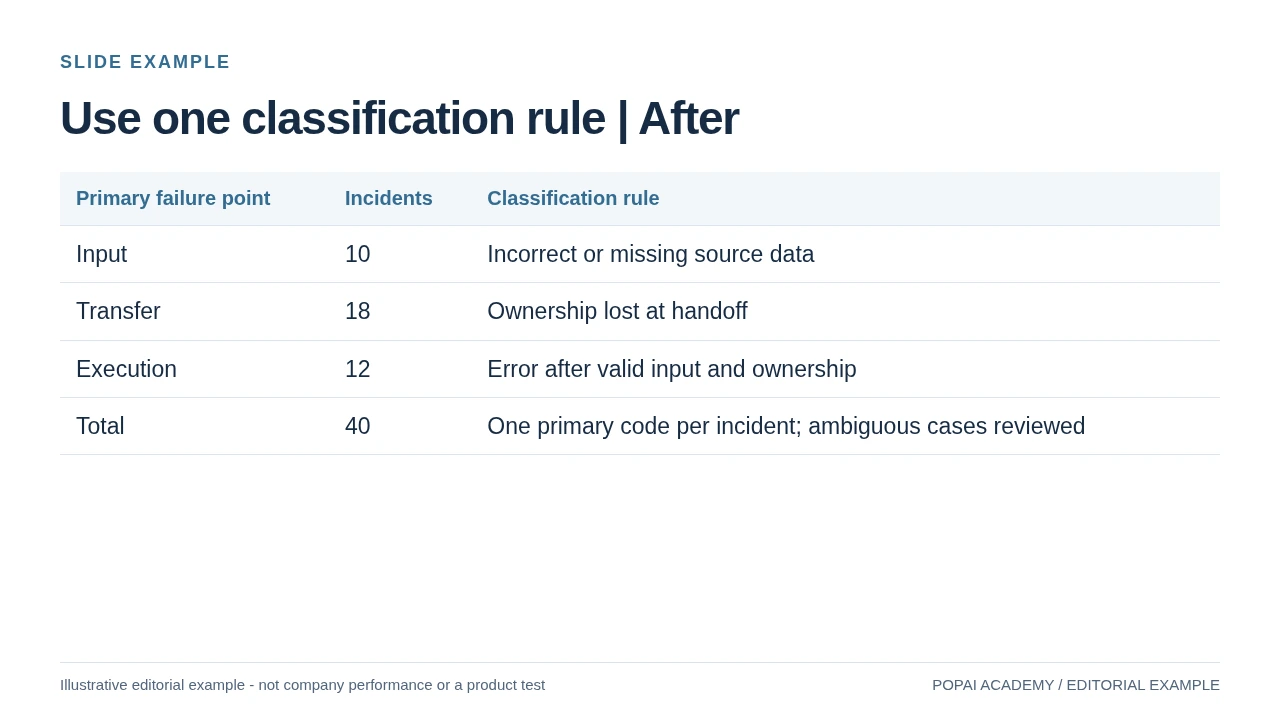
After: The mutually exclusive rule is visible; do not claim a taxonomy is exhaustive without checking it.
Read or copy the slide content
Primary failure point
Incidents
Classification rule
Input
10
Incorrect or missing source data
Transfer
18
Ownership lost at handoff
Execution
12
Error after valid input and ownership
Total
40
One primary code per incident; ambiguous cases reviewed
Prompt for Use one classification rule
Create a slide with the purpose "Use one classification rule | After". Use these approved source fields or replace the illustrative inputs before use: Primary failure point Incidents Classification rule Input 10 Incorrect or missing source data Transfer 18 Ownership lost at handoff Execution 12 Error after valid input and ownership Total 40 One primary code per incident; ambiguous cases reviewed. Preserve labels, units, source notes and any uncertainty. Do not add results, claims, customers or capabilities. Suggest a readable layout and keep the output editable in the chosen tool.
AI presentation design tips for consultants: start with the decision
AI can help turn scattered evidence into a draft, but the consultant must define the decision and judge whether the evidence supports it.
“AI-friendly” here means a workflow designed for AI assistance, with clear inputs and human review—not a deck written for a machine. Start by stating what the audience needs to decide, approve, or do. That sentence is more useful than choosing a template before you know what the deck needs to prove.
Illustrative example: A regional retailer is considering a pilot in a new city. The decision question is, “Should we fund a three-month pilot in City A?” The brief includes approved interview notes, competitor locations, and a spreadsheet of store-level sales. Before drafting, label what is known (for example, “12 of 18 interviewees mentioned convenience”) separately from what is inferred (“convenience may support repeat visits”). If stakeholders disagree on the decision, use the first page to state the alternatives and the unresolved question; do not let an AI-generated outline quietly choose a side.
Situation-and-complication thinking can help frame the context and why it matters; a key question makes the decision explicit. MECE can then help organize supporting reasons without overlap. These are checks, not rules: if a neat set of categories obscures a material trade-off, revise the categories.
“If a client reads only the slide titles, they should understand the recommendation, the evidence behind it, and any important uncertainty.”
Write a brief that makes evidence review possible
Give the tool the audience, decision, source boundaries, and constraints. Ask it to label facts, hypotheses, and missing evidence rather than filling gaps with plausible-sounding claims.
For example, an AI outline might turn “interviews suggest convenience matters” into “City A customers will switch for convenience.” The first statement reports interview evidence; the second makes a behavioral prediction that the interviews alone may not support. Revise the claim to match the evidence, or label it as a hypothesis to test in the pilot. Specify presentation length, language, and mandatory sections too. If using PopAi AI Presentation, a prompt- or source-led workflow can help produce a draft structure; review that structure against the brief before generating slides.
Give each existing page a role: conclusion, supporting evidence or decision. Move repeated background to an appendix, and make sure the order of titles alone expresses the recommendation. This is a storyline edit, not a new service scope or an invented client diagnosis.
Use a restrained visual system for professional consultant slides
A consistent hierarchy helps decision-makers find the conclusion, comparison, and caveat without decoding each page anew.
Start with the client’s template and required viewing context. Within those constraints, use one font family where possible, a consistent title position, and a small set of text styles: title, body, label, and source note. As a practical starting point, keep body text around 18–24 pt for a projected deck and avoid footnotes below 12 pt; adjust to the room, template, and screen, then test at actual presentation size. If a page only fits by shrinking text, edit it or split it.
Make hierarchy and color do specific work
Give the conclusion the strongest emphasis, supporting evidence the next level, and caveats a visible but secondary position. Align titles, chart edges, and text blocks to a simple grid. Use color semantically only when the meaning is stable and explained—for example, one consistent highlight for the recommended option and a distinct warning color for a risk. Do not assign red and green to data categories if that implies “bad” and “good” without justification. Check contrast, and use labels, shapes, or patterns as well as color so meaning is not color-dependent.
For example, an overloaded options page with six paragraphs can become three aligned columns, each using the same criteria—cost, time to launch, and risk—with a short takeaway beneath. That makes the trade-offs comparable without hiding a disadvantage in a different format. A client template takes precedence over a preferred palette; preserve its master and typography, then improve hierarchy within the approved system rather than rebuilding it.
- Executive summary: make the recommendation prominent and show the few reasons that support it.
- Options page: compare the same criteria in parallel columns; mark assumptions consistently.
- Project plan: show milestones, owners, dependencies, and decision gates on a timeline.
- Risk page: make likelihood, impact, mitigation, and accountable owner easy to scan.
A thumbnail check tests whether the hierarchy survives at a glance; a full-size check tests legibility. A live deck can use simpler slides because the presenter supplies context. A pre-read needs explanatory labels, sources, and enough detail to stand alone. In either format, verify small chart labels and footnotes on the device or screen where the client will view them.
Make charts and data defensible
Treat the source, calculation, chart, and exported slide as one audit trail—not as separate tasks.
Choose a chart that answers the question
Use a line chart for change over time, bars for category comparisons, a waterfall for sequential contributions, and a scatter plot when the relationship between two measures matters. State the unit, period, and comparison basis. Use a zero baseline for bars when comparing magnitude; if a nonzero axis is necessary to show small variation, make the break or scale unmistakable. Mark partial periods and estimates explicitly, and do not imply precision the source data cannot support.
Reconcile the numbers before and after export
AI-assisted systems can produce a chart that looks polished while still requiring checks for values, labels, titles, or formatting. Use this repeatable sequence: source file → calculation → plotted values → labels and units → exported slide. For instance, if a quarterly sales chart compares a current quarter-to-date figure of $8.1 million with full prior quarters near $10 million, the comparison is incomplete. Either compare the same number of weeks, label the current period “quarter to date,” or remove the misleading conclusion.
Keep the source filename or document reference, relevant sheet or page, calculation method, and version date with the working materials. If using chart-editing controls in a presentation tool, confirm which chart types and file exports remain editable in your chosen workflow, then inspect the exported file; behavior can vary by chart and format. Product controls can help with revisions, but the workbook or approved report remains the authority.
| Audit step | What to verify | Why it matters |
|---|---|---|
| Source and calculation | Trace values to the approved file; recompute key totals, rates, and denominators. | Catches unsupported claims and calculation errors. |
| Scope and units | Confirm dates, currency, geography, sample, denominator, and measurement units. | Prevents unlike-for-like comparisons. |
| Chart and labels | Check plotted values, axis scale, legend, title, labels, and notes against the claim. | Lets readers interpret the visual without guessing. |
| Export and record | Open the exported file, inspect rendering, and retain the source and calculation version. | Supports delivery checks and later reproduction. |
Illustrative data check: A source workbook reports 120 qualified leads from 600 inquiries, or 20%. If a generated slide labels the result “conversion rate” without defining the denominator—or shows 24% after filtering out 100 inquiries—the title and calculation no longer describe the same population. Reconcile the filter, calculation, and label, then state the denominator in a source note. When evidence remains uncertain, show a range or qualify the claim rather than presenting a single estimate as observed fact.
For a design revision, keep the approved evidence pack and ask for one change at a time: a conclusion-led title, a clearer comparison or a consistent unit. Recheck the result against the original. Building the service proposal itself is covered in the consulting pitch deck tutorial.
Use a consultant’s final QA checklist before delivery
Run content checks before file checks, and assign a second reviewer when the recommendation or its consequences are material.
First, test the argument and evidence
The author should read the titles in sequence, then review each page against its source. A skeptical decision-maker pass asks: “What decision am I being asked to make?”, “Which evidence would change my mind?”, and “What assumption or downside is missing?” A slide fails this pass if its title overstates the data, its caveat is hard to find, or the proposed action has no owner or decision trigger.
- Logic: Does the deck answer the agreed question, and does each page advance the argument?
- Evidence: Can key claims be traced to an approved source? Are estimates, assumptions, and unresolved gaps labeled?
- Peer review: For a high-stakes recommendation, ask a colleague who did not build the deck to challenge the conclusion, comparison basis, and material risks.
Then, test the design and delivery file
- Charts and accessibility: Recheck values, units, scales, contrast, and labels; ensure meaning does not depend on color alone.
- Template and readability: Check titles, fonts, spacing, and source notes at the intended viewing size. Add speaker notes or an appendix when the audience needs detail that would overload the main story.
- Export and setup: Open the final file on the presentation system or an equivalent device, check layout shifts and fonts, and confirm links, notes, and charts remain usable.
- Release: Review comments, metadata, file contents, and sharing permissions before sending.
If a claim cannot be verified before the deadline, remove it, qualify it, or label it plainly as an assumption; do not leave a confident draft title in place. AI can reduce blank-page friction and help explore structures, but the responsible consultant still owns the recommendation, evidence, and release decision.