The best layout for an AI-generated slide is the one that helps its audience understand, decide, or act with the least unnecessary reading.
An AI draft can turn a decision into six bullets, or repeat the same title-and-text structure across every page. For example, a launch plan with four sequential stages is hard to scan as a paragraph; a numbered process with an owner and output for each stage makes the handoffs visible. Changing the layout helps because it changes how information is grouped—not just how it looks.
Here, “layout” means the arrangement of a slide’s headline, text, and visual. It is different from a theme, which sets colors and type, or a template, which supplies a broader set of design rules. The examples below illustrate several practical tests: fit for the audience’s task, legibility at presentation size, ease of editing after generation, and fidelity to the source. They are illustrative examples, not research findings or claims about a particular tool’s output.
Six Layout Grids You Can Use for Different Messages
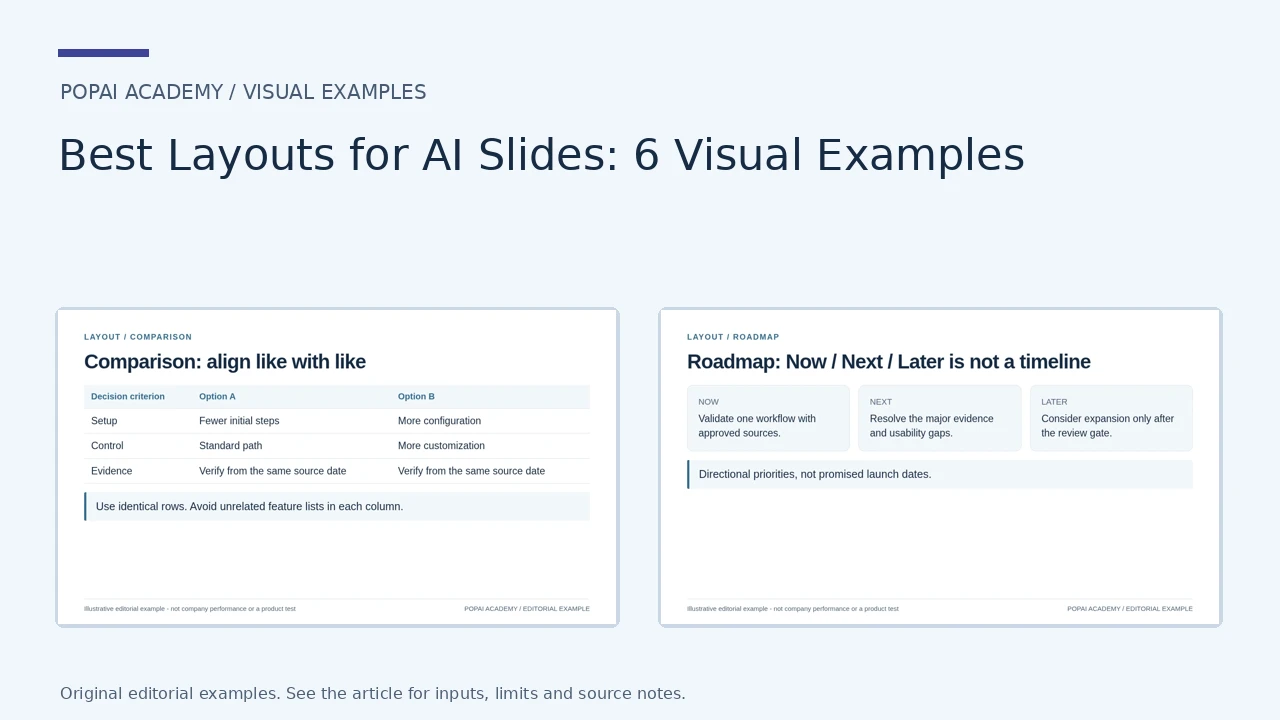
Compare space allocation rather than chart type. The grids are finished editorial examples with copyable text: comparison, timeline, process, three-card conclusion, metrics and roadmap.
Open full-size examples and editable HTML layouts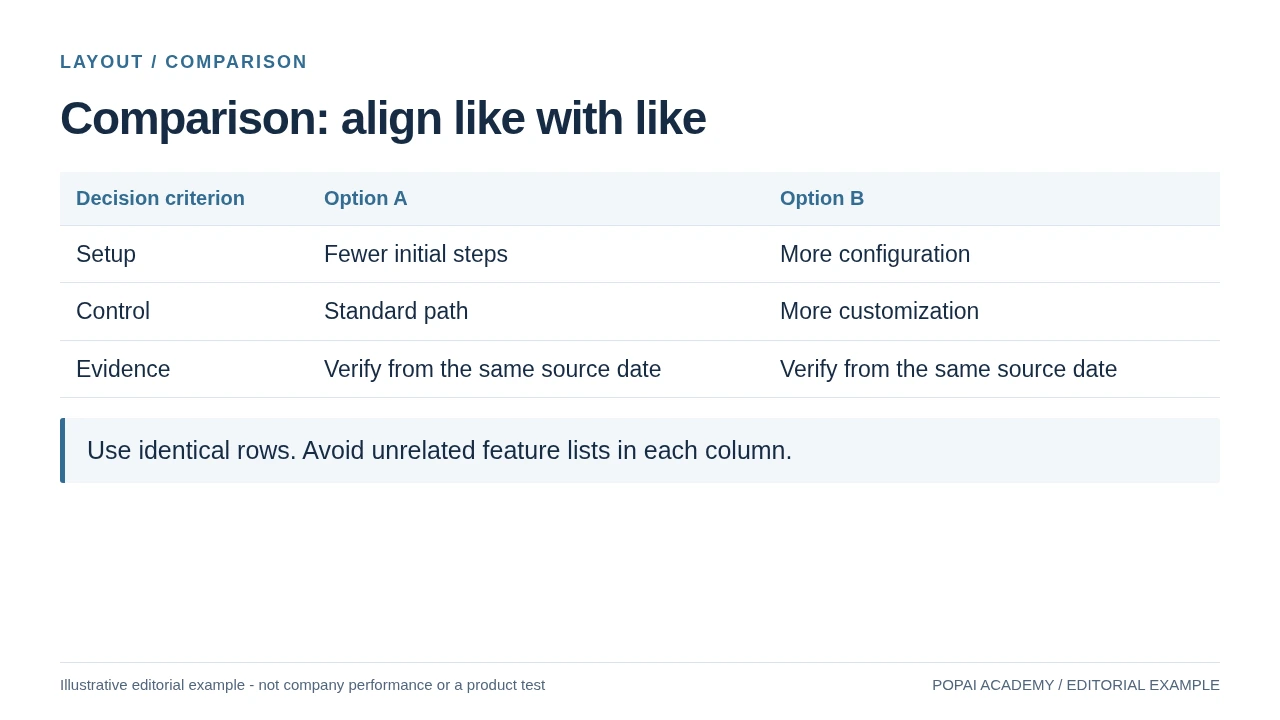
A comparison layout with matched criteria; options are illustrative, not competing products.
Read or copy the slide content
Decision criterion
Option A
Option B
Setup
Fewer initial steps
More configuration
Control
Standard path
More customization
Evidence
Verify from the same source date
Verify from the same source date
Use identical rows. Avoid unrelated feature lists in each column.
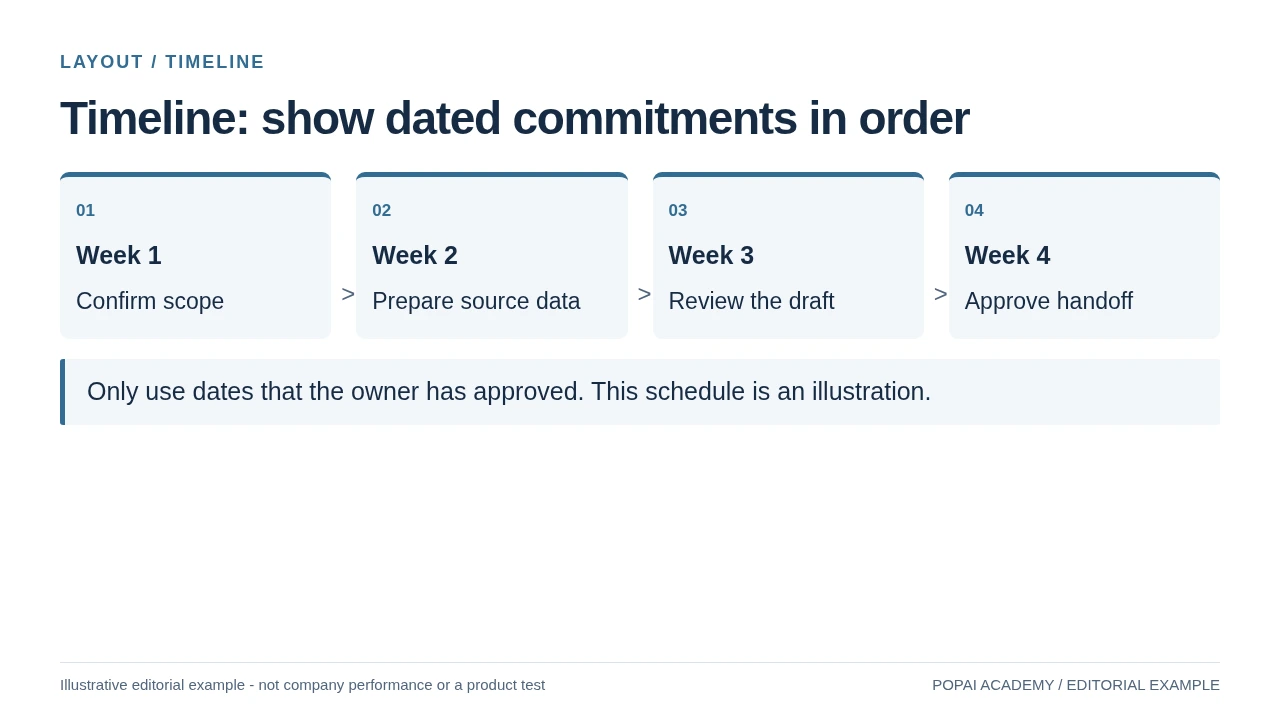
Keep a true time sequence distinct from a roadmap.
Read or copy the slide content
01
Week 1
Confirm scope
02
Week 2
Prepare source data
03
Week 3
Review the draft
04
Week 4
Approve handoff
Only use dates that the owner has approved. This schedule is an illustration.
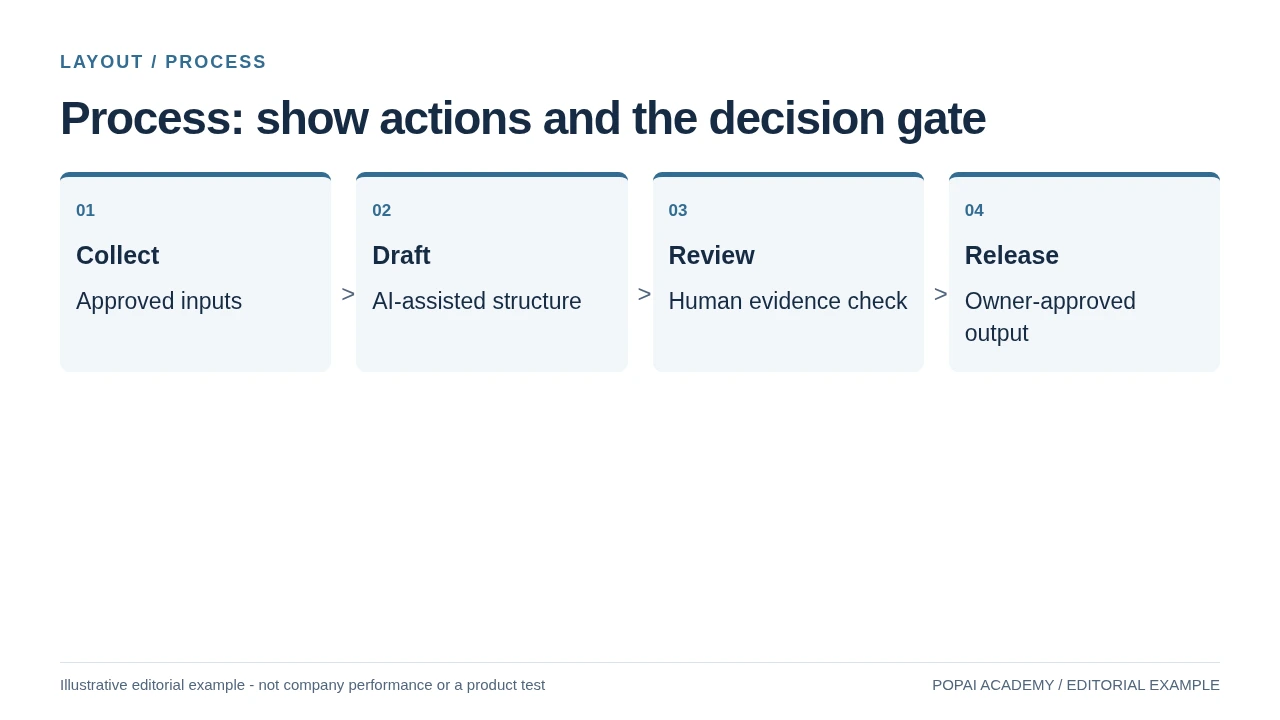
A process shows dependencies and decisions, not a fake calendar commitment.
Read or copy the slide content
01
Collect
Approved inputs
02
Draft
AI-assisted structure
03
Review
Human evidence check
04
Release
Owner-approved output
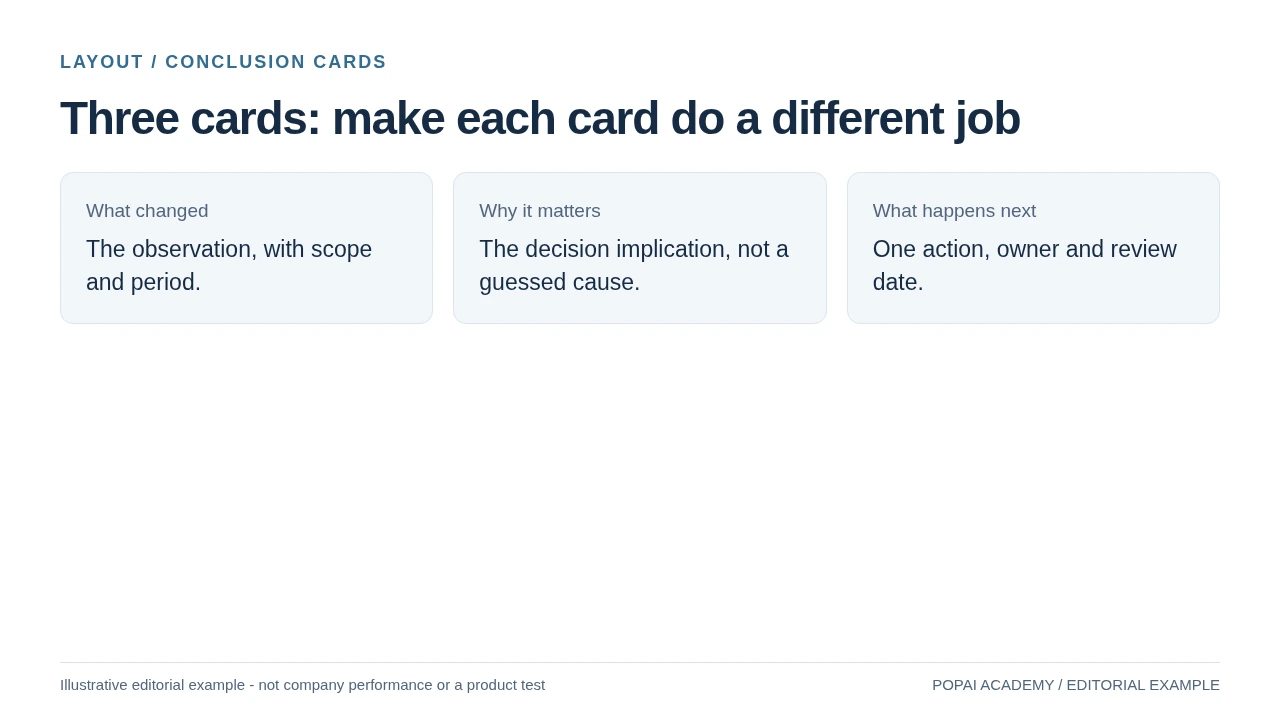
Parallel cards need separate roles, not three versions of the same claim.
Read or copy the slide content
What changed
The observation, with scope and period.
Why it matters
The decision implication, not a guessed cause.
What happens next
One action, owner and review date.
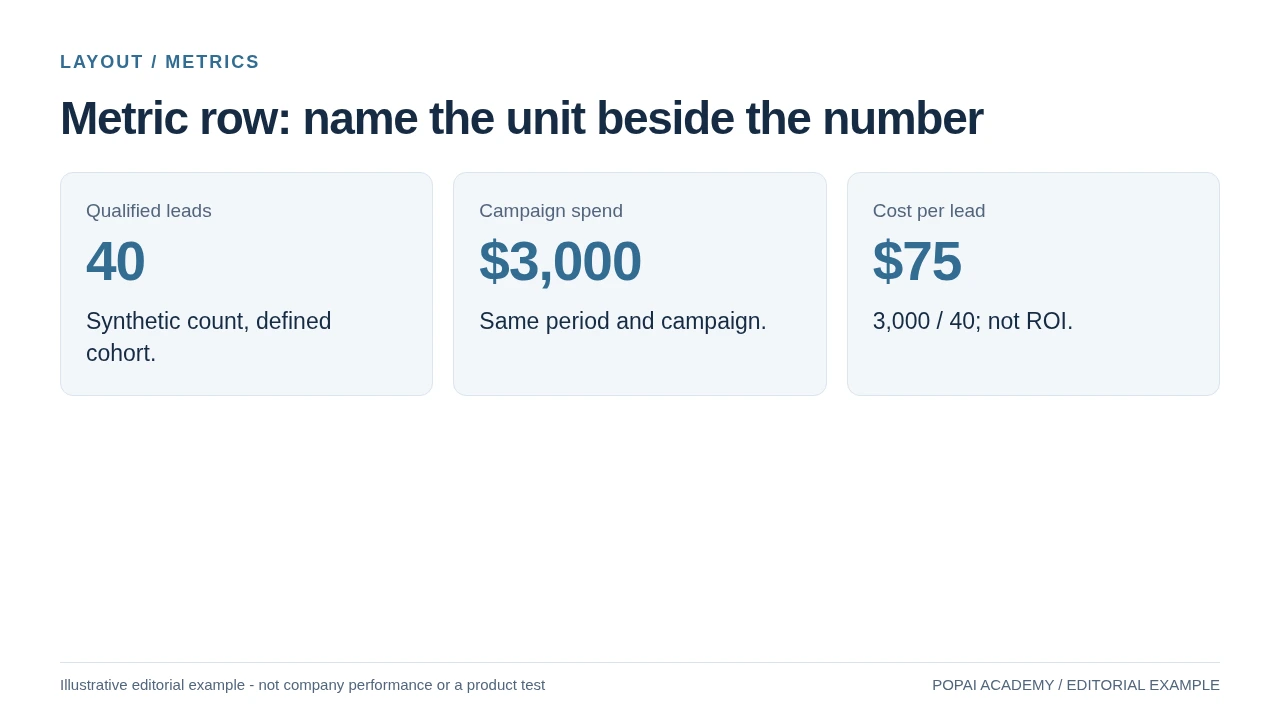
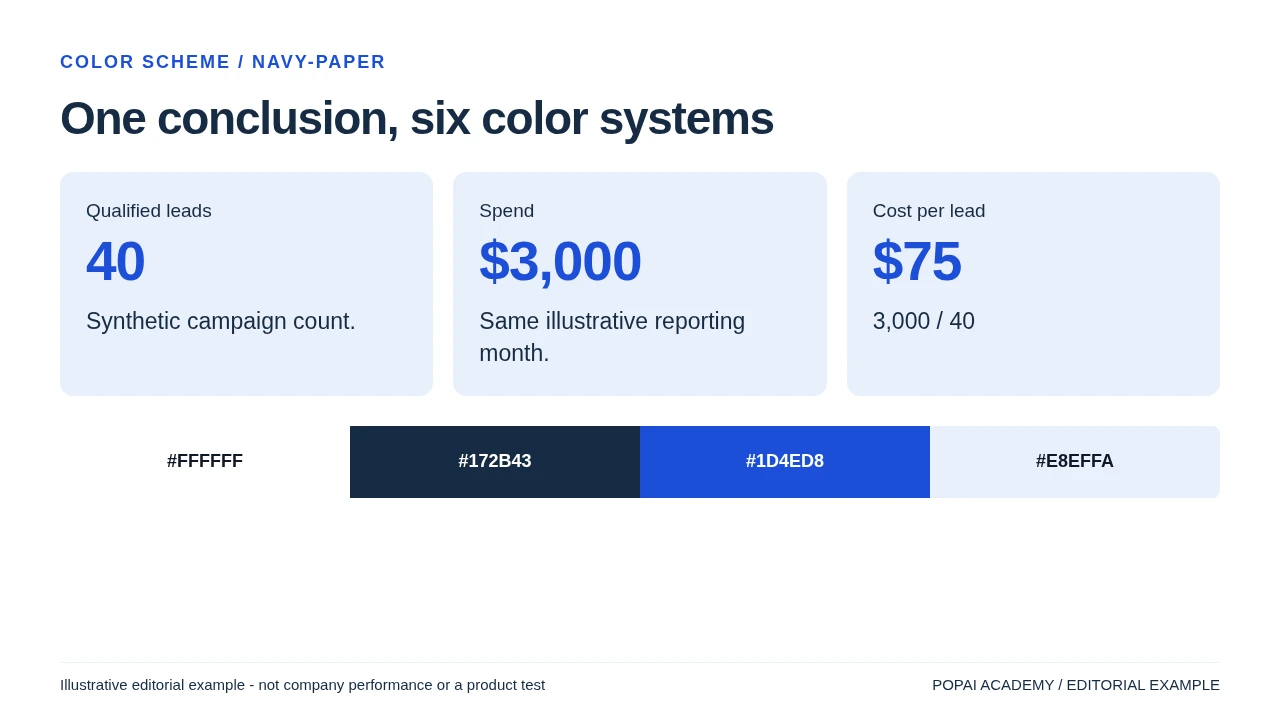
A metric layout makes context and units part of the design.
Read or copy the slide content
Qualified leads
40
Synthetic count, defined cohort.
Campaign spend
$3,000
Same period and campaign.
Cost per lead
$75
3,000 / 40; not ROI.
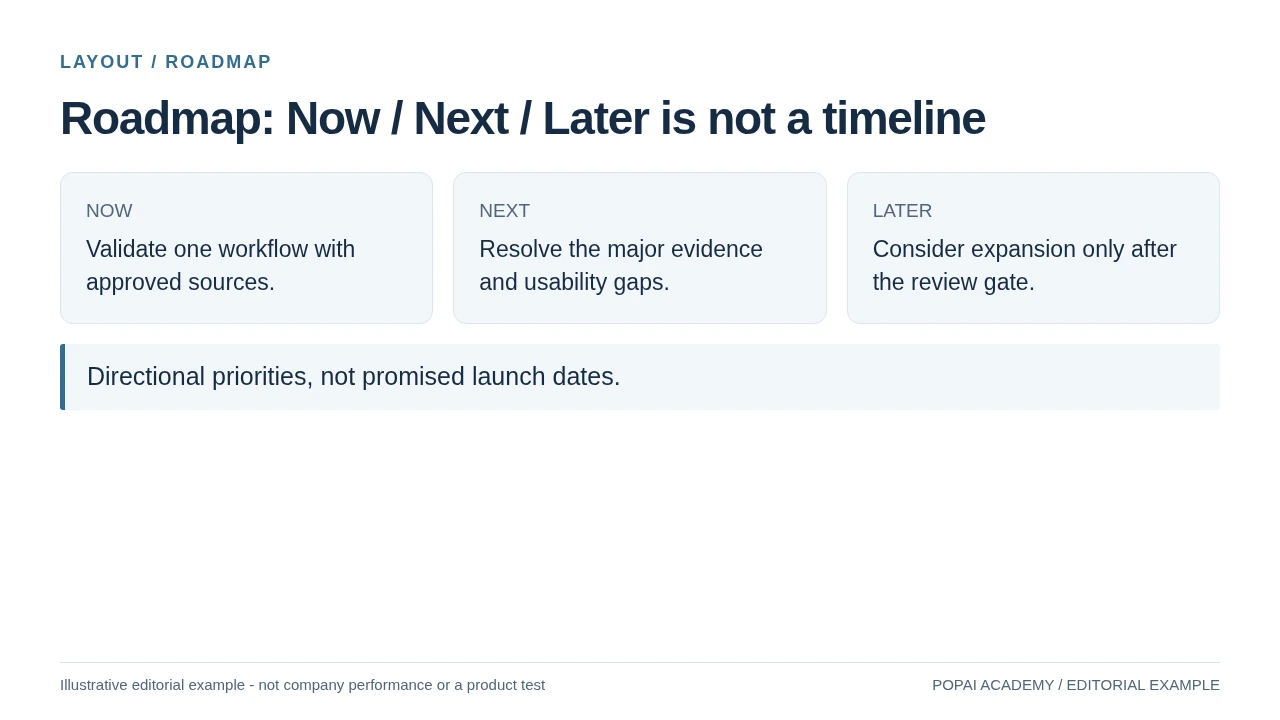
Use a roadmap for contingent priorities; use a timeline for approved dates.
Read or copy the slide content
NOW
Validate one workflow with approved sources.
NEXT
Resolve the major evidence and usability gaps.
LATER
Consider expansion only after the review gate.
Directional priorities, not promised launch dates.
Prompt for this example set
Create a slide with the purpose "Roadmap: Now / Next / Later is not a timeline". Use these approved source fields or replace the illustrative inputs before use: NOW Validate one workflow with approved sources. NEXT Resolve the major evidence and usability gaps. LATER Consider expansion only after the review gate. Directional priorities, not promised launch dates.. Preserve labels, units, source notes and any uncertainty. Do not add results, claims, customers or capabilities. Suggest a readable layout and keep the output editable in the chosen tool.
Best Layouts for AI Slides by Slide Purpose
Choose the audience’s task first; the content type and slide layout follow.
Before choosing a visual style, write one sentence describing what the audience should take away. If the slide has two unrelated jobs—such as explaining a process and comparing vendors—split it or decide which job matters most. A conclusion-style title then tells the audience what to notice.
- Opening or section divider: use a clear claim or section name, one line of context, and a relevant image or simple visual. Avoid a full agenda when the audience needs to hear the main point first.
- Problem and response: use a before-and-after or problem-to-response layout when the proposed change directly addresses the stated problem. If the response has several unrelated benefits, show the problem on one page and the evidence on the next rather than implying a one-to-one match.
- Comparison or recommendation: use a compact scorecard for a few options judged by the same criteria; use a recommendation-and-evidence sequence when the choice needs more explanation.
- Process: use numbered stages when the order of actions and handoffs matters.
- Timeline or roadmap: use dated milestones when timing is committed; use Now–Next–Later when sequence or dates may change.
- Data or single statistic: use a chart when a pattern or comparison matters, and a large, qualified figure when one result is the point.
- Close: group the key takeaway, the decision or action requested, and the owner or next date. Do not add a new argument on the final page.
For a 10-minute talk, 7–10 slides can be a starting estimate for a straightforward presentation, not a pacing formula. A live demo, discussion, or technical explanation may need fewer slides; a lesson with exercises may need more. Test the outline by rehearsing it and giving complex pages the time they need.
Practical glance check: show the slide briefly to someone unfamiliar with the deck. If they cannot identify its main point, make the headline or visual hierarchy clearer before adding detail.
Comparison Layouts for Decisions and Trade-Offs
A comparison layout is useful when the options share criteria; it should expose trade-offs, not hide them.
Use columns for options and rows for criteria when the audience needs to compare a small, consistent set. A scorecard works for a handful of criteria; a trade-off diagram is better when two competing factors dominate; a short sequence works when each option needs its own evidence. A large table with many rows and columns may be more useful in an appendix than on a live presentation slide.
Worked example: compare regions and show the trade-off
Illustrative figures below show how a finished slide can make its reasoning inspectable. They are sample values, not market research.
Slide title: “Choose North for faster launch; West offers greater demand.”
| Criterion | North | West | South |
|---|---|---|---|
| Estimated annual demand | 18k units | 26k units | 15k units |
| Launch cost (estimate) | $0.8m | $1.3m | $0.7m |
| Operational readiness (1–5) | 5 | 3 | 4 |
| Risk rating (team judgment) | Low | Medium | Low |
Recommendation: pilot in North if speed and readiness are the priority; choose West if the additional demand justifies the higher cost and readiness work. Put the assumptions in a small footnote or speaker notes: for example, the forecast period, cost scope, and who assigned the risk rating. This makes the recommendation visible without presenting a judgment-based score as a fact.
Do not add a weighted total unless the weights are agreed and shown. Demand, cost, and readiness use different units; a score that combines them can imply false precision. If the options do not share meaningful criteria, use separate evidence pages instead of forcing them into a grid. When choosing among AI presentation makers, compare how easily you can inspect and edit a generated comparison—not just how quickly it appears.
Data Layouts for AI Slides That Lead to Action
Give the chart a clear question, a traceable source, and a qualified takeaway.
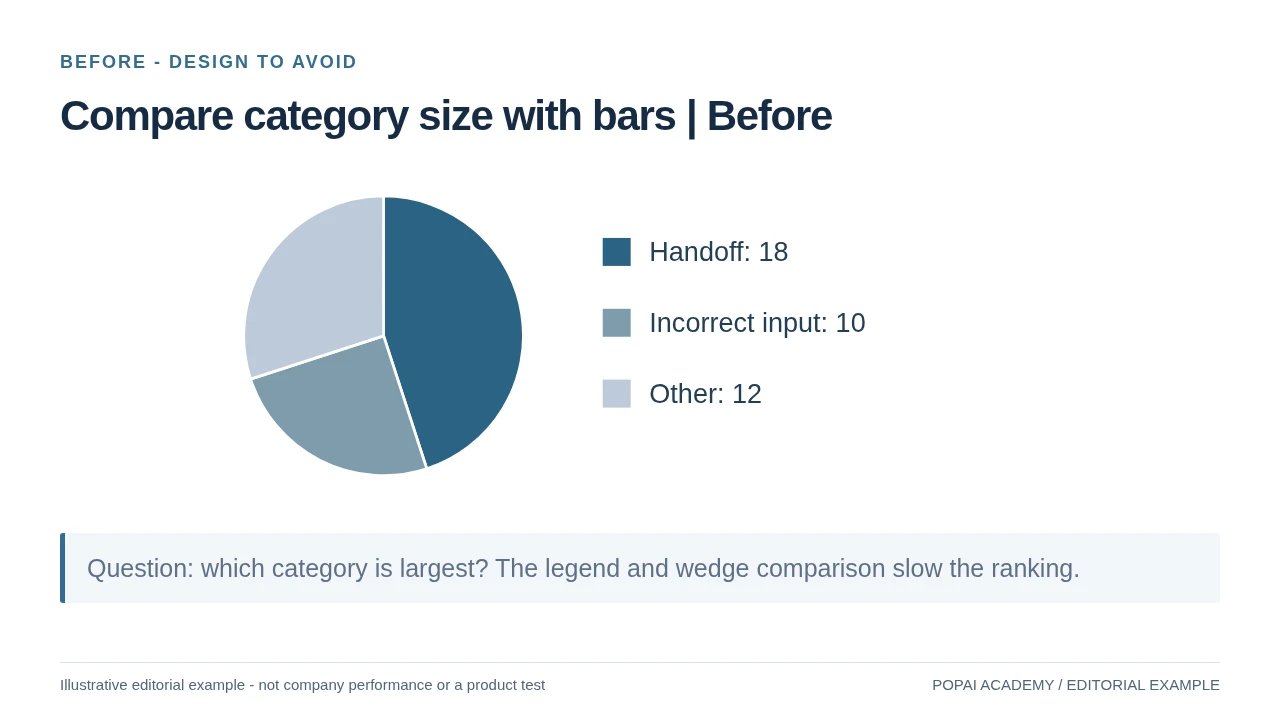
Use a line chart for change over time, bars for comparisons across categories, and a single-number layout when one result is the message. Start with a conclusion-style title, then include the units, time period, and source needed to assess it. If the data are uncertain, incomplete, or based on a small sample, say so next to the chart rather than burying the caveat.
Worked example: show the trend without overstating the cause
Consider this illustrative monthly support dataset: tickets rise from 1,000 in January to 1,100 in February and 1,300 in March, while median first response time moves from 4.0 hours to 4.2 hours and then 5.1 hours. A suitable title is “Ticket volume and median response time rose in March.” Use a line for each monthly trend only if both series remain legible, label the measures and units directly, and annotate March as the point where both increased. Add a source and period beneath the chart.
The figures show two measures moving together; they do not establish that ticket growth caused slower responses. If a dual axis is necessary because the units differ, label both axes plainly and check that the scales do not exaggerate their apparent relationship. Often, two small charts on one slide are safer. Avoid truncated axes that distort the size of a change, and note missing months or changes in how a metric was defined.
After generation, compare every plotted value with the source table and check the axis range, category order, units, and any annotations. If the slide combines a chart with a target or benchmark, label that reference and its source too. Split the material across slides if the chart, benchmark, and takeaway cannot be read at presentation size.
Working rule: one chart, one question, one implication. Add a second visual only when it helps answer the same question, such as showing a target beside actual performance.
Process, Timeline, and Roadmap Layouts
Make the sequence, ownership, and uncertainty visible without turning the slide into a project plan.
A process flow explains the order of actions; a timeline emphasizes dates and milestones; a roadmap communicates priorities when exact sequencing or dates may change. Use fixed dates only when they are commitments. For exploratory work, use phases or Now–Next–Later and label dates as estimates—or omit them.
Worked example: a four-stage launch process
For a left-to-right process slide, give each stage a short action, owner, and output. Connect stages with arrows only where the work genuinely passes forward.
- Discover → product lead: confirm the customer need; output: agreed success measure.
- Design → research and design: test a prototype; output: validated changes.
- Deliver → engineering: release the first version; output: launch-ready product.
- Learn → growth team: review adoption; output: next improvement decision.
If design and engineering can work in parallel, show parallel lanes rather than a strictly linear chain. Mark a true approval or go/no-go point with a decision diamond and label the decision owner. For a roadmap, group work into three or four readable phases and use connectors only for real dependencies; avoid promising dates for work that is still uncertain.
Use a neutral workflow in any slide tool: draft the stages, owners, and outputs from the source plan, then inspect whether arrows and labels represent actual dependencies. You can also draft and refine a deck with PopAi AI Presentation; whichever tool you use, verify dates, ownership, and sequence against the plan before sharing.
How to Prompt and Refine AI Slide Layouts
Give the generator a brief it can follow, then revise the specific layout failure instead of asking for a vague polish.
Brief the generator with purpose and source boundaries
Start with the audience, the decision or learning goal, and the source material. Ask for a slide-by-slide outline before requesting finished layouts. Treat any point limit as a starting constraint: an image-led slide may need almost no text, while a technical slide may need a diagram and a short explanation rather than three generic bullets.
For confidential material, check the tool’s data-handling terms and your organization’s policy before uploading. Keep a source file or citation beside every claim and chart value; an AI-generated citation is not proof that the source exists or supports the statement.
Revise one diagnosed problem at a time
Example revision cycle: an initial draft puts four launch stages into a paragraph. Diagnose the problem as unclear sequence and ownership, then request: “Replace this paragraph with four numbered stages from left to right. Keep each label under five words, add the owner and output below each stage, and do not add dates.” Review the result against the source plan—especially the order, owners, and outputs—before accepting it. If the tool repeats the same layout across the deck, name the purpose of each slide and request a different structure only where the content warrants it.
If a generator ignores a layout instruction, simplify the request or build that slide manually in the presentation editor. Never accept invented numbers to fill a chart: replace them with verified source data or use a clearly labeled placeholder until the data are available.
Check the slide, then inspect the exported file
- Message: Does the title state the takeaway, and does the visual support it?
- Evidence: Can every figure, claim, and citation be traced to the supplied material? Check calculations and chart values against the source.
- Legibility: Can the text be read at presentation size? Check contrast, font size, and whether color is the only way to distinguish categories.
- Reading order: Does the slide make sense when read from top to bottom or left to right, including for someone using assistive technology?
- Export: Open the exported file on the device or software you will present from. Inspect fonts, line breaks, chart labels, image quality, and editable elements.
In a text-to-slides tool, review the outline and source fidelity before polishing individual pages. In a presentation editor, you may have more control over manual adjustments, but still check the final export. A clean preview does not guarantee that fonts, charts, and spacing will render identically on another device.
Choose the Layout by Content Volume
| Layout | Practical content budget | Frequent mistake |
|---|---|---|
| Comparison | Two or three options with matched criteria | Different criteria in each column |
| Timeline | A short set of genuinely dated milestones | Dates invented to fill a template |
| Process | A few actions with a visible decision gate | Arrows with no clear direction or owner |
| Three-card conclusion | One distinct role per card | Three repeated claims |
| Metric row | A few figures with units and definitions | Numbers without scope or denominator |
| Roadmap | Now / Next / Later priorities | Presenting contingent plans as launch commitments |
These are starting limits, not universal presentation rules. When a layout cannot hold the evidence at a readable size, split the page rather than shrinking everything. Chart type is covered separately in the chart-selection guide.