An AI-generated deck can look consistent at first glance and still fail in use: a forecast series changes color halfway through, or pale chart labels disappear on a projector. The palettes below pair HEX values with practical roles and slide examples, so you can choose a direction, prompt for it, and check the results rather than relying on “make it professional.”
Six Color Schemes Applied to the Same Slide
All six palettes use identical content and geometry. Contrast ratios are calculated from the stated HEX colors with the WCAG relative-luminance formula. They apply to these specified pairs, not to every possible image or chart in a deck.
Open full-size examples and editable HTML layouts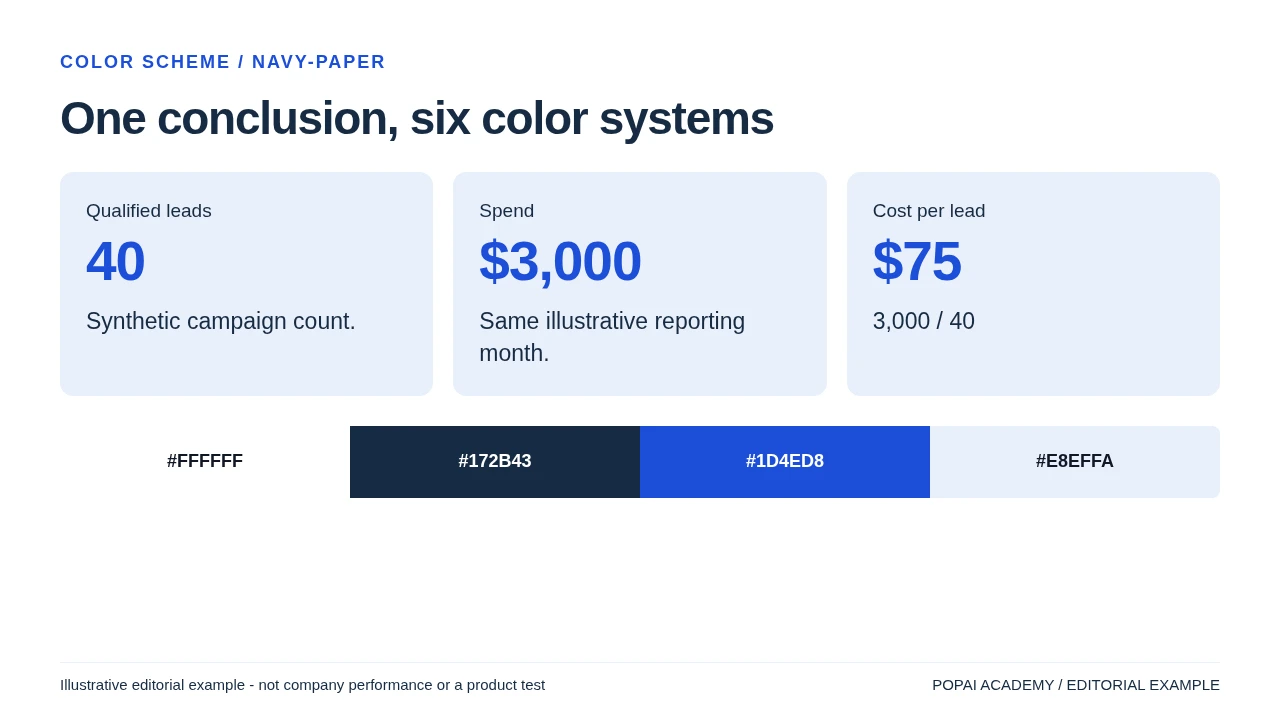
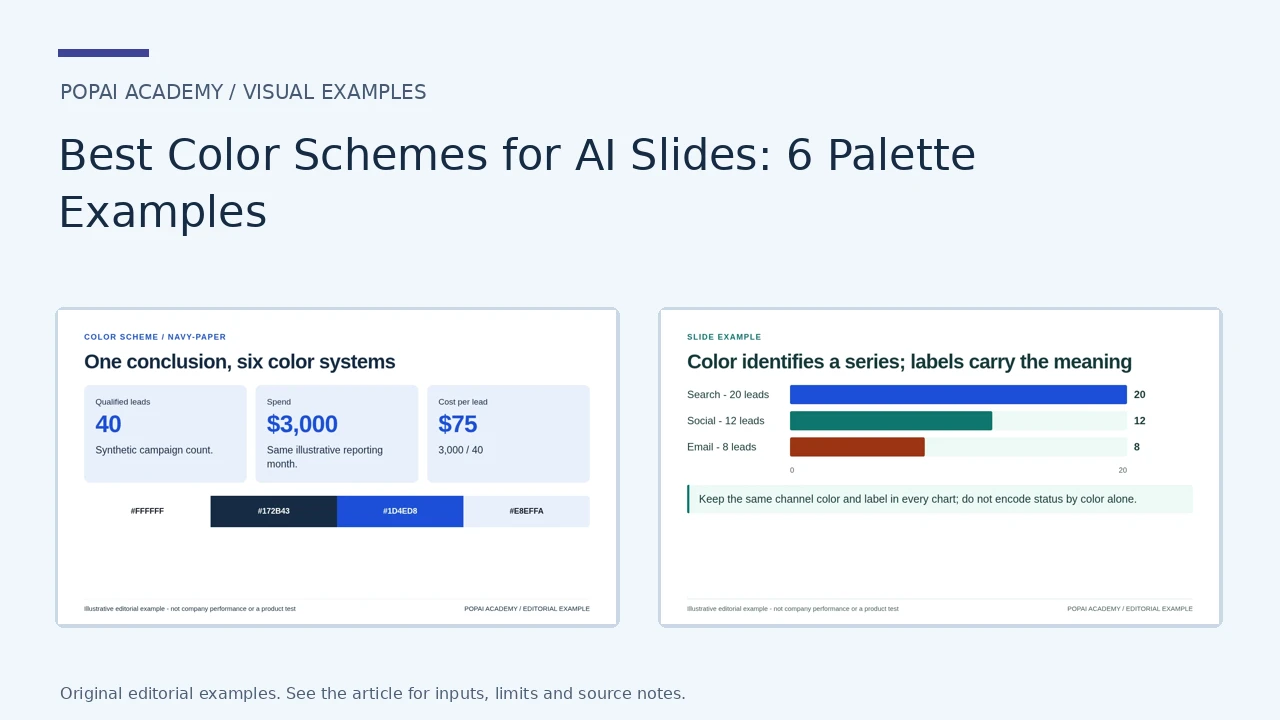
Same content; navy-paper. Text/background contrast 14.35:1; accent/background 6.70:1.
Read or copy the slide content
Qualified leads
40
Synthetic campaign count.
Spend
$3,000
Same illustrative reporting month.
Cost per lead
$75
3,000 / 40
#FFFFFF
#172B43
#1D4ED8
#E8EFFA
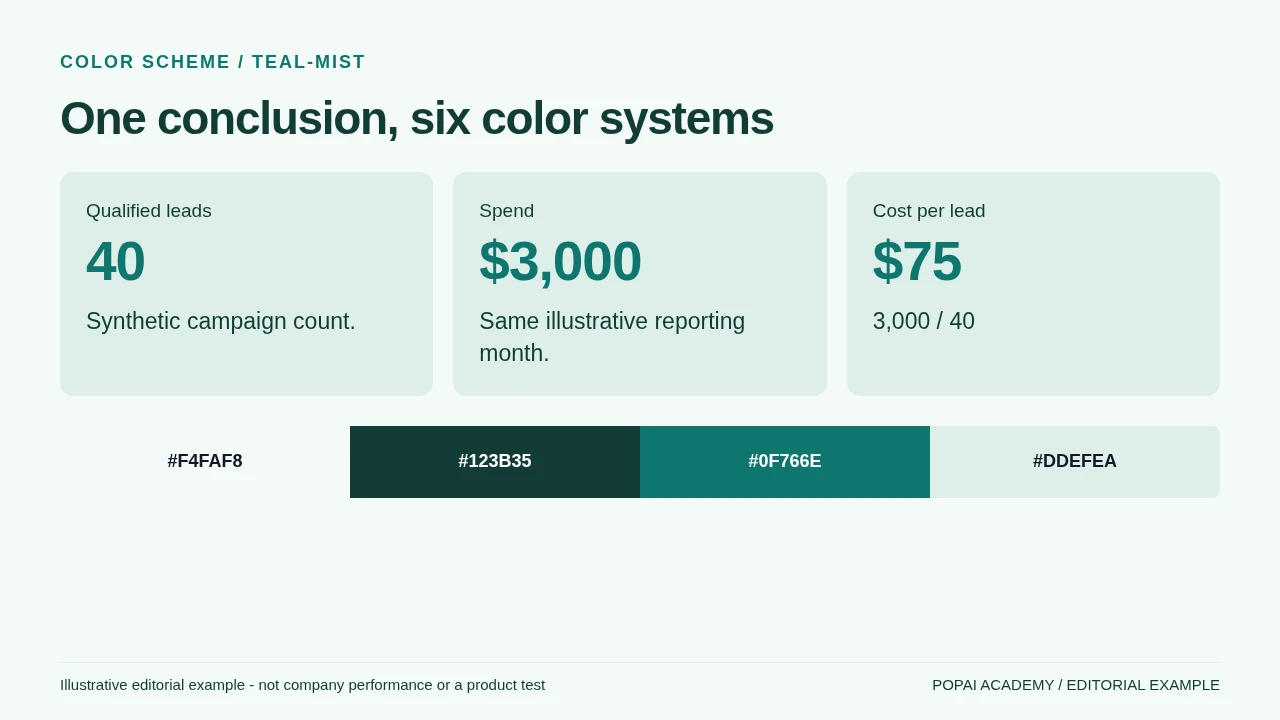
Same content; teal-mist. Text/background contrast 11.67:1; accent/background 5.18:1.
Read or copy the slide content
Qualified leads
40
Synthetic campaign count.
Spend
$3,000
Same illustrative reporting month.
Cost per lead
$75
3,000 / 40
#F4FAF8
#123B35
#0F766E
#DDEFEA
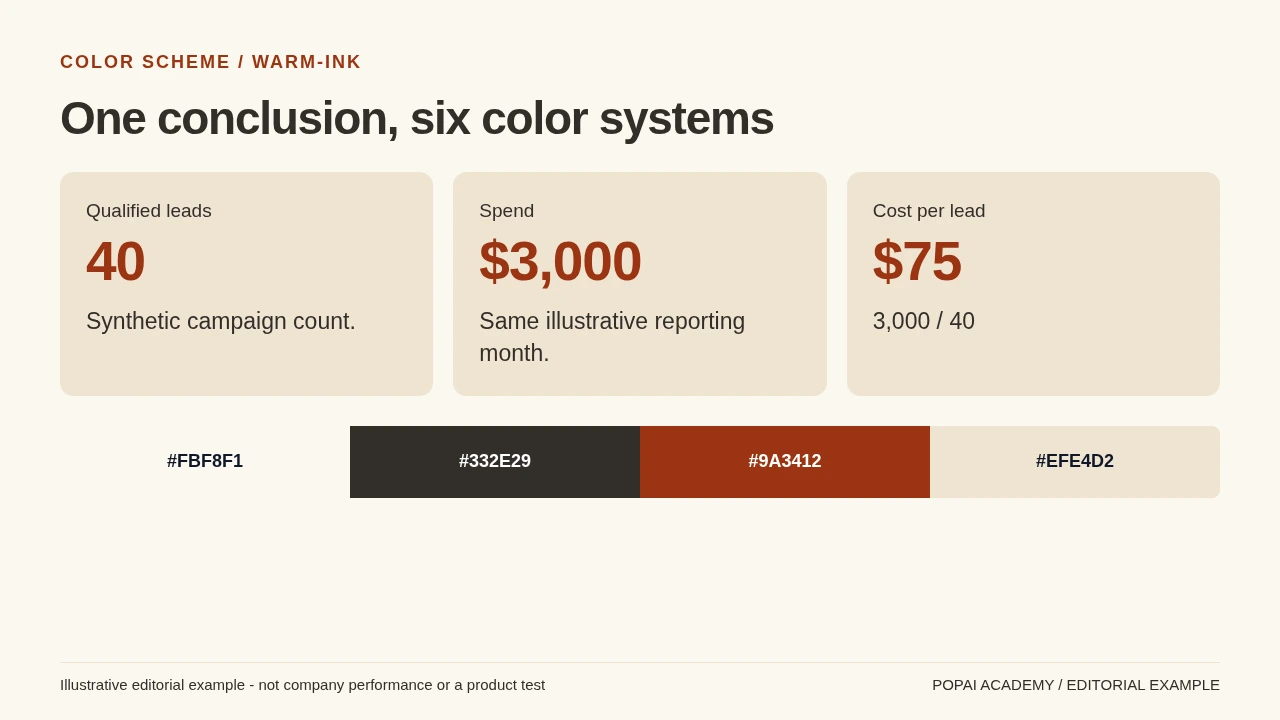
Same content; warm-ink. Text/background contrast 12.66:1; accent/background 6.89:1.
Read or copy the slide content
Qualified leads
40
Synthetic campaign count.
Spend
$3,000
Same illustrative reporting month.
Cost per lead
$75
3,000 / 40
#FBF8F1
#332E29
#9A3412
#EFE4D2
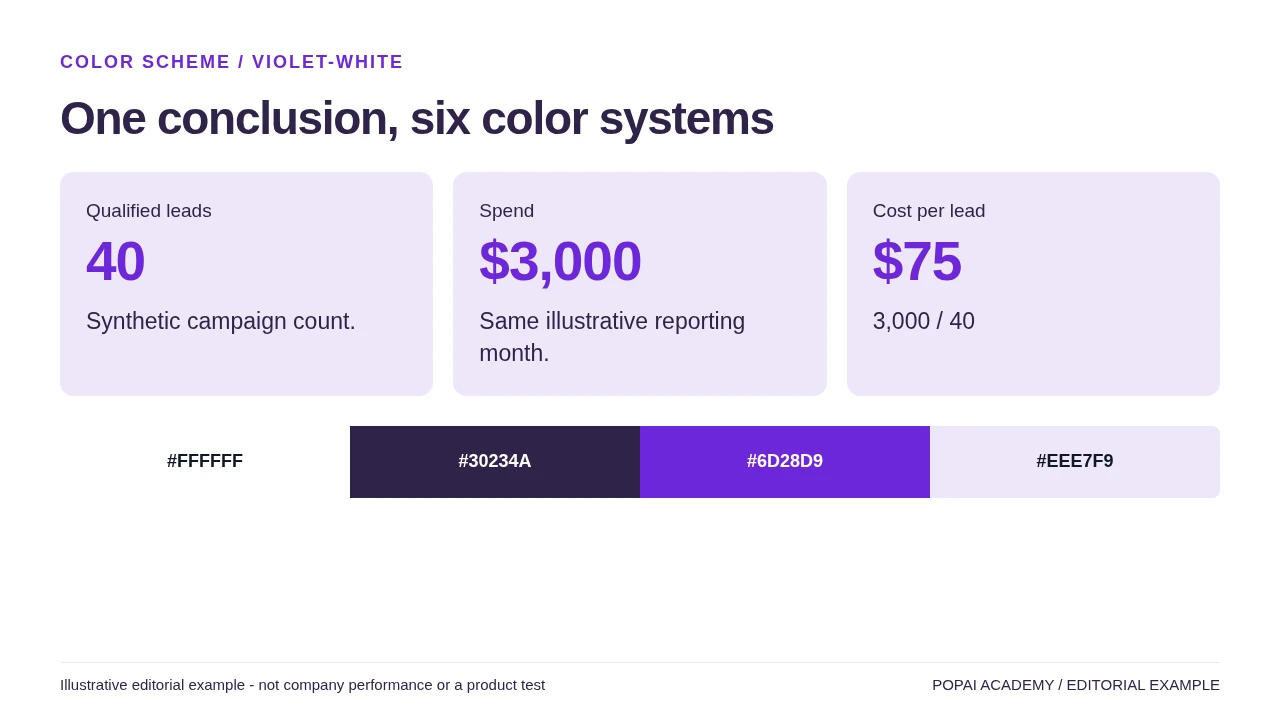
Same content; violet-white. Text/background contrast 14.33:1; accent/background 7.10:1.
Read or copy the slide content
Qualified leads
40
Synthetic campaign count.
Spend
$3,000
Same illustrative reporting month.
Cost per lead
$75
3,000 / 40
#FFFFFF
#30234A
#6D28D9
#EEE7F9
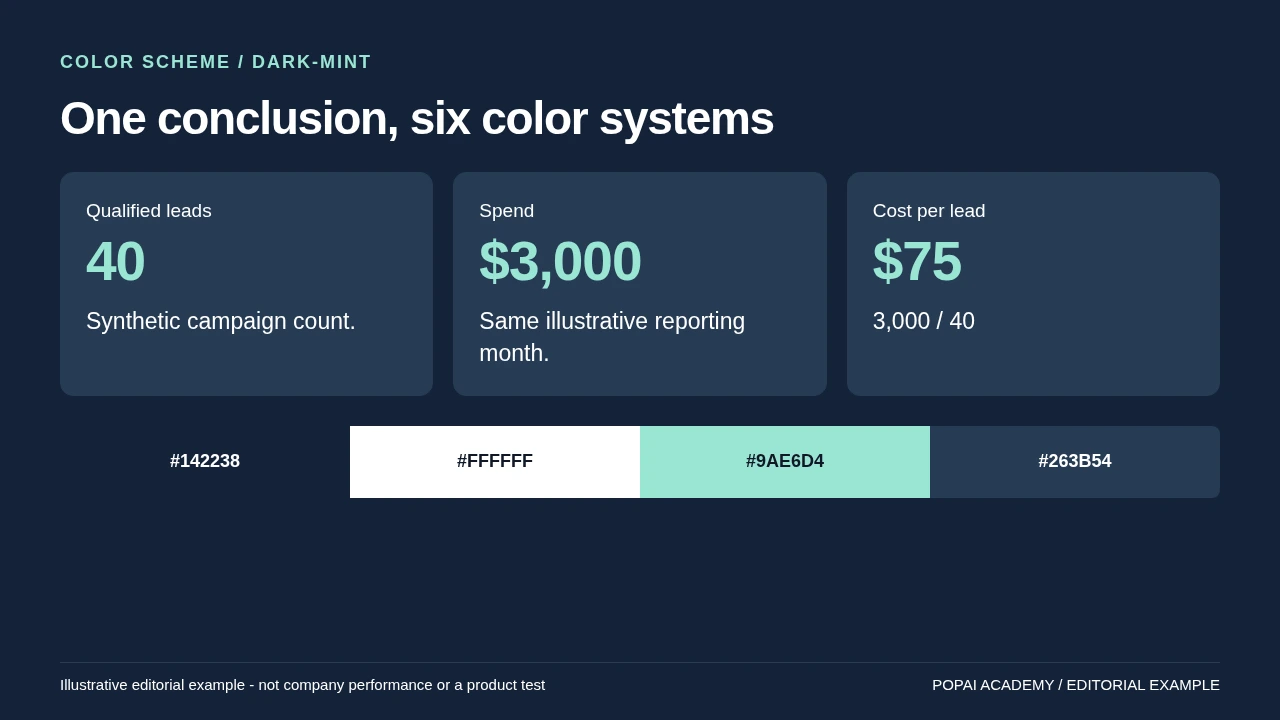
Same content; dark-mint. Text/background contrast 15.96:1; accent/background 11.13:1.
Read or copy the slide content
Qualified leads
40
Synthetic campaign count.
Spend
$3,000
Same illustrative reporting month.
Cost per lead
$75
3,000 / 40
#142238
#FFFFFF
#9AE6D4
#263B54
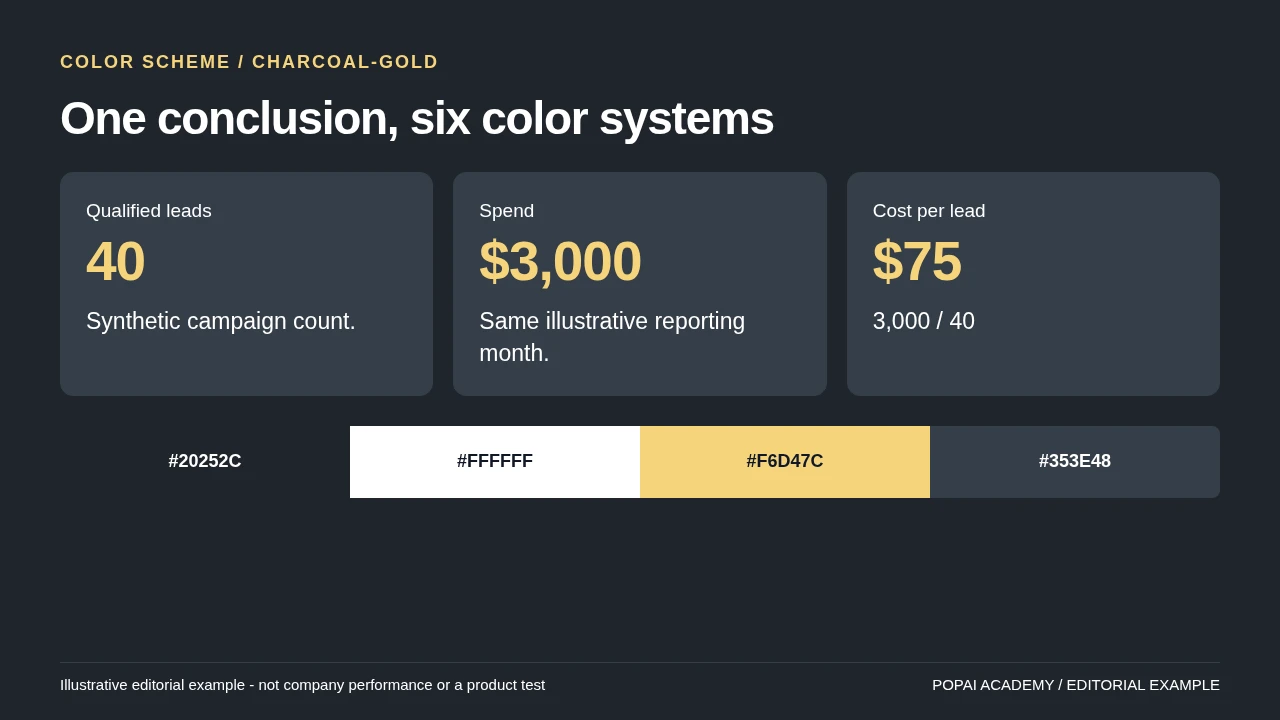
Same content; charcoal-gold. Text/background contrast 15.41:1; accent/background 10.74:1.
Read or copy the slide content
Qualified leads
40
Synthetic campaign count.
Spend
$3,000
Same illustrative reporting month.
Cost per lead
$75
3,000 / 40
#20252C
#FFFFFF
#F6D47C
#353E48
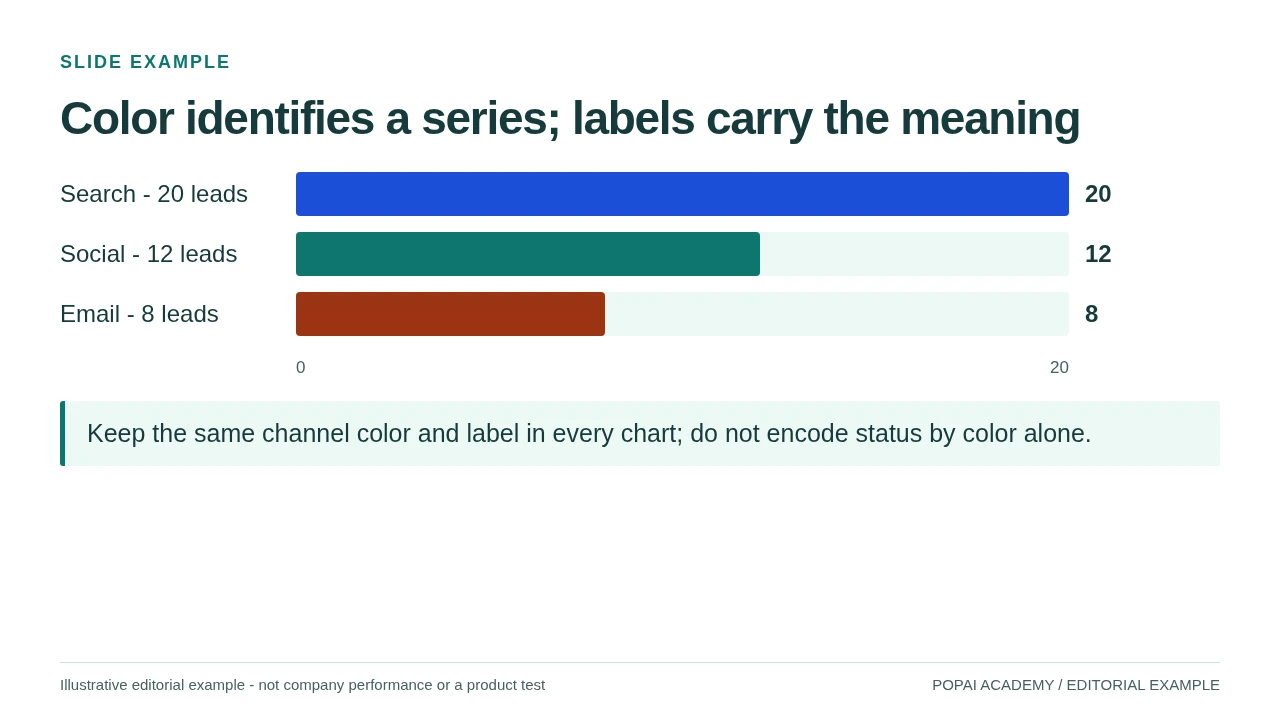
Fictional chart-color demonstration. Series names and counts remain readable without color.
Read or copy the slide content
Search - 20 leads
20
Social - 12 leads
12
Email - 8 leads
8
0
20
Keep the same channel color and label in every chart; do not encode status by color alone.
Prompt for this example set
Apply navy-paper to the same slide: background #FFFFFF, text #172B43, accent #1D4ED8. Keep counts, labels and geometry unchanged.
Best Color Schemes for AI Slides by Use Case
Choose a palette for the job the deck needs to do: support dense reading, make data easy to scan, or give a product story a more expressive feel. The examples below are starting systems, not rules about what particular colors universally mean.
Think of “three to five colors” as three to five roles, not necessarily the total number of HEX values in a finished deck. A neutral background and text color count; lighter and darker shades can be added for charts or states, but should not create new meanings by accident. In the examples, the contrast notes refer to text on the listed light background, not to every possible use of each swatch.
Choosing between them: start with brand requirements, then consider how much text and data the deck contains and where it will be viewed. A light neutral background is a safe starting point for a text-heavy deck or a room with uncertain projection. Dark slides can make product imagery or a short keynote feel immersive, but small text and thin chart lines need extra scrutiny. For scientific or medical content, prioritize legible neutrals and clearly labeled data over dramatic effects. If brand colors do not have enough contrast, keep them in logos, large shapes, or accents and add accessible text and background colors around them.
Example on a slide: In a quarterly investor update using the navy palette, put the title and body text in navy, use a mist panel for a short takeaway, and keep the chart background white. If actual revenue and forecast share a chart, assign them stable colors and label them directly; do not use the palette’s slate simply because a series needs another hue.
Decide what a color means before the first slide is generated. Repeating that meaning is more useful than adding another accent to make a page feel finished.
How to Prompt AI for Consistent Slide Colors
A prompt can set clear constraints, but it cannot guarantee that every generated slide will use exact HEX values. Give the model color roles, specify what to avoid, and plan to check the exported slides—especially charts and small labels.
Copy-ready prompt for a business deck
This prompt matches the business palette above: it does not introduce an unlisted amber accent or require a highlight on every slide. For a non-business example, try: “Create an eight-slide training deck using warm ivory #F9F7EF backgrounds and deep brown #5B554B text. Use sand #E8DFC9 for exercise panels. Keep body text dark, label each activity in words, and avoid using color alone to signal an answer or instruction.”
After generation, compare the title slide, one dense text slide, and one chart slide against the prompt. Check whether the background and text roles stayed stable, whether a chart introduced an unrequested color, and whether any labels became hard to read. These are constraints for a first draft, not proof that the result is accessible or brand-compliant.
In PopAi, you can generate a deck from a prompt or source material, review the proposed content plan, and refine the result using editing tools and theme options. Check the overall theme first, then inspect individual slides for color drift. If you are comparing AI presentation makers, include palette control and post-generation editing in your evaluation—not only the first generated slide.
Apply Color by Slide Role, Not by Guesswork
Consistency means keeping the job of each color stable across different layouts, not making every slide look alike.
- Title slide: use the main background and title color; keep any accent to one focal detail, such as a key figure.
- Content slide: use the same background and text pairing, with a panel color only when it separates related information.
- Chart slide: keep the chart background and text system, then assign colors according to what the data represents.
- Divider or closing slide: a darker background can create a change of pace, but retain a familiar accent or type color so the slide still belongs to the deck.
Worked chart example: In a revenue deck, blue can represent actuals and slate can represent forecast on every chart; direct labels such as “Actual” and “Forecast” should repeat that mapping. If the chart compares many regions, do not invent a new meaning for the same blue. Group minor regions, use small multiples, or label the lines directly. For ordered values, use a light-to-dark sequential scale; for values diverging around a meaningful midpoint, use a diverging scale with that midpoint clearly explained. For categorical comparisons, choose distinguishable hues and add labels or markers.
A brand color and a data color may happen to be the same, but do not let one role silently override the other. If the brand accent is also used for “forecast,” keep that data mapping stable and use a different treatment—such as a border or a label—for promotional emphasis. In PopAi’s chart editing tools, series colors can be adjusted alongside chart details; after editing, check that the legend and labels still match the data.
Check Contrast, Accessibility, and Projector Readability
Text contrast, chart distinguishability, and projector readability are related but separate checks. A color pair can pass a text contrast threshold and still be difficult to tell apart from another chart series, especially in a washed-out room.
For WCAG 2.1 AA, the contrast ratio is at least 4.5:1 for normal text and 3:1 for large text (at least 24 CSS pixels, or about 18.7 pixels when bold). Use a contrast checker such as WebAIM’s Contrast Checker to test the actual foreground and background HEX values; a palette as a whole cannot “pass” because each pairing is different.
For example, navy #142B4A on white #F8FAFC and deep brown #5B554B on ivory #F9F7EF are strong text pairings. By contrast, blue #4D96FF on light gray #F3F4F6 is roughly 2.8:1, so it does not meet the normal-text threshold. Use that blue as a large shape or accent, not as small text; put dark ink text beside or over it only after checking the exact pairing. These ratios are useful starting checks, not substitutes for viewing the deck at its final size.
Review text, charts, and the room separately
- Text: check body copy, captions, chart labels, and text placed over photographs. Add a solid panel behind text if the image makes the background inconsistent.
- Charts: use labels, line styles, markers, or patterns as well as color. A grayscale preview is a quick way to spot charts that depend on hue alone.
- Projection: view the deck full-screen and from a distance. Increase small labels and strengthen faint lines or pale fills that disappear on the expected display.
- Color-vision differences: preview with a color-vision simulator, but do not treat simulation as a substitute for direct labels or distinct shapes.
- Export: check the file in the presentation software and display setup you plan to use; colors can look different after export or projection.
In a two-series chart, for example, distinguish actual and forecast with both color and a solid-versus-dashed line, then label each series at its endpoint. The chart remains interpretable in grayscale and does not ask viewers to infer meaning from red, green, or blue alone.
When color carries information, give the audience a second way to read it: a label, shape, line style, or annotation.
Avoid Common AI Color-Scheme Pitfalls
Audit the generated deck for specific failures rather than asking the AI to make it “more polished.” The correction often depends on whether the issue is a prompt gap or a slide that needs manual editing.
- Palette drift: the cover is navy and white, but later slides introduce a new background color. Add a rule for backgrounds to the prompt; if the deck is already generated, correct the theme or affected slides.
- Unclear chart labels: a pale series color looks fine in the legend but disappears against the plot background. Darken the line or marker and add a direct label; changing the deck-wide palette may be unnecessary.
- Theme changes alter data meaning: a new theme recolors series that previously represented actuals and forecasts. Restore the established series mapping manually and check the legend against the data.
- Accent used as body text: gold or bright blue looks prominent but is difficult to read at small sizes. Keep it for large shapes or highlights and use a tested dark text color.
- Too many categories: a chart gains a different color for every item until the legend is difficult to scan. Group categories, label them directly, or split the chart instead of adding more hues.
A quick audit of a long deck does not require reviewing every page equally. First scan the slide sorter for background and accent drift, then inspect one representative text slide and each chart type. Review every slide with text over an image or an unusual background; these exceptions are where otherwise consistent systems most often fail.
With PopAi AI Presentation, you can start from a prompt or supported source material, inspect the generated outline and slides, and continue editing before exporting. Treat generation as a first draft: keep the useful structure, then fine-tune theme, chart colors, and contrast for the people who will view the deck.
A Repeatable Color Workflow for AI Slides
Use this workflow to choose a palette, test it on representative slides, and decide when the deck is ready to share.
- Set the constraints: write down the audience, purpose, brand requirements, amount of data, and whether the deck will be projected or read on-screen.
- Assign color roles: select a background, text color, supporting color, and optional accent. Check contrast for the text pairings before generation; if a required brand color fails, use it as an accent and add a suitable text color.
- Generate with a prompt: specify HEX values, roles, and what the AI should avoid. Include a fallback instruction for when exact values cannot be preserved.
- Review in a useful order: scan all slides for palette drift, then check a dense content slide, each distinct chart type, text over images, and the opening and closing slides.
- Correct and export: fix contrast and chart meaning, preview the exported file at presentation size, and confirm that labels and legends still match the data.
Example: a training deck. The audience will read the slides on laptops and use them later as a reference, so choose the ivory and deep-brown palette rather than a dark presentation theme. Use sand panels for exercises and label each activity “Try it” so the instruction survives grayscale printing. After generation, the dense lesson slide passes the text-pairing check, but the taupe panel makes a small caption hard to read. Move the caption to deep brown, then check a projected view of the exercise slide for readability.
Example: an investor update. The brand requires navy, but the supplied accent color is too light for small chart labels. Keep that accent for large highlights, use navy for labels, and map actuals and forecasts to fixed series colors across the deck. On a chart page, direct labels make the two series understandable even if the projector dulls their color difference.
For a large deck, a practical stopping point is reached when the chosen text pairings meet the relevant contrast target, chart series remain identifiable through labels or other visual cues, and the representative slides are readable in the intended viewing setup. Recheck exceptions after any theme change; no single palette or prompt can remove the need to review them.
How the Color-Pair Ratios Were Checked
| Palette | Background | Text | Accent | Text / background | Accent / background |
|---|---|---|---|---|---|
| navy-paper | #FFFFFF | #172B43 | #1D4ED8 | 14.35:1 | 6.70:1 |
| teal-mist | #F4FAF8 | #123B35 | #0F766E | 11.67:1 | 5.18:1 |
| warm-ink | #FBF8F1 | #332E29 | #9A3412 | 12.66:1 | 6.89:1 |
| violet-white | #FFFFFF | #30234A | #6D28D9 | 14.33:1 | 7.10:1 |
| dark-mint | #142238 | #FFFFFF | #9AE6D4 | 15.96:1 | 11.13:1 |
| charcoal-gold | #20252C | #FFFFFF | #F6D47C | 15.41:1 | 10.74:1 |
For each HEX color, convert sRGB channels to linear light, calculate relative luminance and apply (lighter luminance + 0.05) / (darker luminance + 0.05). W3C's WCAG guidance specifies 4.5:1 for ordinary text and 3:1 for qualifying large text, with stated exceptions. A value below a threshold does not pass by rounding up. These calculations concern the exact flat-color pairs shown; projection, thin strokes, photographs and export still require visual checks.
Use the dark text color for ordinary body copy in the light palettes; the dark palettes use white text and a light accent. Keep labels and direct values on charts so their meaning does not depend only on hue. The six palette ratios and HEX values are listed with their examples above.