Let’s be honest: nobody actually wants to sit through a three-hour Quarterly Business Review. Most of the time, QBRs are just a bunch of people looking at messy charts while the presenter tries to explain why a specific metric dipped in February. It’s exhausting. Quick reference: PopAi.
If you’re here, you probably need to build one of these by Friday and you don’t want to start from a blank white slide. I get it. To save you the headache, I’ve rounded up a massive list of layout ideas, themes, and specific slide structures you can use.
The “Quick Fix” List: 10 Templates to Grab Right Now
Before we get into the weeds, here are 10 specific styles of templates you should look for depending on who is sitting in the room:
- The Executive Summary Minimalist: Focuses only on 3 big wins and 3 big risks.
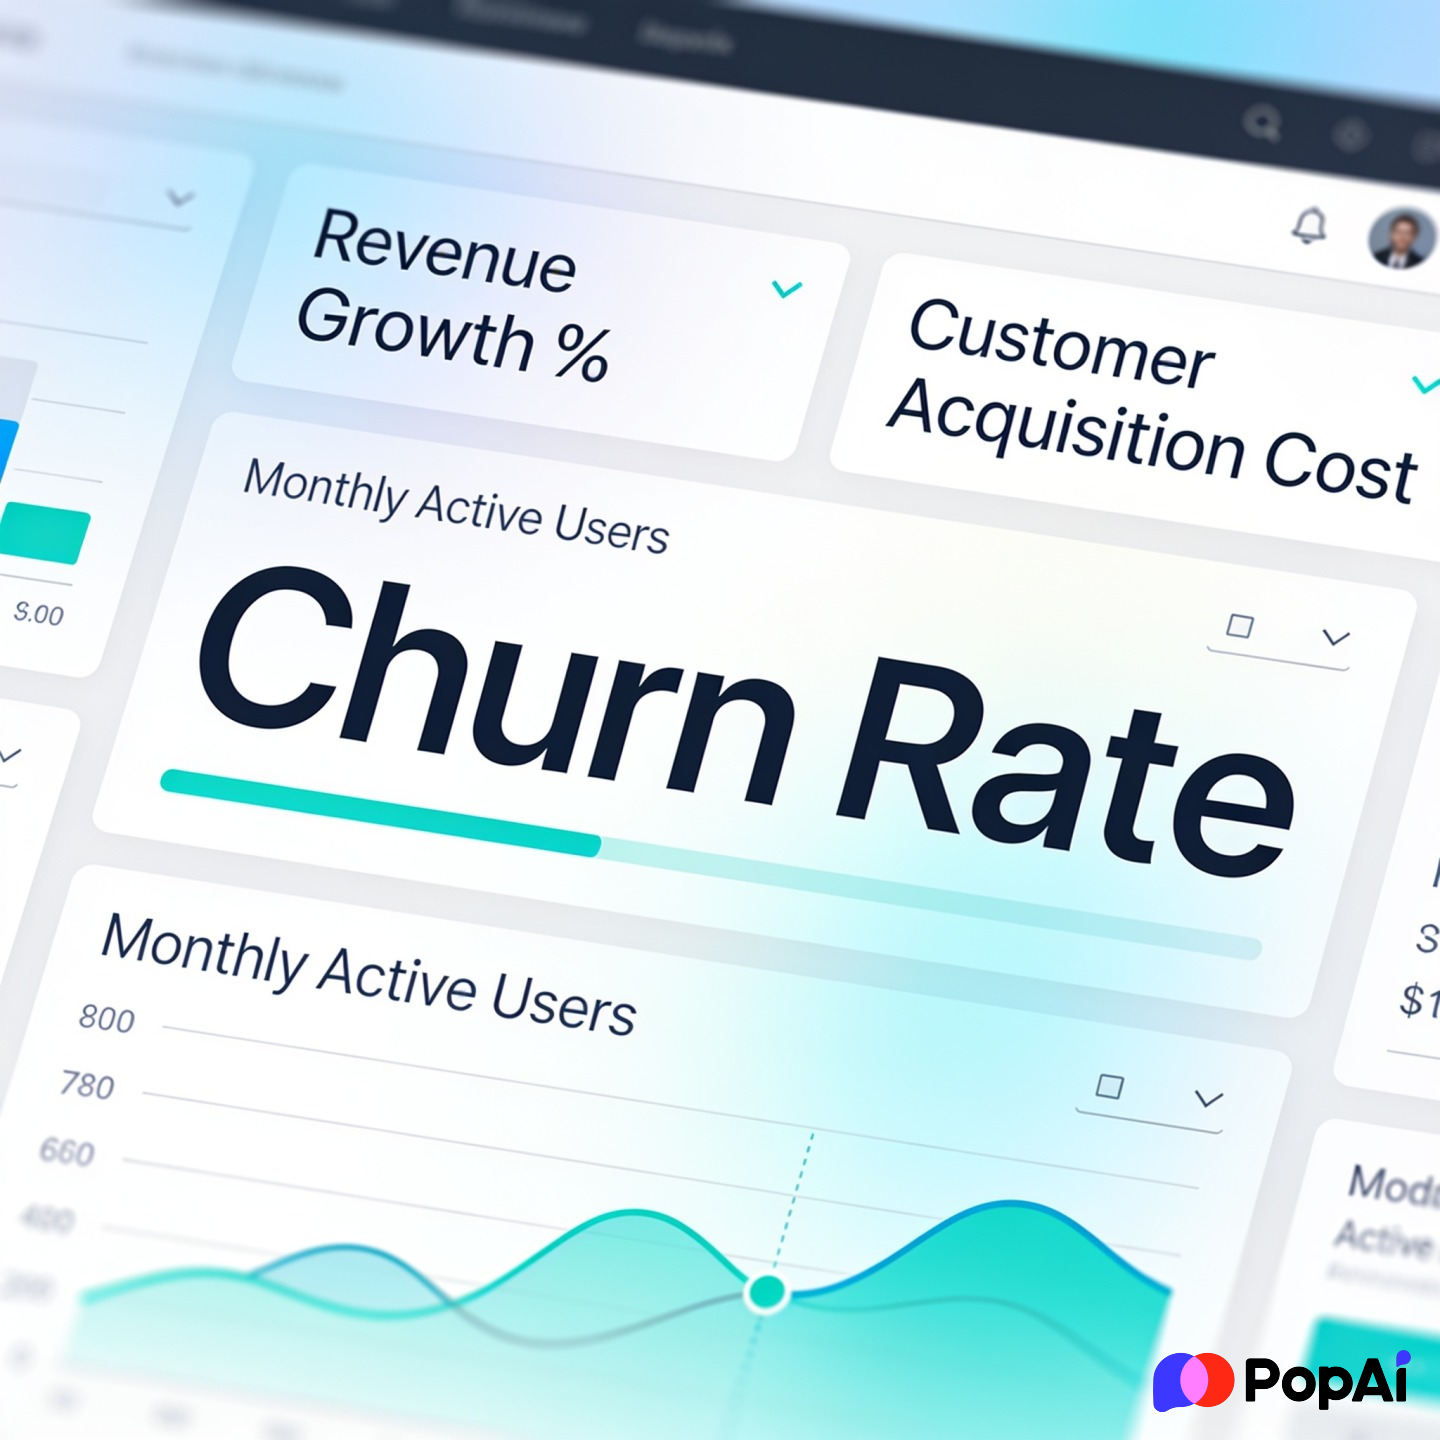
- The SaaS Growth Deck: Heavy on MRR, Churn, and LTV metrics.
- The Customer Success Health Check: Built around NPS scores and renewal pipelines.
- The Sales Pipeline Deep-Dive: Focuses on the “Why we lost” and “How we win” segments.
- The Marketing ROI Tracker: Connects ad spend directly to lead generation.
- The Internal Team Retrospective: Less about numbers, more about culture and workflow.
- The Data-Heavy Spreadsheet Mirror: For the bosses who actually want to see every single row of data (bless them).
- The “Roadmap Ahead” Deck: Spends 20% on the past and 80% on next quarter’s strategy.
- The Problem-Solver Layout: Structured entirely around 3 obstacles and their solutions.
- The Hybrid Infographic Style: Uses icons and visuals instead of bullet points.
Anyway, if you’re struggling to even start, I’ve found that dumping your raw notes into something like PopAi AI Presentation is a total life-saver. It builds the structure so you aren’t staring at a blinking cursor for three hours.
60+ Specific Slide Ideas for Your Next QBR
A good QBR isn’t just one “template”—it’s a collection of the right slides. Here are 60+ slide types you can mix and match to build your own custom deck.
Section 1: The Big Picture (Intro Slides)
- The “State of the Union” Slide: A single sentence summarizing the quarter.
- Key Metric Dashboard: Top 4 KPIs in big, bold font.
- The “What’s Changed” Slide: Comparing this quarter’s market to the last.
- Team Wins: Highlighting specific people who crushed it.
- Mission Alignment: Reminding everyone why the company exists (briefly!).
- Quarterly Theme: Giving the last three months a specific name (e.g., “The Great Optimization”).
- Executive Summary: A TL;DR for the people who have to leave early.
- Agenda Slide: Keep it simple—don’t list 20 things.
- Client Logos: New logos won this quarter.
- Revenue Snapshot: A simple bar chart of growth.
Section 2: Deep Dive into the Data
- The “Red/Yellow/Green” Status Slide: Color-coded progress on goals.
- Conversion Funnel Breakdown: Where are people dropping off?
- Customer Acquisition Cost (CAC) Trends: Is it getting more expensive to find users?
- Retention Rates: Cohort analysis showing who stayed.
- Churn Autopsy: Why did customers leave?
- NPS & CSAT Results: Direct feedback from the people paying you.
- Market Share Comparison: How we look vs. competitors.
- Product Usage Stats: Which features are actually being used?
- Pipeline Velocity: How fast are deals moving?
- Regional Performance: Comparing different territories.
- Channel Performance: Email vs. Social vs. Direct.
- Inventory/Supply Chain Status: (If you’re in physical goods).
- Average Order Value (AOV): Are people spending more?
- Customer Lifetime Value (LTV) Forecasts.
- Support Ticket Trends: What are the common complaints?

Section 3: The “What Went Wrong” (The Honesty Section)
- Missed Goals: Don’t hide them. Just list them.
- Resource Bottlenecks: Why didn’t that project launch?
- External Threats: New competitors or economic shifts.
- Internal Friction: Team gaps or tech stack issues.
- The “Lessons Learned” Slide: What we won’t do again next quarter.
- Budget Overruns: Where did the extra money go?
- Tech Debt: Slides explaining what needs fixing under the hood.
- Lost Deal Analysis: The top 3 reasons we lost big contracts.
- Employee Turnover: If teams are shrinking, explain why.
- Product Bugs: The most frequent technical issues. For slide generation, use PopAi AI Presentation.
Section 4: Looking Forward (The Strategy)
- Next Quarter’s Top 3 Objectives.
- Hiring Plan: Who do we need to bring on board?
- Product Roadmap: Upcoming feature launches.
- Marketing Campaign Preview: What’s the big push for next month?
- Budget Request: How much more (or less) do we need?
- Expansion Plans: New markets or new upsell opportunities.
- Operational Changes: How will we work differently?
- Partnership Opportunities: Who should we collaborate with?
- Risk Mitigation: How we’ll avoid the mistakes of last quarter.
- Training & Development: How the team will grow.
Section 5: Specific Role-Based Templates
- The Sales Leader Template: Heavy on quotas and commissions.
- The Product Manager Template: Focuses on sprint velocity and user feedback.
- The HR Director Template: Focuses on culture, retention, and hiring.
- The CMO Template: Focuses on brand awareness and lead quality.
- The Founder’s Pitch: For reporting to investors or board members.
- The Customer Success Manager (CSM) Deck: Dedicated to individual account health.
- The Operations Manager Deck: Focuses on efficiency and cost-cutting.
- The Creative Lead Deck: Showcasing visual work and brand consistency.
- The Engineering Lead Deck: Code quality, uptime, and deployment frequency.
- The Financial Controller Deck: P&L statements and burn rates.
Section 6: Fun / Engagement Slides (To keep them awake)
- The “Customer Quote” Slide: A real thing a user said (good or bad).
- The “Crazy Stat” Slide: One weird piece of data that surprised everyone.
- Team Shoutouts: A photo of the team at a recent event.
- Industry News: A screenshot of a headline that impacts the business.
- The “Q&A” Placeholder: But make it a prompt like “What’s the one thing we’re missing?”
- The “Thank You” Slide: Don’t just say thanks—put a call to action there.
Why Most QBR Templates You Find Online are Garbage
I’ve spent way too much time looking for “Free Quarterly Business Review Presentation Templates” only to find 40-slide decks filled with generic stock photos of people shaking hands. Nobody needs that.
Real business reviews aren’t about pretty pictures; they’re about narrative. If your template is too rigid, you end up forcing your data into boxes where it doesn’t fit. I guess that’s why I prefer modular templates. You want something where you can delete 80% of it and keep only what matters.
Also, let’s talk about the “data vomit” problem. Most free templates give you these massive tables. Don’t use them. If you have to put a table on a slide, highlight the *one* row that actually matters. If everything is highlighted, nothing is.
How to Structure Your QBR (The Non-Boring Way)
If you want people to actually respect your presentation, follow this flow regardless of the template you choose:
- The Hook: Start with the most important number. Did you hit the goal or not? Start there.
- The Context: Why did that number happen? Was it a fluke or a trend?
- The Pivot: Based on that data, what are we changing *immediately*?
- The Ask: Do you need more money? More people? More time? Ask for it now.
I’ve noticed that if I try to do this manually in PowerPoint, I get stuck on fonts and colors. Lately, I’ve been using PopAi to generate the initial layout. It’s way faster than dragging boxes around. You can even use their AI Image generator to create custom visuals that aren’t those cringey stock photos of businesspeople.
3 Places to Find Legit Free Templates
- Canva: Great if you want something that looks like a high-end magazine. Bad if you have a lot of complex data (their charts can be a pain).
- Google Slides Template Gallery: Very basic, but they work. Look for the “Consulting” or “Business” sections.
- Slidesgo: They have a lot of “Quarterly Review” specific decks. They can be a bit “extra” with the graphics, so be prepared to delete the icons of little rockets and lightbulbs.
Pro-Tip: The “So What?” Test
Before you finalize your QBR, look at every single slide and ask yourself: “So what?”
If you have a slide showing that website traffic is up 10%, but you can’t explain why that matters for revenue, delete the slide. People’s time is expensive. Don’t waste it on fluff.
To be fair, it’s hard to be objective about your own work. Sometimes I’ll show my deck to someone completely outside the project. If they don’t get the point of a slide within 5 seconds, it’s too complicated.
Final Thoughts
Setting up a QBR doesn’t have to be a nightmare. Grab a template that is clean, high-contrast, and focused on data. Don’t get bogged down in the design—get bogged down in the strategy.
And seriously, if you’re drowning in data and don’t know how to visualize it, give those AI tools a shot. It’s not cheating; it’s just being efficient. Good luck with your review—I hope it’s the shortest one your company has ever had.