Turning notes and metrics into a convincing case study means choosing what matters, showing where each claim came from, and resisting the urge to make mixed evidence sound like a perfect success. This guide walks through a fictional onboarding case from source notes to a corrected slide, so you can use AI for drafting while keeping the evidence and decisions under your control.
How to Make a Case Study Presentation with AI: Start with the Story
A useful case study explains the situation, the response, and what the evidence says changed. Start by writing one sentence about what your audience should understand or decide; use it to filter out details that do not support the point.
Choose a structure for the audience
- Customer success or sales: client context, challenge, response, implementation, evidence of results, limitations, and a relevant next step.
- Academic analysis: case background, research question, method or framework, findings, limitations, and implications.
- Consulting or executive decision: decision needed, current state, diagnosis, options, recommendation, risks, and implementation plan.
As a planning heuristic, a short talk may need 6–10 slides, while a 15-minute presentation may need more if it includes detailed data or a live demonstration. Discussion time, slide density, and the audience’s familiarity with the subject matter matter more than a fixed slide count. Give each slide one main point, and omit background that does not help explain the decision or result.
“The project worked” is a conclusion without evidence. “Completion rose from 42% to 58% across two groups of 50 users” gives the audience a result it can examine.
Worked example—fictional source notes: A software team tested a revised onboarding flow. Completion was 42% (21 of 50 users) in the earlier cohort and 58% (29 of 50) in the later cohort. The later cohort also received a new reminder email, and there was no control group. In eight follow-up interviews, six users said the revised setup instructions were easier to follow. These notes support a measured change and a qualitative observation, but they do not isolate the flow as the cause.
If results are mixed or negative, present that honestly: explain what improved, what did not, and what the team learned. A customer success story usually emphasizes a useful outcome; an analytical case study can be valuable even when the evidence challenges the original hypothesis.
Gather Evidence and Set AI Guardrails
For a broader view of available tools, compare the latest AI presentation makers before choosing the workflow that best fits your team.
Before prompting an AI tool, turn source material into a small, traceable evidence set. Keep facts, interpretations, and open questions separate so a draft cannot quietly convert an assumption into a result.
Build a compact evidence table
| ID | Claim or observation | Source and period | Check and status |
|---|---|---|---|
| E1 | Completion: 21/50 (42%) earlier; 29/50 (58%) later | Product analytics; two consecutive cohorts | Denominators checked; reminder email also changed |
| E2 | Six of eight interviewees found setup instructions easier | Follow-up interviews; later cohort | Qualitative, small sample; not representative of all users |
| E3 | The revised flow caused completion to rise | No direct source | Not established; do not state as fact |
This fictional example shows why the denominator and context belong with a metric. The change from 42% to 58% is 16 percentage points, or about 38% relative growth; neither calculation proves that the onboarding change caused the difference.
Resolve evidence gaps before drafting
- Record the source, date range, unit, denominator, and definition for each key figure or quote.
- If sources conflict, compare their definitions and collection periods. Keep both figures with an explanation if neither can be reconciled; do not choose the more flattering one.
- For small samples, state the sample size and avoid implying that interview feedback represents every customer.
- If there is no baseline, describe the observed outcome without claiming improvement. Use qualitative evidence as a quote or theme, not as a precise numerical result.
- Check permission to name a customer or reproduce a quote. Removing names may not prevent re-identification when dates, roles, or unusual details remain.
Privacy check: Confidential information is restricted by an agreement or policy; sensitive information may create risk even if it is not formally confidential. Use only tools approved for the material, minimize what you share, and follow your organization’s rules. Anonymization is not a guarantee against identification.
Keep the evidence table with the draft, even if it does not appear on the slides. It gives reviewers a quick route from a claim to its source and makes it easier to answer questions about limitations.
Write a Prompt That Produces a Useful First Draft
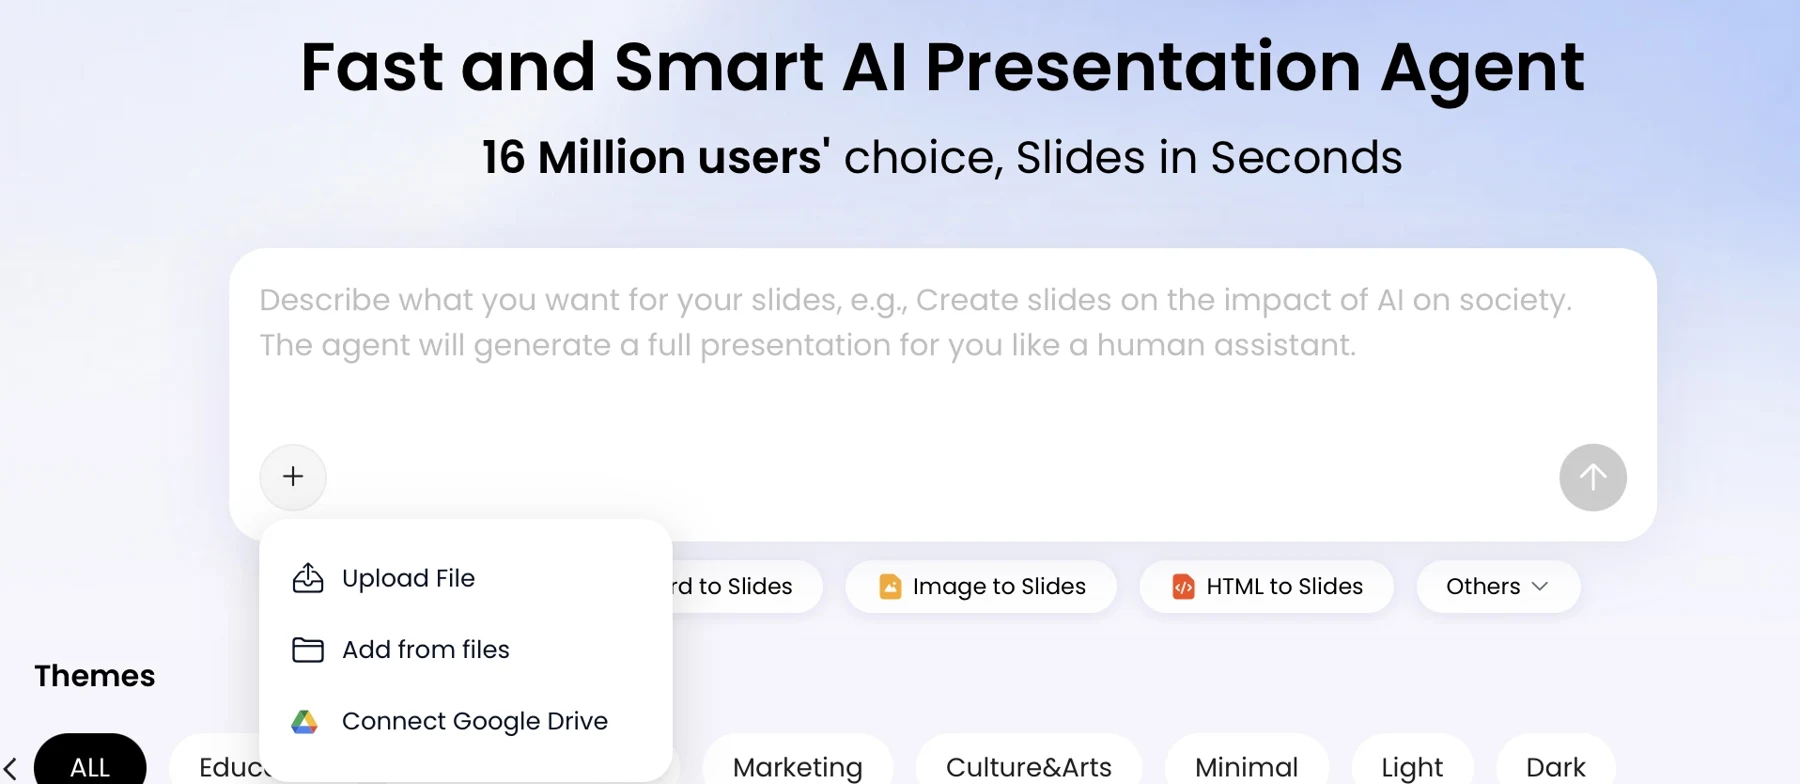
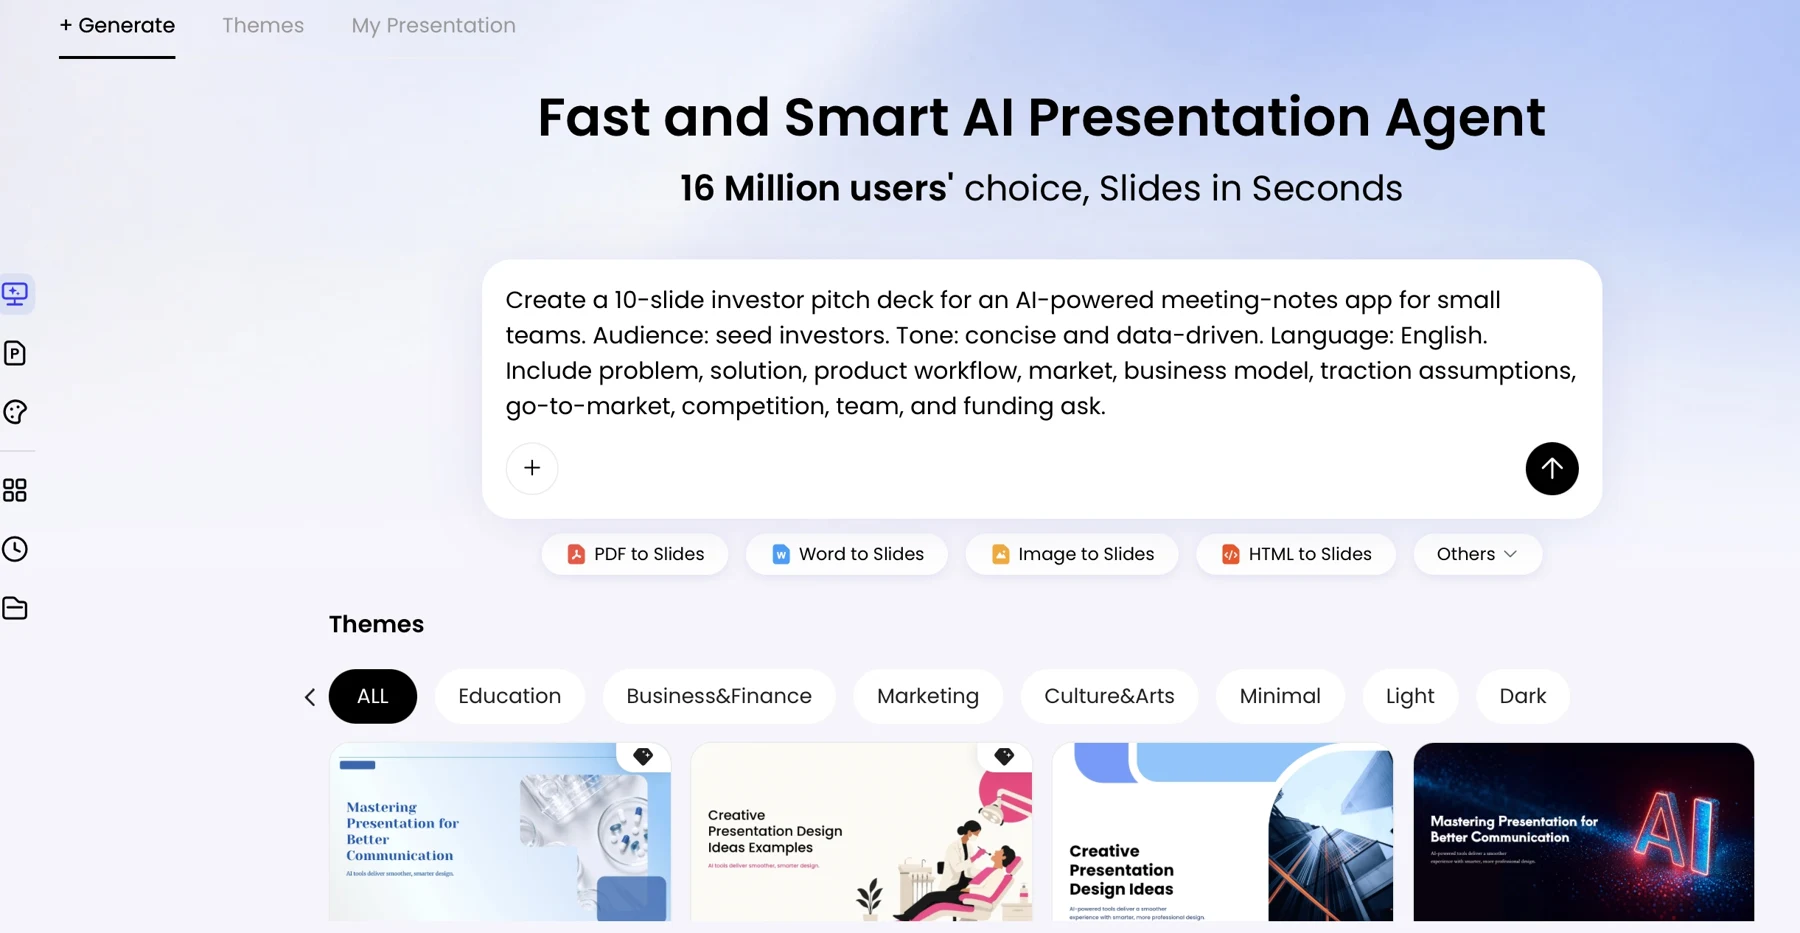
Give the AI structured notes rather than relying on a long document upload alone. Include the audience, purpose, slide limit, source IDs, and instructions for preserving uncertainty. If you use PopAi AI Presentation or another presentation tool, check its current input, privacy, and export options before sharing client material; available features and terms can vary.
Adapt this source-led prompt
“Create an 8-slide case study for operations leaders using only the source notes below. Use source IDs E1 and E2 for supported facts. Separate observed facts from interpretations and recommendations. Do not claim that the revised onboarding flow caused a change: E1 has no control group, and a reminder email also changed. Preserve the denominator and period for every metric. Mark unsupported or missing information [VERIFY]. Do not invent quotes, statistics, or client details. Give each slide one takeaway headline and add a source ID to each factual claim. If the evidence is mixed, show the limitation rather than forcing a success story.”
For an executive audience, ask for the decision and risks near the beginning. For an academic audience, specify the method and limitations. If no measurable outcome exists, ask for a case built around documented observations and clearly labeled qualitative evidence—not a fabricated proxy. If the tool ignores a constraint, correct the outline or slide yourself and rerun only the affected section.
Review the Outline Before Generating Slides
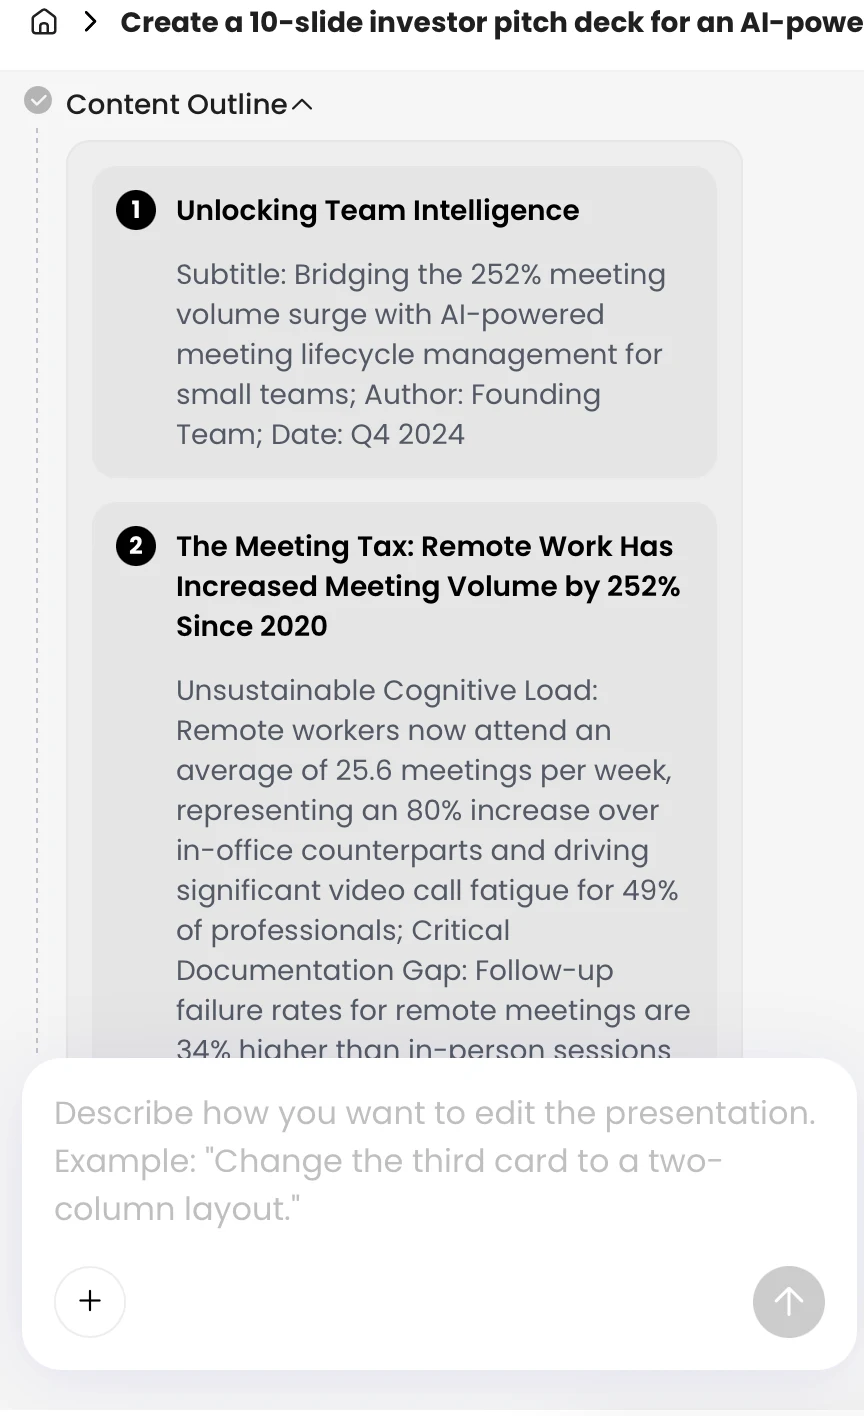
The outline is where you can catch a misleading story before visual design makes it feel convincing. For the fictional onboarding case, an AI might initially produce a headline such as “New onboarding flow lifts completion by 38%.” That overstates causality and uses relative growth without the baseline context.
Correct the sequence, not just the wording
- Weak sequence: client background → onboarding problem → new flow → “38% lift” → recommendation to roll it out.
- Revised sequence: decision question → earlier completion baseline → what changed in the later cohort → observed completion comparison → interview feedback → confounding reminder change and lack of control group → next test to isolate the effect.
The revised outline earns each slide: the baseline makes the comparison interpretable; the intervention slide distinguishes the flow from the reminder; the results slide reports the observed change; and the limitations slide prevents an unsupported causal conclusion. If the deck is too compressed to include those distinctions, remove less relevant background rather than hiding the caveat.
Approval test: Read only the slide headlines in order. They should form a coherent, accurate argument. If a headline needs a footnote to become true, rewrite the headline or make the qualification visible on the slide.
Generate and Edit the Case Study Slides
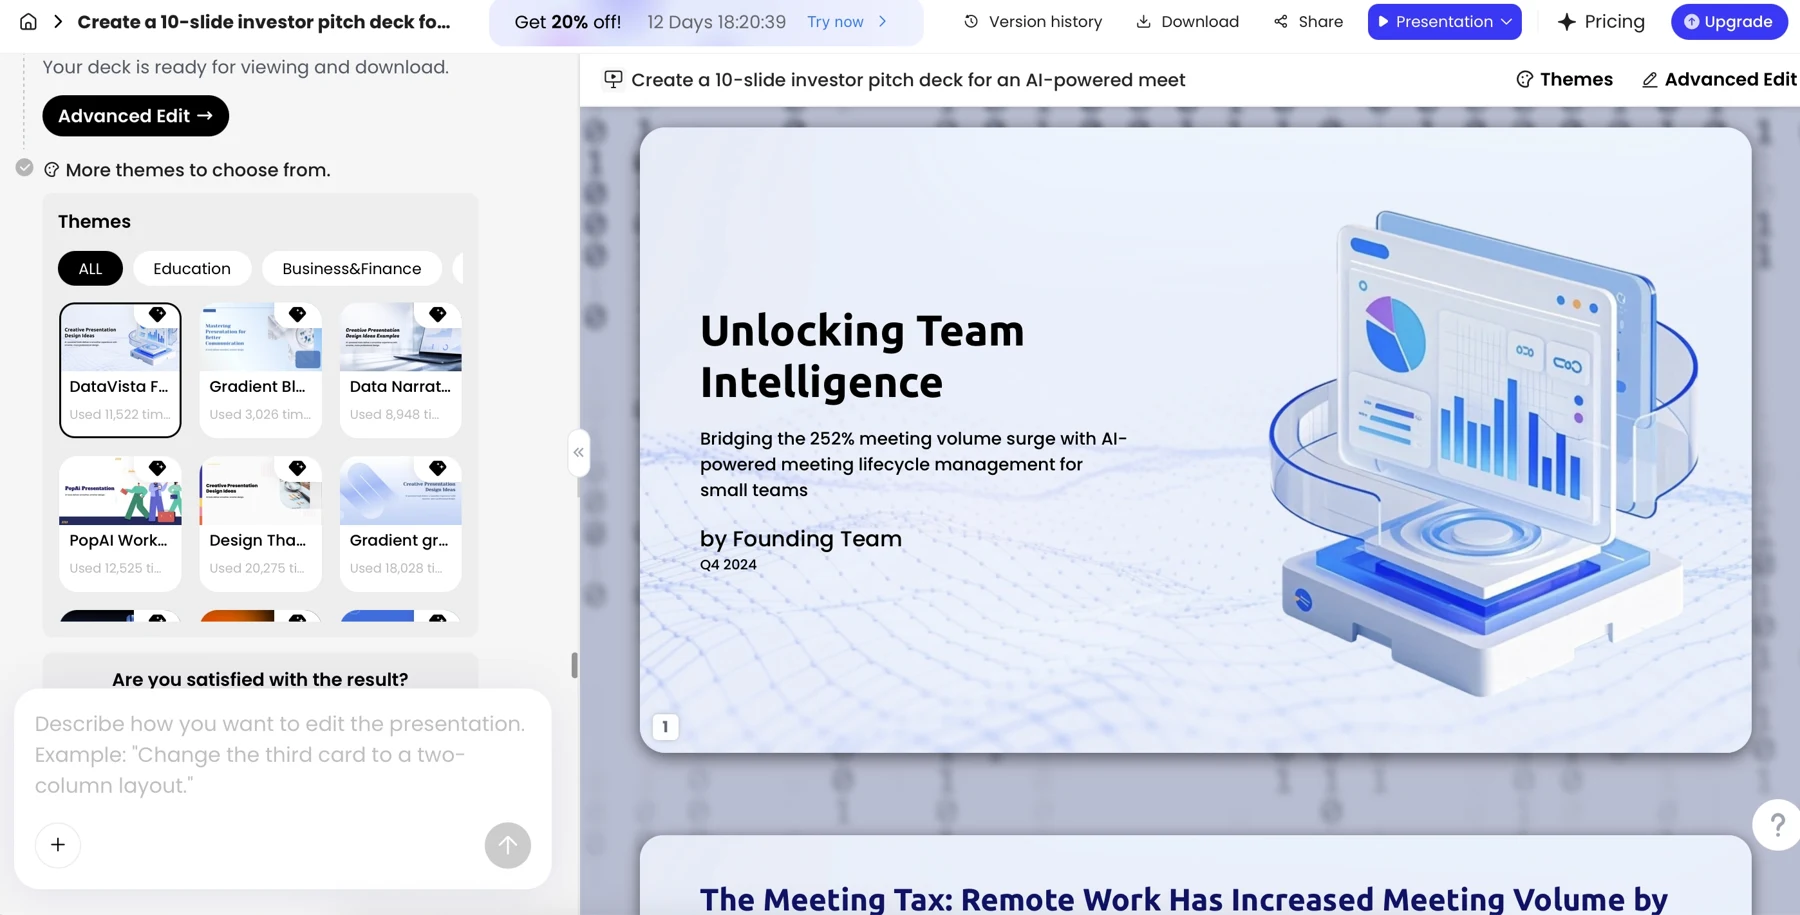
Once the outline is sound, generate slides as a draft and inspect the relationship between headline, visual, labels, and source notes. AI can suggest a layout or shorten copy, but it cannot decide whether the underlying comparison is fair or the evidence is strong enough for the claim.
Turn a dense result into a readable slide
Draft slide: “Onboarding transformation drives 38% improvement,” followed by a paragraph of process detail and a large upward arrow. Corrected slide: headline it “Completion was 16 percentage points higher in the later cohort”; show two labeled bars, 42% (21/50) and 58% (29/50), with cohort periods and source E1; add a visible note that the reminder email also changed and there was no control group. This presents the measured difference without implying a proven cause.
Choose a simple bar chart for a small number of comparable values. Avoid a chart when there is no meaningful baseline or when qualitative evidence is the main finding; use a clearly attributed quote or a short theme summary instead. Use readable contrast, labels that do not rely on color alone, and source notes large enough to read in the presentation setting.
- Use before-and-after visuals only when definitions and periods are comparable.
- Use a customer quote only with approval and accurate attribution; preserve the original meaning when shortening it.
- Use a process diagram for steps or handoffs, not as a substitute for evidence of impact.
- After any AI edit, recheck the numbers, chart scale, labels, source IDs, and whether the revised headline still matches the evidence.
For scale, the fictional cohort comparison represents 50 users in each period, not a controlled experiment. Show the counts alongside the percentages so the audience can judge the sample size. The interview finding—six of eight participants reporting clearer instructions—should remain a separate qualitative observation, not be combined with the completion rate into a single “success score.”
Verify Claims, Design, and Delivery
Use the final review to test whether the deck works for someone who did not help create it. A clear-looking slide can still mislead if its comparison, caveat, or source is hard to find.
Run a practical rehearsal
- Rehearse aloud: Time the presentation, including transitions and planned pauses. If you run over, cut secondary detail rather than speaking faster through the main evidence.
- Test comprehension: Show the results slide to a colleague without explaining it. Ask what changed, for whom, over what period, and what the data does not prove. Revise if their interpretation differs from yours.
- Prepare for questions: Keep the evidence table available and be ready to explain sample size, measurement method, missing baseline, or other changes made at the same time.
- Check the presentation environment: Open the final file on the device and software you will use. Check fonts, chart labels, contrast, and any speaker notes or linked media.
For a handout, include fuller methods and source details; for a live talk, keep the slide readable and place supporting detail in notes or an appendix. Review the final version after export because formatting can vary between tools, then share only the approved deck and retain the evidence and permission records.
Practical rule: If a claim cannot be traced, verified, or responsibly qualified, remove it. A clear limitation is more credible than a polished but unsupported result.