How to Design Timeline and Roadmap Slides with AI: Examples & Prompts
If you are a product manager, project lead, consultant, educator, or executive preparing a milestone update, the hard part is rarely “making a nice-looking line with dots.” It is deciding which milestones deserve space, which dates are firm, which dependencies could derail the plan, and how to stop stakeholders from reading a tentative target as a public commitment.
Use a timeline slide when the main question is sequence: “What happened when?” or “What happens next?” Use a roadmap slide when the main question is strategy: “What are we prioritizing, why, and what trade-offs are implied?” A project plan or Gantt view is different again: it is about delivery ownership, duration, and dependencies.
For example, you may start with 17 Jira epics, four target launch windows, two unresolved legal approvals, and a leadership update tomorrow morning. This guide shows how to use AI to turn that material into usable timeline and roadmap slides: prepare better inputs, choose the right format, write tighter prompts, critique the AI draft, validate facts, and export a deck that can survive stakeholder review.
Timeline vs Roadmap Examples
A timeline explains sequence. A roadmap explains direction, priorities, and trade-offs. Treating them as the same slide makes AI output weaker.
Before generating the slide, decide whether the audience needs dates, phases, dependencies, ownership, or strategic intent. Then ask AI for the right format instead of a generic horizontal line.
| Slide type | Best for | Inputs to provide | Review before sharing |
|---|---|---|---|
| Project timeline | Explaining milestone order and deadlines. | Dates, owners, dependencies, approval gates, risks. | Confirm dates and avoid hiding schedule uncertainty. |
| Product roadmap | Showing priorities across now, next, later. | Themes, customer needs, confidence level, release assumptions. | Label tentative items and avoid promising unapproved releases. |
| Historical timeline | Teaching events or showing company progress. | Event dates, sources, significance, and sequence. | Check factual accuracy and avoid oversimplifying causes. |
AI can organize roadmap language, but product leadership must decide what is committed, tentative, confidential, or not ready to show externally.
What AI Can and Cannot Do for Timeline Slides
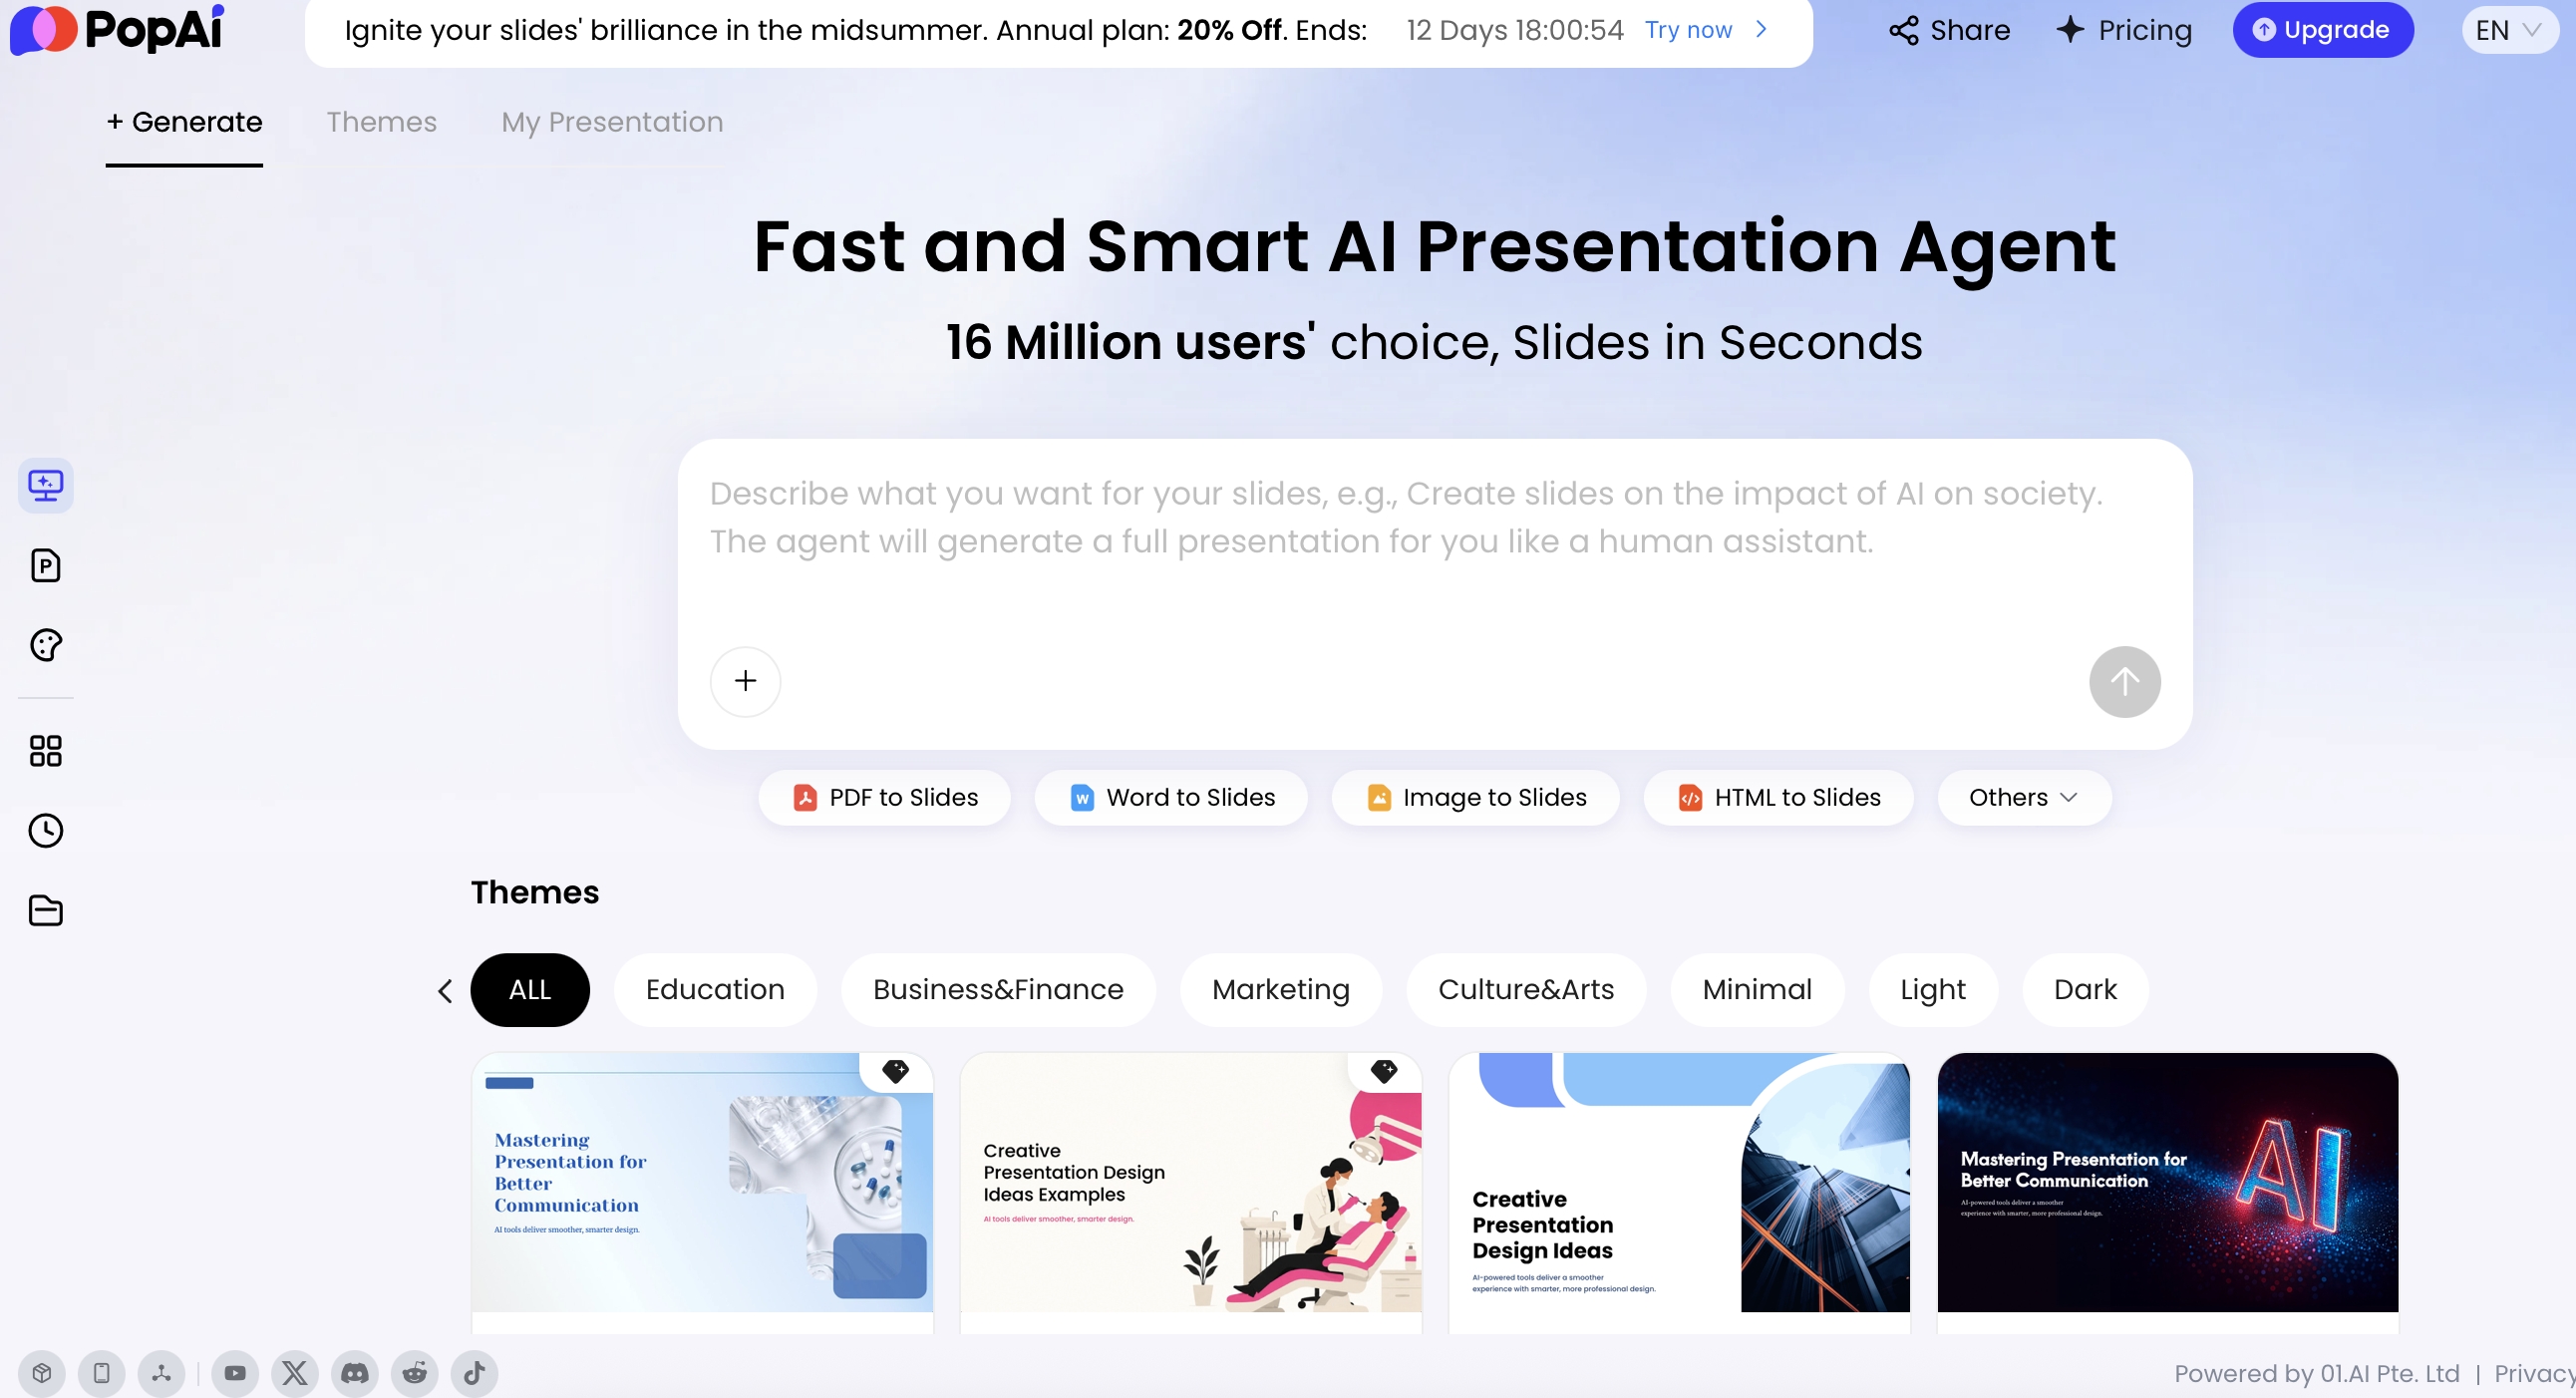
AI is strongest at the messy middle of roadmap work: clustering milestones into phases, reducing meeting notes into labels, suggesting alternate layouts, and turning raw content into an editable first draft. In tools such as PopAi AI Presentation, you can start from a prompt or upload source material, review an outline, generate slides, and revise the deck before exporting it.
That matters because timeline content usually lives in scattered places: discovery notes, meeting transcripts, Jira summaries, old strategy decks, launch checklists, customer research, and leadership memos. A practical AI-assisted workflow looks like this:
- Extract: pull candidate milestones, dates, owners, and risks from source material.
- Group: organize milestones into phases, quarters, workstreams, or decision gates.
- Reduce: shorten labels and remove items that do not affect the audience’s decision.
- Draft: generate one or more slide structures, such as a linear timeline, swimlane roadmap, or Gantt-style view.
- Validate: check dates, owners, dependencies, commitments, and confidential details before presenting.
AI is most useful before design polish: it forces your roadmap into phases, priorities, dependencies, and decisions before you spend time aligning boxes and arrows.
AI is not a substitute for product judgment or governance. It can invent a milestone because it “fits” the pattern, upgrade a tentative dependency into a firm commitment, or smooth over risk language until the slide looks more certain than the plan really is. Treat every AI-generated date, owner, metric, budget, dependency, and risk statement as unverified until the relevant stakeholder confirms it.
Case-study example: In a 90-day onboarding roadmap, an AI draft may place “Customer beta begins” in Week 4 because that is a common product-launch rhythm. If legal review, data migration, and security approval are still open, that date is misleading. The corrected slide should label the beta window as “target,” add a dependency marker for security approval, and move the firm commitment to “Beta readiness review.”
Choose the Right Timeline or Roadmap Format
For a broader view of available tools, compare the latest AI presentation makers before choosing the workflow that best fits your team.
Before writing a prompt, choose the visual container. Most weak roadmap slides fail because the container is wrong: a linear timeline for a multi-team delivery plan, a dense Gantt chart for a board audience, or a decorative journey path when the real issue is ownership and risk.
Do not use a timeline if the dates are less important than the decision criteria. For prioritization debates, a 2x2 matrix, decision tree, or opportunity scoring table may work better. For resource planning, use a capacity view. For customer-facing updates, use a simplified roadmap that avoids internal dates, team names, and unresolved dependencies.
| Format | Best for | Use when your audience asks | Recommended slide structure | Design warning |
|---|---|---|---|---|
| Linear timeline | Historical events, launches, campaign milestones, course schedules | “What happened when?” or “What comes next?” | Horizontal line with 5–7 milestone cards and short date labels. | Keep labels short; avoid pretending unequal time gaps are equal unless you label them as phases. |
| Product roadmap | Product strategy, feature themes, quarterly planning | “What are we prioritizing and why?” | Quarterly columns with themes, outcomes, and commitment labels. | Separate committed, planned, and exploratory items visually. |
| Gantt-style view | Project delivery, dependencies, team capacity, implementation plans | “Who does what, and where are the overlaps?” | Time columns with task bars, owner labels, and dependency markers. | Use for working sessions, not high-level vision slides. |
| Curved path or progress flow | Transformation journeys, pilots, onboarding, maturity models | “How do we move from current state to future state?” | Sequential phase cards along a path, with one outcome per phase. | Do not let decorative curves hide timing, ownership, or the next decision. |
| Swimlane roadmap | Cross-functional work across product, engineering, marketing, sales, operations | “How do the workstreams connect?” | 3–5 horizontal lanes by team or workstream, aligned to shared dates. | Limit lanes; otherwise the slide becomes a spreadsheet. |
A timeline emphasizes sequence. A roadmap emphasizes intent. A Gantt view emphasizes execution. If the audience is asking a different question, change the format before changing the colors.
Design analysis: A simple timeline usually carries two information dimensions: time and event. A product roadmap often carries time, priority, commitment level, and strategic theme. A Gantt view adds duration, owner, and dependency. Each added dimension increases visual load, so split slides by audience: executives get quarterly themes, decision points, and risks; delivery teams get owners, task bars, and dependency markers.
If you are still choosing a tool, compare whether it supports outline review, editable slide objects, PPTX/PDF export, and source-file upload—not just a single generated graphic. This broader landscape is covered in this guide to AI presentation makers.
Prepare the Inputs Before You Ask AI to Design
AI-generated timeline slides improve dramatically when you give the model decisions and constraints, not just a topic. “Make a roadmap for our app” usually produces a polished generic slide. “Create a Q2–Q4 retention roadmap for a VP Product audience, with committed vs. exploratory work clearly separated” gives the AI something useful to design around.
Collect the planning facts first
- Audience: executives, delivery team, customers, investors, students, or cross-functional partners.
- Time horizon: 30 days, 60 days, Q1–Q4, 18 months, academic semester, or historical period.
- Goal: alignment, approval, funding, status update, launch readiness, training, or decision-making.
- Milestones: phases, releases, gates, reviews, pilots, tests, launches, and retrospectives.
- Dependencies: teams, data, vendors, approvals, compliance, budget, hiring, or customer access.
- Commitment level: committed, planned, exploratory, tentative, blocked, or decision required.
- Risk labels: technical risk, market risk, resource risk, adoption risk, legal risk, or timeline risk.
- Brand and design constraints: brand colors, required fonts, logo rules, icon style, dark/light background, and accessibility requirements.
Convert weak inputs into strong inputs
Weak input: “Make a roadmap for our app.”
Strong input: “Create a 6-slide Q2–Q4 product roadmap for a VP Product and Engineering audience. Focus on retention, onboarding, and enterprise readiness. Show committed work separately from exploratory bets. Use 5–7 milestones maximum on the main roadmap slide. Mark uncertain dates as tentative. Include dependencies for data migration, security review, and customer beta access.”
Before uploading source material, remove duplicates, resolve obvious date conflicts, and mark open questions. If your notes say “launch in May” in one place and “launch after security review” in another, do not expect AI to infer the politically safe answer. Add a line such as: “May is a target window, not a committed date; security review is the gating dependency.”
When working with sensitive roadmaps, sanitize the input. Replace customer names with segments, remove unreleased revenue projections, redact personnel changes, generalize pricing strategy, and avoid pasting legal/compliance status unless your policy allows it. For external/customer versions, remove internal team names, unapproved launch dates, and roadmap items that sales cannot safely discuss.
Step-by-Step Workflow to Design Roadmap Slides with AI
A reliable workflow keeps AI from becoming a random slide generator. Use the sequence below for product roadmaps, implementation timelines, AI deployment plans, GTM launches, and historical timelines.
1. Start with source material or a structured prompt
If you already have materials, upload them instead of rewriting everything. Useful inputs include strategy docs, product briefs, meeting notes, launch plans, spreadsheets summarized into milestones, existing PPTX decks, PDFs, images of whiteboards, and transcripts. Keep the upload focused: one clean product brief is often better than ten conflicting documents.
2. Ask for an outline before slides
Do not skip the planning step. Ask AI to produce a milestone outline, phase grouping, and recommended slide format before it generates visuals. This is where you catch missing phases, duplicated milestones, invented owners, or a mismatch between executive and team-level detail.
Example AI outline to approve before generation:
- Slide 1: Executive summary — retention roadmap objective and decision requested.
- Slide 2: Q2–Q4 roadmap — three themes: onboarding, activation, enterprise readiness.
- Slide 3: Dependency map — security review, data migration, customer beta access.
- Slide 4: Risks and mitigations — resource constraint, compliance approval, adoption risk.
- Slide 5: Metrics — activation rate, time-to-value, enterprise trial conversion.
- Slide 6: Decisions needed — beta scope, launch window, staffing approval.
3. Generate, critique, and revise the first draft
After generation, edit like a strategist rather than a decorator. Useful revision prompts include: “shorten this for executives and keep only three decision points,” “mark Q3 items as planned rather than committed,” “move risks into amber callouts,” or “create a customer-safe version without internal team names.”
Mini before/after workflow: Raw notes said, “Launch onboarding revamp, improve activation, enterprise SSO maybe, beta customers, analytics cleanup, security review, sales enablement, Q3?” The first AI draft put all items on one cheerful Q3 timeline. The improved version grouped them into three themes, moved “enterprise SSO” to exploratory, labeled “security review” as a decision gate, and created a separate GTM swimlane for sales enablement. The lesson: the first draft often finds the parts; your revision defines the commitments.
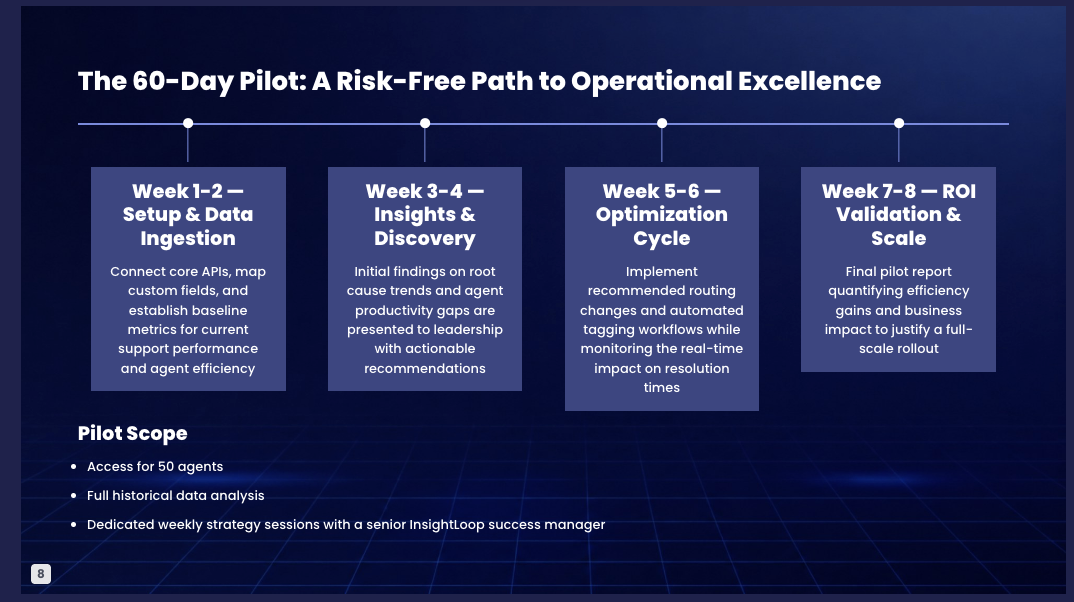
This example uses a phase path rather than a dense task plan. Notice that the slide is built around five major stages—setup, discovery, optimization, ROI validation, and scale—so the viewer can follow the engagement rhythm without reading a spreadsheet. For an executive audience, you would make the decision gates and ROI validation more prominent. For an implementation team, you would add owners, week numbers, and dependencies in a second slide rather than overloading this one.
4. Export only after the review pass
Export PPTX when stakeholders need editable objects in Microsoft PowerPoint. Export PDF when you need a stable version for distribution. Before sending either version, open the file outside the AI tool and check fonts, alignment, chart labels, speaker notes, hidden comments, and whether confidential metadata or internal assumptions are still visible.
Design Rules for Clear AI-Generated Timeline Slides
Good timeline design turns time into decisions. Whether the AI creates a linear timeline or a quarterly roadmap, your job is to reduce ambiguity and guide the eye.
Use one primary reading path
Put the time scale first, phase labels second, and supporting details third. A slide that gives the same weight to every task looks balanced but feels confusing. Use larger type for quarters or months, medium type for phases, and smaller type for evidence, examples, or owner labels.
Respect the time scale
If January to March takes the same visual space as April to December, viewers may assume the intervals are comparable. Use equal spacing for equal time periods. If you are showing phases rather than true time intervals, label them as phases and avoid implying calendar precision.
Limit milestones and split detail
For a single projected slide, aim for 5–7 major milestones. Keep milestone labels under roughly 6–10 words where possible. If you need more detail, split the story into two slides: an executive roadmap followed by an implementation view or appendix. Do not solve overcrowding by shrinking text.
Show uncertainty instead of hiding it
Roadmaps often contain ambiguity. Use labels such as “target,” “tentative,” “decision required,” or “dependent on approval.” Lower opacity, dashed outlines, or separate lanes can show exploratory work without making it look abandoned. Avoid exact dates when only a quarter or date range has been approved.
Color-code meaning, not decoration
Color semantics vary by brand and culture, so define the meaning directly on the slide. Use color as one signal, not the only signal.
- Committed / approved: use the strongest brand color or a solid filled style.
- Planned: use a secondary color or lighter fill.
- Exploratory: use outline, dashed border, or lower opacity.
- At risk / dependency: use amber or another warning treatment plus a clear text label.
- Completed / validated: use a checkmark, completion label, or muted green if it fits your brand system.
If every milestone is bright, none of them are urgent. Reserve contrast for decisions, risks, and the next action.
Design principle: Timeline comprehension drops when viewers must repeatedly move between a legend, date scale, icon set, and milestone text. Use direct labels on objects whenever possible. Legends are acceptable for a few categories, but unlabeled icons and color-only codes create unnecessary work for the audience.
Use arrows and connectors only when they mean something
Arrows should show sequence, dependency, or handoff. If everything simply happens left to right, the timeline itself already communicates sequence. Too many arrows make a roadmap look more precise than it is and can imply dependencies that have not been agreed.
Make it accessible
For projected 16:9 slides, use large text—often 24–28px equivalent or larger for body labels—and test the slide at actual presentation size. Avoid diagonal text, low-contrast gray labels, and red/green-only status systems. Pair color with shape, icon, pattern, or direct label: “Committed,” “Exploratory,” “At risk,” and “Decision required.” For PDF handouts, you can include more detail, but the visual hierarchy should still work when printed in grayscale.
Prompt Examples for Product, Project, AI, and GTM Roadmaps
Different roadmap types need different instructions. Use the prompts below as starting points, then review the output for the failure modes listed under each example.
Product roadmap prompt
Review carefully for: whether strategic themes are visible, exploratory work is not presented as guaranteed, and customer outcomes are stronger than feature lists.
Project implementation prompt
Review carefully for: realistic timing, correct owners, visible dependencies, and whether the executive version removes unnecessary task-level detail.
AI model deployment roadmap prompt
Review carefully for: compliance gates, data readiness, model monitoring, security review, and whether “AI” claims are backed by measurable deployment criteria.
Go-to-market launch prompt
Review carefully for: cross-functional dependencies, sales enablement timing, customer communication risks, and whether the external version removes confidential launch details.
Edit, Validate, and Export Your AI Roadmap Deck
The biggest risk with AI-generated roadmap slides is false confidence. The slide may look polished before it is accurate. Build review into the workflow and assign a human owner for each category of validation.
Validate strategy, facts, and assumptions
- Are all dates confirmed, tentative, or clearly marked as assumptions?
- Are owners, teams, and decision-makers accurate?
- Are dependencies visible rather than buried in speaker notes?
- Are risks paired with mitigation actions and named owners?
- Are success metrics measurable, not vague?
- Is exploratory work visually different from committed work?
- Is the level of detail appropriate for the audience?
- Does the final slide ask for a decision, approval, or next action?
Use a staged review pass: product or program leads validate priorities, engineering validates timing and dependencies, finance validates budget or revenue references, legal/compliance validates risk language, and marketing or sales validates customer-facing claims. This is especially important when turning an internal roadmap into an external deck.
Adapt the same roadmap for different audiences
One roadmap rarely works for everyone. An executive version should emphasize decisions, trade-offs, risks, and outcomes. A delivery-team version should include owners, dependencies, and weekly or sprint-level detail. A customer-facing version should remove internal team names, staffing constraints, unresolved approvals, and unapproved dates.
Targeted natural-language edits are useful here. For example: “turn this into a customer-facing version without internal team names,” “make the investor version emphasize market expansion,” or “shorten the executive version to three priorities and two risks.” In a practical editing test on an overloaded roadmap slide, asking for an executive version reduced nine milestone cards to three priorities, moved two technical risks into a callout, and preserved the decision request. The remaining limitation: the tool could shorten language, but a human still had to confirm which risks were politically safe to show.
Use metrics and charts carefully
If your roadmap includes metrics, pair them with the milestone they prove. A chart should answer a roadmap question, not decorate the appendix. Good examples include activation rate after onboarding improvements, defect reduction after QA automation, launch-readiness score by workstream, or adoption by customer segment. Avoid adding charts that introduce a second story the presenter cannot explain.
Export and QA the final deck
After editing, export PPTX for editable collaboration and PDF for locked distribution. Then inspect the file outside the AI tool: check whether fonts substituted correctly, shapes remain editable, charts render cleanly, speaker notes do not expose confidential assumptions, and slide alignment survived export. Keep an editable internal master and a separate locked external version.
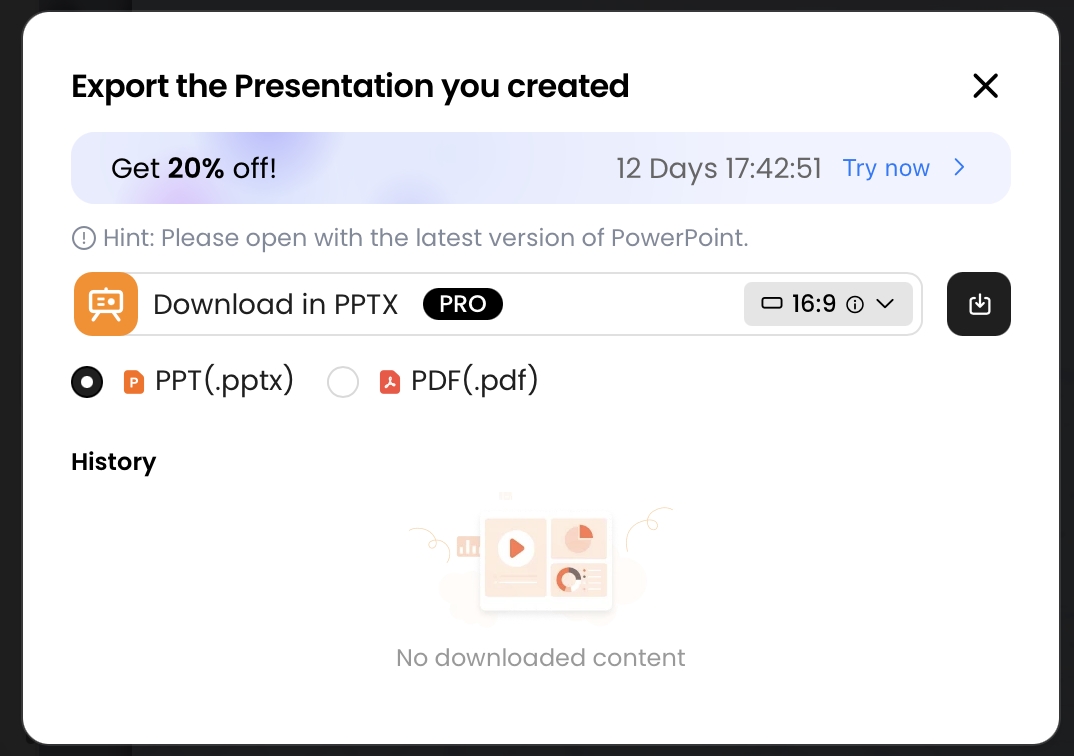
The export step is not only technical. It is also a governance checkpoint. Before sending the deck, confirm whether it is an internal working plan, an executive decision deck, a board update, or a customer-safe roadmap. Each version may need different dates, labels, assumptions, and notes.
Common Mistakes When You Design Timeline Slides with AI
Most AI roadmap problems come from unclear strategy, not weak graphic design. Avoid these mistakes before you present.
- Turning a roadmap into a wish list: Fix it by grouping items into 3–4 strategic themes and cutting anything that does not support the decision.
- Presenting exploration as commitment: Use labels, opacity, dashed borders, or separate lanes for “committed,” “planned,” and “exploratory.”
- Accepting hallucinated dates or owners: Ask AI to flag missing data instead of filling gaps. Then verify dates with the accountable team.
- Copying competitor roadmaps: A useful roadmap reflects your customer evidence, constraints, sequencing logic, and trade-offs.
- Overloading one slide: Use progressive disclosure: summary first, implementation detail second, appendix last.
- Using equal spacing for unequal time periods: Either scale the timeline accurately or label the sections as phases rather than calendar intervals.
- Making color carry all meaning: Add direct labels, icons, or patterns so the slide still works for color-blind viewers and grayscale printing.
- Ignoring risks: Add risk callouts with mitigation owners instead of hiding risk in speaker notes.
- Showing internal details externally: Remove confidential customer names, unreleased pricing, staffing assumptions, and unapproved launch dates.
A strong final roadmap answers four questions quickly: What are we trying to achieve? What happens when? What could block us? What decision or action is needed now?
If the slide answers those questions without overstating certainty, AI has done its job as a drafting partner—and you have done yours as the strategist and editor.
FAQ: Timeline and Roadmap Slides with AI
What is the difference between a timeline slide and a roadmap slide?
A timeline slide explains when events happen, usually in chronological order. A roadmap slide connects timing with priorities, outcomes, dependencies, and decisions, so it is better for product, project, and strategy presentations.
What prompt should I use to create roadmap slides with AI?
Use a prompt that includes audience, time horizon, goal, milestones, owners, risks, constraints, tone, and output format. Ask the AI to separate committed work from exploratory items and to create an editable slide outline before generating visuals.
Can AI-generated roadmap decks replace product strategy work?
No. AI can accelerate structure, slide design, summarization, and alternative layouts, but humans must validate dates, priorities, customer evidence, resource assumptions, budget, compliance requirements, and final commitments.
How do I export an AI-generated roadmap to PowerPoint?
After reviewing and editing the roadmap deck, export it as PPTX if you need to continue editing in Microsoft PowerPoint, or export as PDF when you want a stable version for distribution.
Create your presentation with one click now
Turn project notes, milestones, and strategy documents into an editable timeline or roadmap presentation faster.
Create with PopAi