How to Design Financial Slides with AI: Charts, Forecasts & Examples

Imagine a Q2 board update built from five messy inputs: an Excel P&L, a forecast model, a revenue-by-segment CSV, CFO notes, and last quarter’s board deck. The numbers may be correct, but the board still needs one clear answer: are we on plan, what changed, and what decision is required?
That is the real job when you design financial slides with AI. AI can turn source material into a draft outline, chart recommendations, and a first version of the deck. Finance still owns the operating logic: actuals versus forecast, metric definitions, variance interpretation, confidentiality, and the final recommendation.
In this workflow, you are not asking AI to “make finance look nice.” You are using it to convert messy reporting material into a board-ready communication system: insight-led titles, appropriate charts, traceable source notes, consistent financial formatting, and a reviewer checklist before anything is shared.
Practical starting point: AI works best when you provide a controlled input package: source files, reporting period, audience, metric definitions, comparison basis, and explicit instructions not to invent missing figures.
Financial Slide Examples and Source Control
AI can help organize financial information, but the numbers must come from a verified source of truth.
A financial slide is not just a chart. It is a claim about performance, risk, or future expectations. Use AI to choose structure, simplify labels, draft speaker notes, and suggest chart types. Do not use AI to invent missing revenue, margin, burn, runway, valuation, or forecast assumptions.
| Financial slide | Input to provide | Useful AI output | Required human check |
|---|---|---|---|
| Revenue trend | Period, revenue, segment, currency, and source file. | Line or column chart with a clear takeaway title. | Confirm time period, currency, definitions, and outliers. |
| Expense breakdown | Category totals and accounting period. | Waterfall, stacked bar, or simple category table. | Verify categories and avoid implying causality without evidence. |
| Forecast slide | Actuals, assumptions, scenarios, and owner notes. | Scenario table with base, upside, and downside cases. | Separate actuals from forecasts and label assumptions clearly. |
| Funding ask | Amount, use of funds, milestones, runway assumptions. | Use-of-funds chart and milestone summary. | Review with finance, leadership, or advisors before external use. |
AI can format and explain financial information. It should not decide whether projections are defensible, whether a metric is compliant, or whether a funding ask is appropriate.
Why Financial Slides with AI Still Need a Story
Finance slides fail when they show data without interpretation. A revenue table, cost chart, or forecast model is not yet a presentation slide; it becomes one only when it answers a business question. Are we growing efficiently? Why did gross margin fall? How much runway remains? Which investment should leadership approve?
When you design financial slides with AI, ask the tool to structure information around a conclusion first. A weak prompt is: “Create a slide about Q2 revenue.” A stronger prompt is: “Create one executive slide showing that Q2 revenue grew 18% year over year, driven by enterprise expansion, but new-logo growth slowed in EMEA. Include the implication for the Q3 sales plan. Use only the attached revenue file and cite the source tab.”
Financial slides should not make the audience hunt for meaning. The title should state the insight; the chart should prove it; the footnote should define the source.
Turn weak finance titles into decision titles
- Weak: “Q2 Revenue”
Better: “Q2 revenue grew 18% YoY, but EMEA new-logo growth slowed to 4%.” - Weak: “Expense Breakdown”
Better: “Sales hiring drove 62% of the OPEX variance and is expected to normalize in Q3.” - Weak: “Cash Runway”
Better: “Base-case runway remains above 15 months; downside case falls below policy threshold in February.” - Weak: “Gross Margin”
Better: “Gross margin fell 320 bps as enterprise discounting offset infrastructure savings.”
Use the finance narrative arc
- Performance: What changed versus plan, last quarter, or last year? Example: “Gross margin declined from 71% to 66% versus a 69% plan.”
- Drivers: Which segment, product, geography, or cost category explains the change? Example: “Enterprise renewal discounts increased in EMEA and strategic accounts.”
- Implication: What risk, opportunity, or decision follows from the numbers? Example: “Revenue upside is less profitable than expected if discounting continues.”
- Action: What should the board, investor, CFO, or operating team approve next? Example: “Approve Q3 discount guardrails and require CFO review above 20% discount.”
Field note: In finance deck reviews, the slowest work is often not building the chart; it is reconciling which number is final, which version of the forecast is current, and whether a variance is timing, permanent, or classification-related. AI can help draft alternative slide structures quickly, but it cannot know that “Forecast_v3_final_FINAL.xlsx” was superseded by the CFO’s email unless you tell it which source wins.
Mini-case: For a Q2 board finance update, an analyst might spend 6–10 hours turning exported P&L tabs and KPI tables into slides, then another 2–4 hours on formatting and last-minute wording. In an AI-assisted workflow, the first outline and draft charts can often be produced in under an hour, but the review time does not disappear; it shifts toward source matching, variance logic, and executive wording.
A 10-Slide Blueprint to Design Financial Slides with AI
A strong finance deck has a predictable rhythm: summary first, evidence next, decision last. Use this blueprint as a starting point, then adjust slide count by audience.
| Slide | Purpose | Best Visual |
|---|---|---|
| 1. Executive summary | State the headline performance, key concern, and decision needed. | Three insight cards |
| 2. KPI dashboard | Show revenue, margin, cash, burn, pipeline, or operating KPIs. | KPI cards plus mini trends |
| 3. Revenue trend | Explain growth, seasonality, churn, expansion, or volume/price mix. | Line or column chart |
| 4. Revenue mix | Break down performance by product, region, customer type, or channel. | Stacked bars or small multiples |
| 5. Expense breakdown | Show where spend increased and whether it is planned or abnormal. | Horizontal bar chart |
| 6. Margin bridge | Connect revenue, COGS, discounting, headcount, and operating leverage. | Waterfall or bridge chart |
| 7. Budget vs actual | Highlight material variances and root causes. | Variance table with color cues |
| 8. Cash flow or runway | Show liquidity, burn, working capital movement, or financing need. | Line chart plus runway card |
| 9. Forecast and scenarios | Compare base, upside, and downside outcomes. | Scenario table or fan chart |
| 10. Recommendation or ask | Convert analysis into decision, funding ask, cost action, or next step. | Decision matrix |
Adapt the blueprint by finance use case
- Monthly close deck: Keep the executive summary, KPI dashboard, budget vs actual, expense breakdown, and forecast change slides. Put detailed account-level tables in the appendix.
- Board update: Add decision slides, risk commentary, cash runway, covenant or policy thresholds, and management actions. Board members rarely need every department table in the main deck.
- Investor update: Emphasize momentum, runway, use of funds, milestones, customer concentration, and risks. Wording should be confident but conservative because the deck may be forwarded.
- Budget variance review: Prioritize owner, driver, timing versus structural impact, and forecast implication. Sort by materiality, not by chart aesthetics.
- Cash runway scenario deck: Lead with liquidity and decision timing, then show base/upside/downside assumptions, trigger points, and actions required to preserve runway.
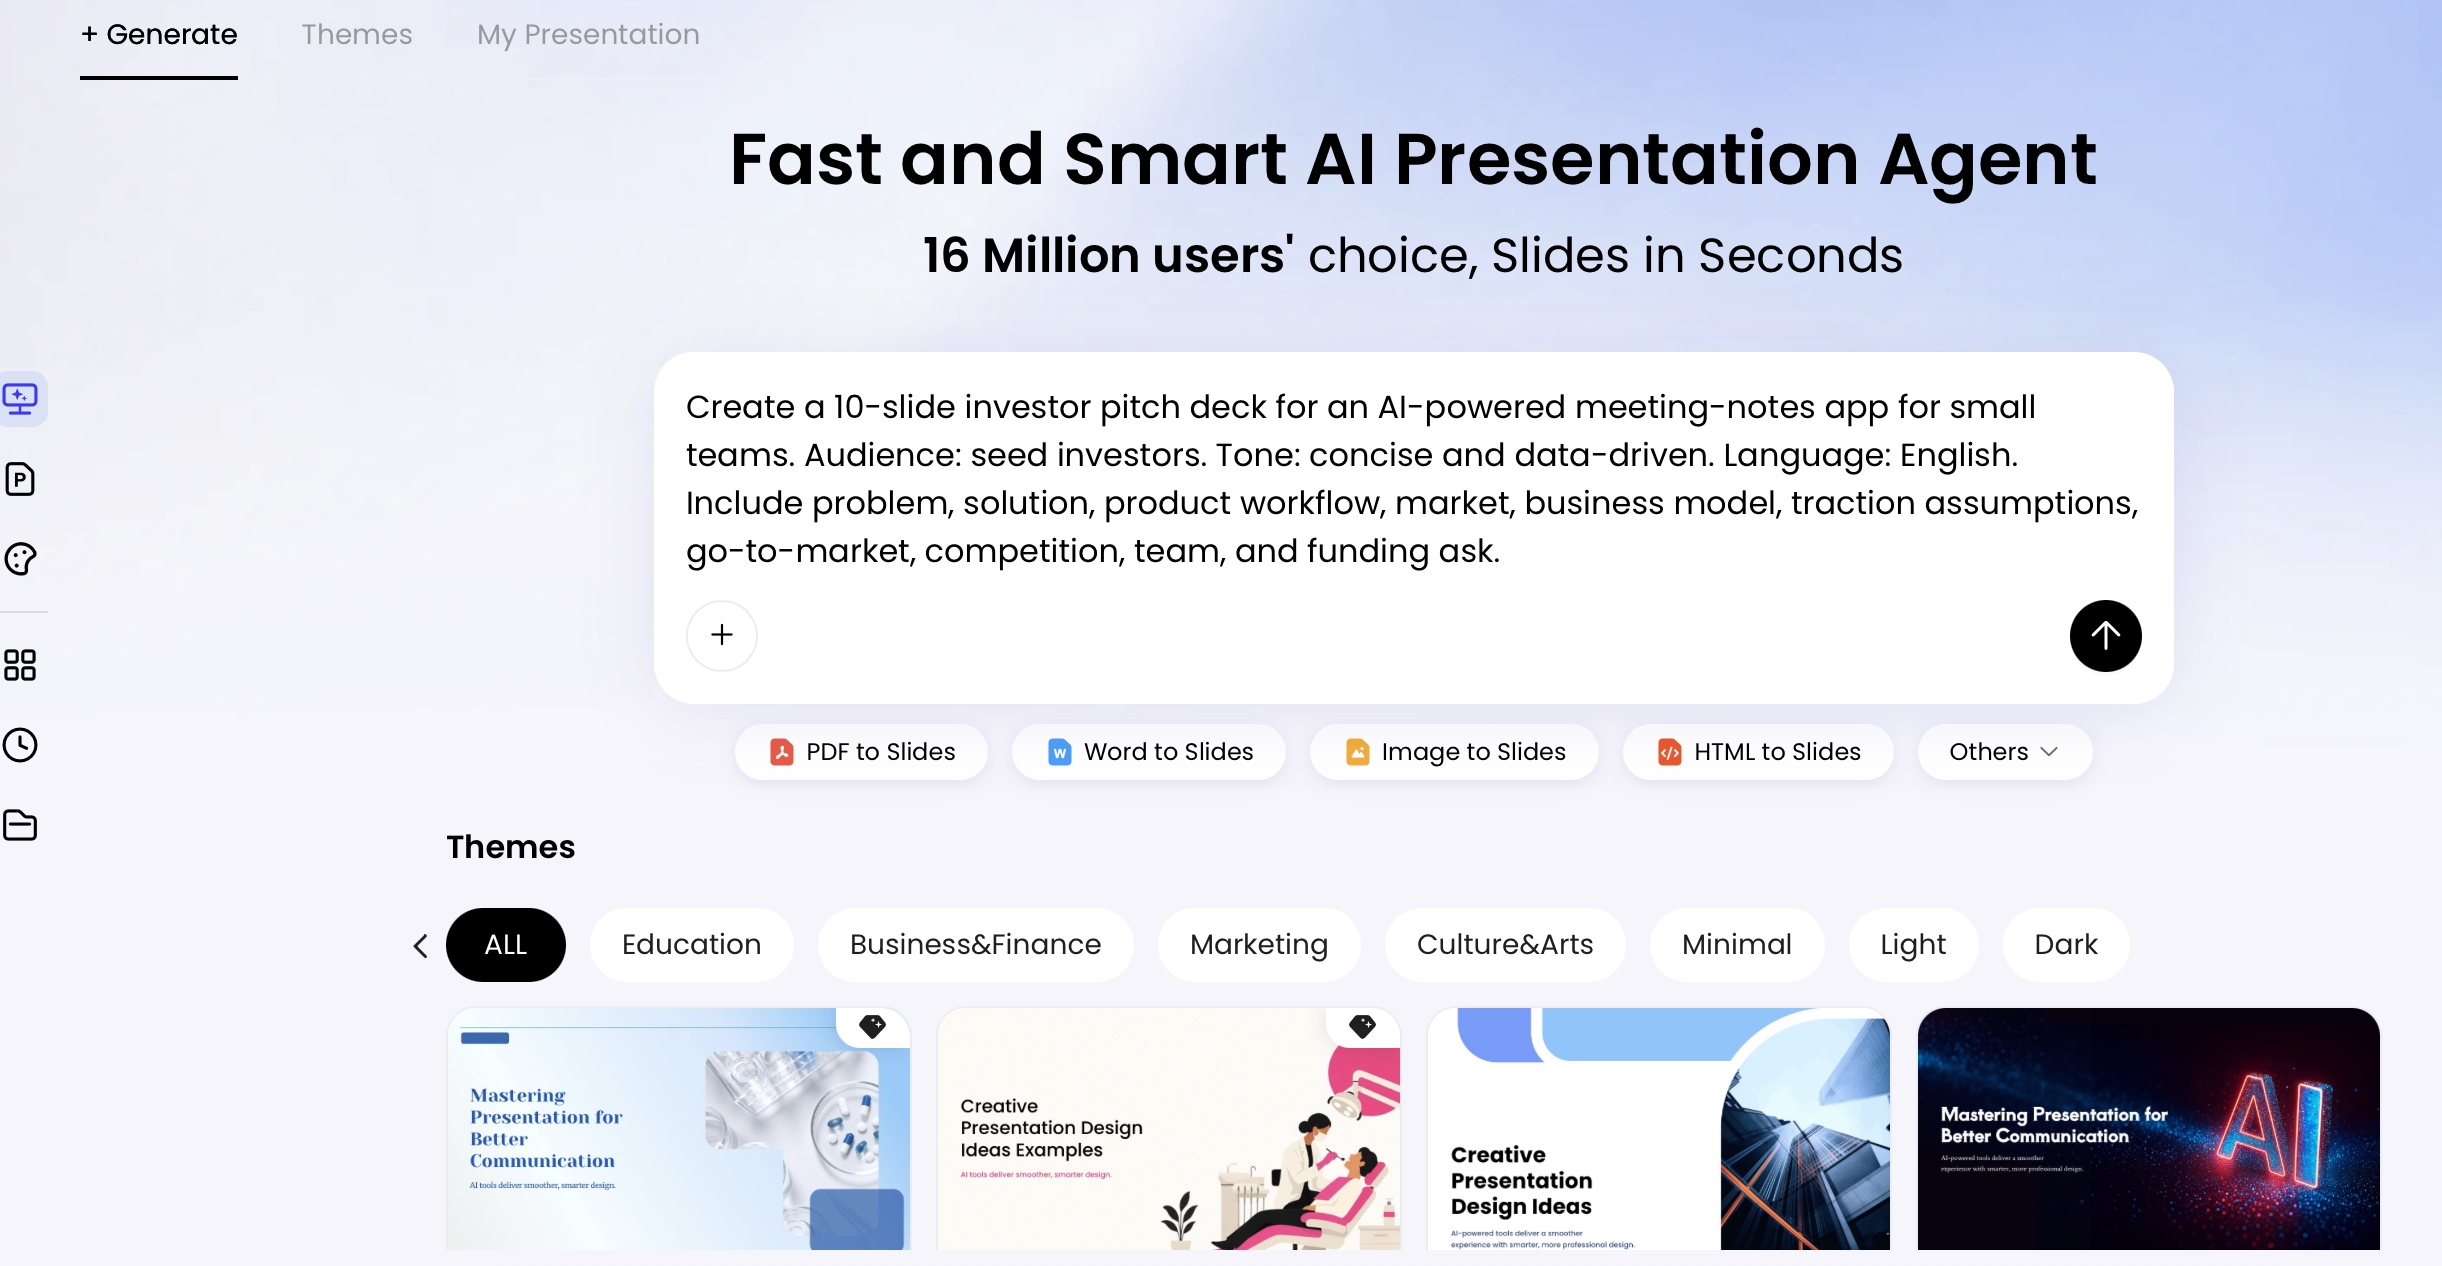
Give AI this blueprint and ask for a slide-by-slide outline before creating visuals. If you use PopAi AI Presentation, review the generated content plan before producing the full deck: reject slides without a clear metric, source, owner, or decision. A useful AI outline should name the slide message, recommended chart, required data source, and verification question for each slide.
From Source Files to Finance Deck: A Practical AI Workflow
The safest workflow prevents three common failures: using stale numbers, mixing actuals with forecasts, and creating polished slides that no one can reconcile.
1. Prepare the input package
Create a small, named source bundle instead of uploading every file you have. For a Q2 board update, a clean input package might include:
Q2_P&L_actuals_closed.xlsxForecast_v3_board_base_upside_downside.xlsxRevenue_by_segment_Q2.csvKPI_definitions_ARR_NRR_EBITDA.pdfCFO_board_notes_Q2.docxPrior_board_deck_Q1_reference.pptx
2. Write a finance brief before generating slides
The brief should specify audience, reporting period, source priority, currency, units, comparison basis, materiality threshold, and restricted topics. Example: “Use Q2 actuals as final, Forecast_v3 as the only forecast source, USD in $M, compare against budget and prior year, call out variances above $250K or 5%, and label customer-level data as confidential.”
3. Generate and review the outline first
Ask for the slide order, key message per slide, chart recommendation, and required source file or tab. Reject any outline that invents metrics, skips cash, uses vague titles like “Financial Performance,” or combines unaudited preliminary numbers with final actuals without labeling them.
4. Create the deck and edit for finance logic
Generate the full presentation only after the outline is directionally right. PopAi supports prompt-based and file-to-slides workflows using common finance materials such as PDFs, Word notes, existing PPTX files, spreadsheets exported to Excel/CSV, and cloud files. After generation, inspect whether each slide has one central insight, one primary chart or table, and a visible source note.
5. Verify, export, and hand off
- Source match: Tie every material number back to the original model, ERP export, or approved board pack.
- Version lock: Add a file version and timestamp to the working deck so reviewers do not overwrite each other.
- Reviewer roles: Assign one person to numbers, one to narrative, and one to disclosure/security if the deck leaves the company.
- Export QA: Export as PPTX or PDF, then reopen the file to confirm labels, chart objects, fonts, and footnotes render correctly.
AI should produce the first draft and the formatting system. Finance leaders should own the assumptions, definitions, and decision logic.
Use AI for the repetitive first pass: reorganizing notes, suggesting slide titles, turning tables into charts, and normalizing formatting. Keep human ownership where errors are expensive: revenue recognition wording, non-GAAP definitions, M&A references, investor claims, covenant calculations, and board recommendations.
When comparing AI presentation makers, evaluate the whole delivery chain rather than only the prettiness of the first output. For finance, the useful tool is the one that helps you move from controlled inputs to outline review, editable charts, PPTX/PDF export, and documented human verification.
Choose the Right Charts for Financial Slide Design
Financial chart choice should follow the business question, not the chart menu.
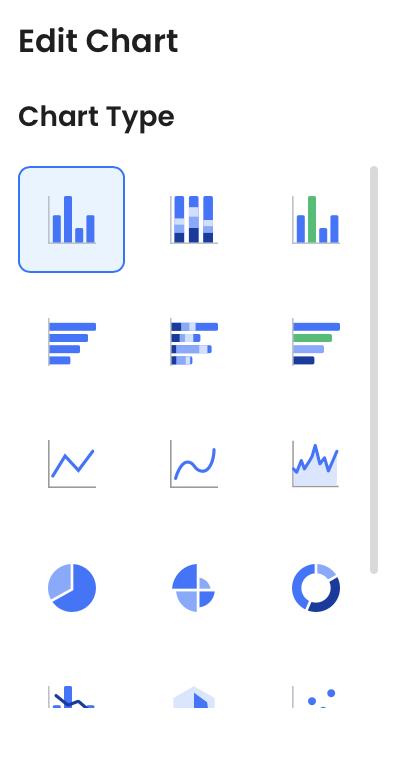
Match chart type to message
- Trend: Use line or column charts for ARR, revenue, gross margin, cash balance, headcount, pipeline, or forecast movement over time.
- Comparison: Use sorted bars for business units, regions, vendors, cost centers, or customer concentration.
- Composition: Use stacked bars or small multiples for revenue mix by product, region, or customer type. Use donut charts only when there are few categories and all values are positive.
- Relationship: Use scatter or bubble charts for sales efficiency versus growth, burn multiple versus ARR growth, customer concentration versus margin, or cohort size versus retention.
- Variance: Use waterfall charts or variance tables for EBITDA movement, gross margin bridge, cash burn bridge, or budget versus actual explanations.
Finance chart decision table
| Financial question | Better visual | Design note |
|---|---|---|
| Is revenue growth accelerating or slowing? | Line or column chart | Add YoY/QoQ callouts and mark actuals versus forecast. |
| Why did EBITDA change? | Waterfall bridge | Separate revenue, gross margin, OPEX, one-time items, and FX. |
| Which departments drove the OPEX variance? | Sorted horizontal bar | Use favorable/unfavorable logic based on metric type. |
| How long is cash runway? | Cash balance line plus threshold | Show minimum cash policy, financing assumptions, and downside trigger. |
| Is retention improving by cohort? | Cohort heatmap or retention curve | Avoid averaging cohorts if older cohorts behave differently. |
| How sensitive is the plan? | Scenario table or tornado chart | State the two or three assumptions that move the outcome most. |
Tables still matter when precision is more important than pattern recognition.
Analysis: Many AI-generated finance decks overuse pie charts because they look simple. But pie charts make it hard to compare small differences, negative values, or many categories. If expenses are Sales $4.8M, R&D $4.5M, G&A $2.1M, Marketing $1.9M, and Other $0.7M, a pie forces the audience to estimate angles. A sorted horizontal bar immediately shows that Sales and R&D are nearly equal and together drive most spend.
Format Numbers, Labels, and Units Before You Present
Financial credibility often depends on small details: whether the slide uses $M or $K, whether percentages are rounded consistently, whether negative values appear in red or parentheses, and whether the chart title matches the reporting period.
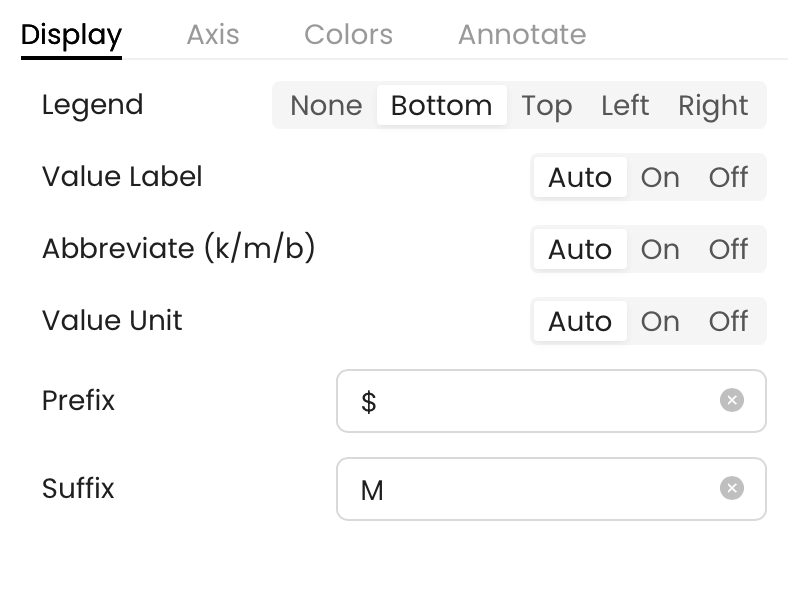
Chart editing controls matter because finance slides often fail at the edges: an axis starts above zero and exaggerates a margin change, a label says “revenue” when the data is bookings, or a variance color implies good news when it is not. Use chart settings to support the finance task, not to decorate the page.
- Data table editing: Correct imported values, remove stale rows, and confirm actuals and forecast are not mixed.
- Axis settings: Use zero baselines for bars unless you have a defensible reason not to; set cash charts around covenant or policy thresholds.
- Reference lines: Show budget, plan, minimum cash, target margin, or covenant thresholds.
- Prefix/suffix controls: Standardize $M, %, x, bps, and headcount labels.
- Data labels: Label the few points that matter for the decision, not every point on the chart.
Use a financial formatting checklist
- Define currency, unit, and period in the subtitle or footnote: “USD $M, Q2 FY2026, management reporting basis.”
- Keep decimal places consistent: usually one decimal for $M and percentages, none for headcount, and one decimal for multiples.
- Use basis points for margin movement: “Gross margin +320 bps,” not “+3.2%” if you mean percentage-point change.
- Distinguish actuals, forecast, and management estimates with labels, shading, or dashed lines.
- Use green and red carefully; revenue above plan is favorable, but expense above plan is usually unfavorable.
- Explain GAAP versus non-GAAP metrics and adjusted exclusions in a footnote.
- Check rounding reconciliation: totals should not appear to disagree with visible components.
- Use one convention for negative values, such as
($1.2M)or-1.2M, and apply it consistently. - Put source notes where the audience can see them, especially for investor or board decks.
Common finance notation standards
| Metric type | Typical format | Example |
|---|---|---|
| Revenue or OPEX | Currency with scale | $12.4M |
| Gross margin | Percentage | 64.2% |
| Margin change | Basis points | +320 bps |
| Valuation or efficiency multiple | Multiple | 3.1x |
| Headcount | Whole number | 142 |
| Negative cash flow | Company convention | ($1.2M) or -$1.2M |
Prompt Templates to Design Financial Slides with AI
Finance prompts need guardrails. They should constrain source files, forbid invented numbers, separate actuals from forecasts, and ask the AI to flag missing or conflicting data instead of silently filling gaps.
Monthly close deck prompt
Create a 10-slide monthly finance review for [audience] covering [period]. Use only the attached [P&L/report/notes] and cite the source file or tab for each material number. Compare actuals against [budget/prior month/prior quarter/prior year]. Focus on revenue, gross margin, operating expenses, cash movement, budget variance, and forecast changes. Do not invent missing values. Flag any inconsistent figures or definitions. Each slide should have an insight-led title, one recommended chart, a source note, and one management implication. Put detailed account tables in the appendix.
Budget variance prompt
Analyze budget vs actual for [period]. Identify the top five favorable and unfavorable variances by dollar amount and percentage, using [threshold] as the materiality cutoff. Define favorable/unfavorable by metric type: higher revenue is favorable, higher expense is unfavorable unless noted otherwise. Avoid percentage variance when the base is too small to be meaningful. Create slides that explain driver, owner, whether the variance is timing or structural, expected forecast impact, and recommended action. Cite the source tab for each variance.
Investor update prompt
Build an investor update deck for a [stage] [business model] company. Emphasize the metrics relevant to this model: [ARR/revenue/GMV/bookings], retention or repeat purchase behavior, gross margin, burn multiple, runway, pipeline, risks, milestones to the next round, and funding or support ask. Use confident but conservative language. Separate actuals from forecast. Do not include customer-level names unless they appear in the approved source. Flag assumptions, legal-sensitive claims, and numbers requiring human verification.
Completed deck review prompt
Review this finance deck as a skeptical CFO. Identify unsupported claims, missing source notes, inconsistent metric definitions, confusing variance signs, unclear actual-versus-forecast labels, and slides where the title does not match the chart. Return a table with slide number, issue, risk level, and recommended fix.
After generation, use natural-language editing to tighten the output. For example: “Rewrite this page for a CFO audience, reduce to three bullets, keep the margin risk, and make the title a conclusion.” In an editorial test using a 10-slide Q2 finance review built from a P&L export, revenue CSV, and CFO notes, PopAi’s rewrite flow was most useful for shortening verbose slide copy and producing alternative executive titles. The manual corrections were still finance-specific: adjusting variance language, checking that forecast labels were not treated as actuals, and confirming exported PPTX labels remained readable.
Verify AI-Generated Financial Slides Before Sharing
Verification is the highest-risk step in an AI finance slide workflow. A slide can look polished and still contain an unsupported financial claim.
Source and formula checks
- Source match: Confirm every material number against the original Excel model, ERP export, board pack, or audited statement.
- Formula logic: Recalculate YoY, QoQ, CAGR, gross margin, EBITDA margin, burn multiple, net dollar retention, and runway.
- Actuals vs forecast: Confirm that actuals, forecast, plan, and management estimates are visually separated and labeled.
- Rounding: Check that totals reconcile after rounding and that charts do not imply false precision.
- Definitions: Clarify ARR vs revenue, bookings vs billings, gross vs net retention, adjusted vs GAAP metrics, and free cash flow methodology.
Narrative and governance checks
- Decision logic: Confirm the recommendation follows from the data and does not overstate certainty.
- Footnotes: Add source date, scenario assumptions, exclusions, FX basis, and any non-recurring items.
- Reviewer ownership: Analyst checks source match; FP&A manager checks variance logic; CFO checks narrative and decision; Legal/IR checks external statements.
- Version control: Save a dated file name and keep a change log for board, audit committee, fundraising, or investor materials.
- Editable output: Confirm exported PPTX text objects remain editable and that PDF export renders labels correctly.
Compliance reminder: Do not upload confidential payroll data, customer-level revenue, bank information, unpublished M&A details, material non-public information, or personally identifiable information to any AI tool unless your organization has approved the tool, data retention policy, access permissions, encryption standards, audit process, and whether uploaded data may be retained or used for training. For public companies, investor-facing or MNPI-related materials should follow disclosure controls before upload or distribution.
Redaction workflow before upload
- Remove hidden tabs, raw payroll sheets, bank account details, customer names, and employee-level data unless approved.
- Replace customer names with anonymized labels such as “Customer A” when concentration analysis is needed.
- Upload summarized exports instead of full planning models when formulas, assumptions, or confidential tabs are not required.
- Document which files were uploaded, who approved the upload, and which deck version was generated from them.
PopAi can support finance workflows by generating from source materials, organizing a content plan, offering chart and layout edits, and exporting PPTX/PDF. But no presentation tool should be treated as an auditor, valuation expert, or accounting authority. The practical operating model is simple: start with the decision, control the source package, let AI draft the structure, choose charts by question, standardize formatting, verify every material number, and protect confidential data before sharing.
FAQ: Designing Financial Slides with AI
Can AI turn a financial report into a presentation automatically?
Yes. AI can summarize a report, extract key metrics, draft a narrative, and generate editable slides. You still need to verify formulas, source dates, accounting definitions, and strategic conclusions before presenting.
What financial slides should every investor or board deck include?
Most finance decks need an executive summary, KPI snapshot, revenue trend, expense breakdown, margin or profitability analysis, cash runway or cash flow, forecast, risks, and decisions or funding ask.
Which charts work best for financial slides?
Use line charts for trends, bars for comparisons, waterfalls for bridges, stacked bars for mix, tables for precise line items, and KPI cards for headline metrics. Avoid decorative charts that do not support a decision.
Is it safe to upload financial data to an AI presentation tool?
Treat financial data as confidential. Remove personally identifiable information, unpublished deal details, payroll records, bank data, and customer-level data unless your organization has approved the tool, permissions, retention policy, and audit process.
What should humans check after AI creates financial slides?
Check source files, formulas, rounding, units, currency, time periods, YoY and QoQ calculations, chart labels, footnotes, assumptions, and whether the narrative matches management’s approved message.
Create your presentation with one click now
Turn finance reports, planning notes, and executive briefs into structured, editable presentation drafts faster.
Create with PopAi