A restaurant founder can turn a menu, weekly sales report, and site notes into a first-draft investor deck—but only if the slides keep sourced facts separate from estimates.
This guide includes audience-specific outlines, copy-ready prompts for four common decks, a simple data-labeling template, and a review workflow. Before you start, gather the decision you want from the audience, current source documents, brand assets you have permission to use, and one person who can verify the numbers.
Three Restaurant Slide Template Sets
Each group contains three finished sample pages: opening plan, catering proposal and store report. All dates, prices, capacity assumptions and performance figures are illustrative; replace them before use.
Open full-size examples and editable HTML layoutsOpening plan
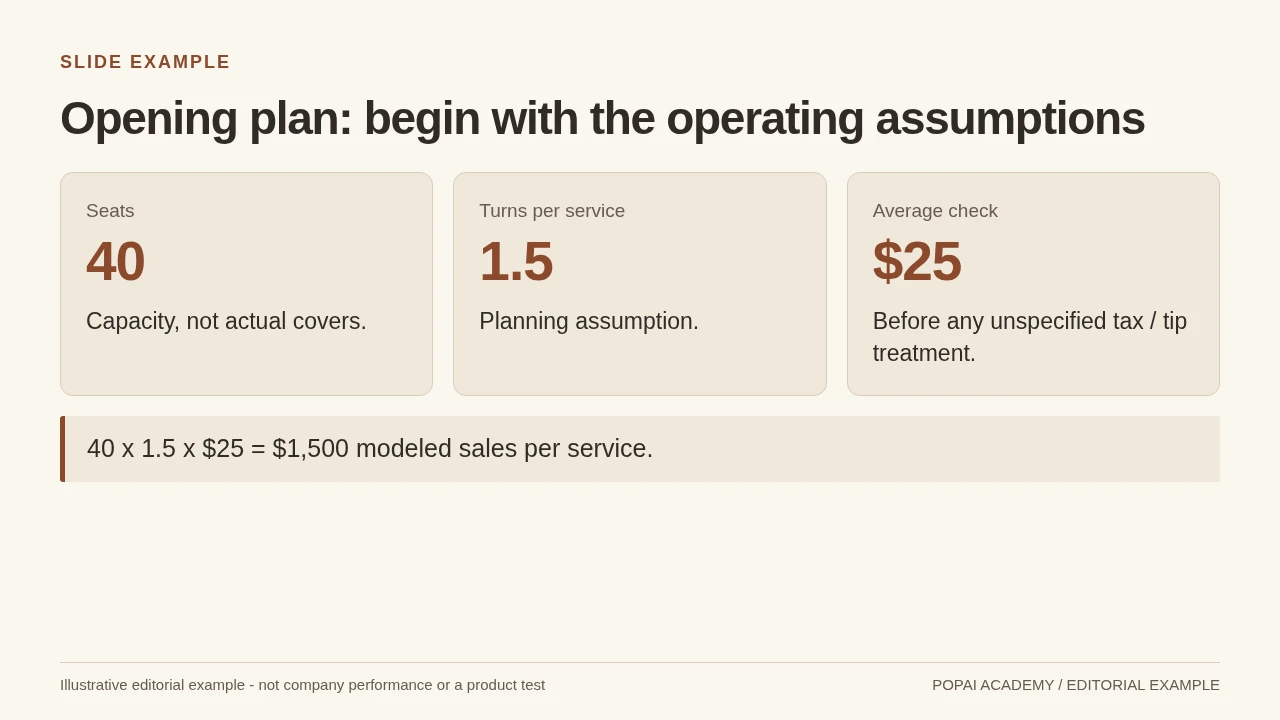
Opening plan page 1: hypothetical seat/turn/check assumptions, not achieved sales.
Read or copy the slide content
Seats
40
Capacity, not actual covers.
Turns per service
1.5
Planning assumption.
Average check
$25
Before any unspecified tax / tip treatment.
40 x 1.5 x $25 = $1,500 modeled sales per service.
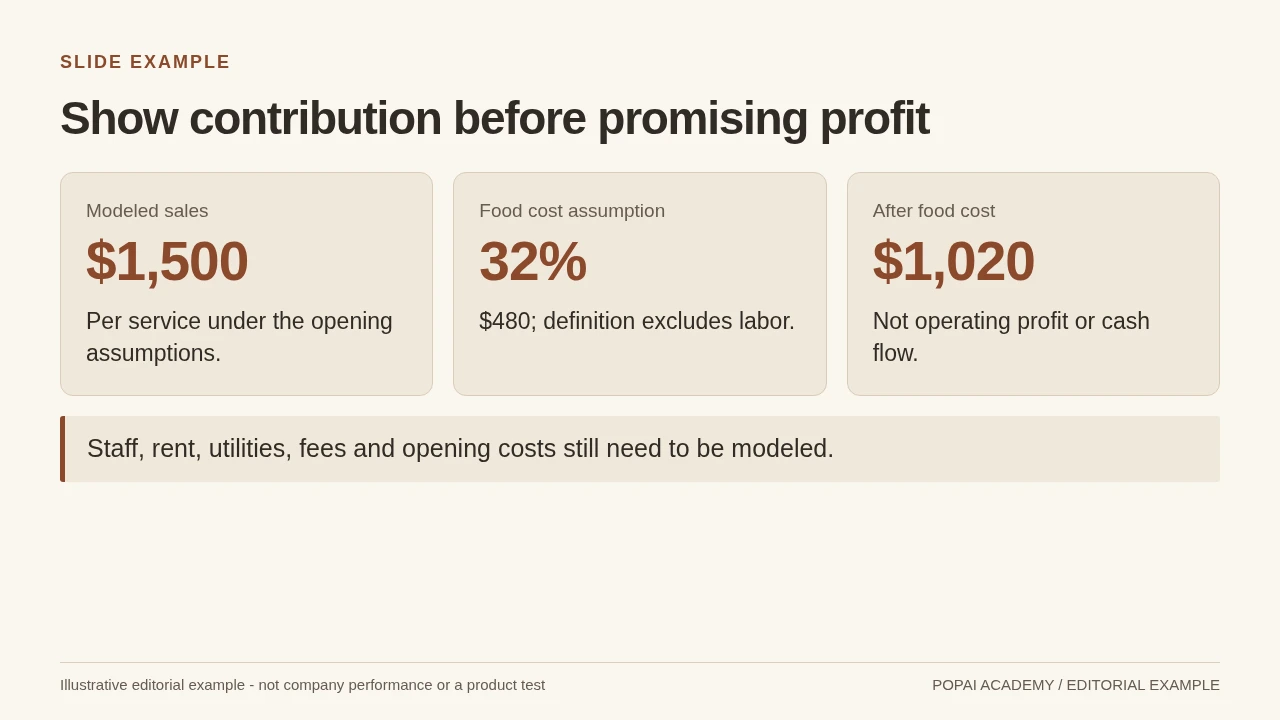
Opening plan page 2: distinguish food contribution from total profit.
Read or copy the slide content
Modeled sales
$1,500
Per service under the opening assumptions.
Food cost assumption
32%
$480; definition excludes labor.
After food cost
$1,020
Not operating profit or cash flow.
Staff, rent, utilities, fees and opening costs still need to be modeled.
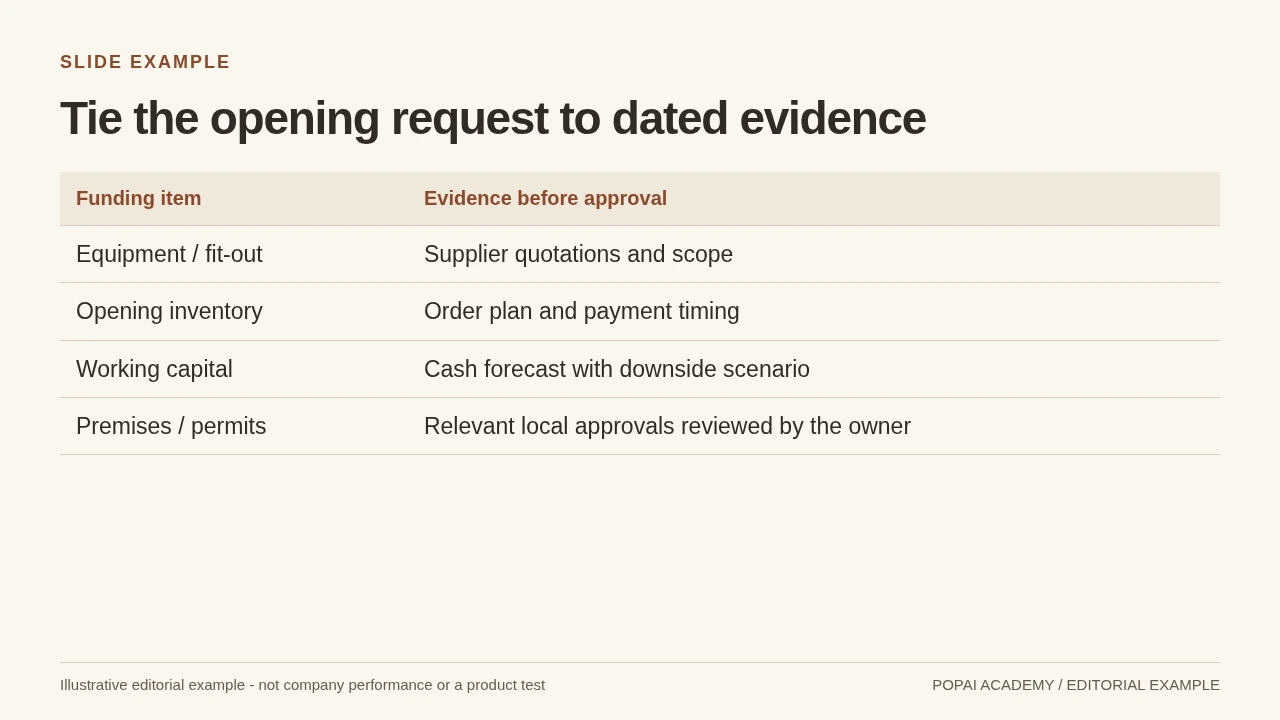
Opening plan page 3: no lending approval or regulatory authorization is implied.
Read or copy the slide content
Funding item
Evidence before approval
Equipment / fit-out
Supplier quotations and scope
Opening inventory
Order plan and payment timing
Working capital
Cash forecast with downside scenario
Premises / permits
Relevant local approvals reviewed by the owner
Prompt for Opening plan
Create a slide with the purpose "Tie the opening request to dated evidence". Use these approved source fields or replace the illustrative inputs before use: Funding item Evidence before approval Equipment / fit-out Supplier quotations and scope Opening inventory Order plan and payment timing Working capital Cash forecast with downside scenario Premises / permits Relevant local approvals reviewed by the owner. Preserve labels, units, source notes and any uncertainty. Do not add results, claims, customers or capabilities. Suggest a readable layout and keep the output editable in the chosen tool.
Catering proposal
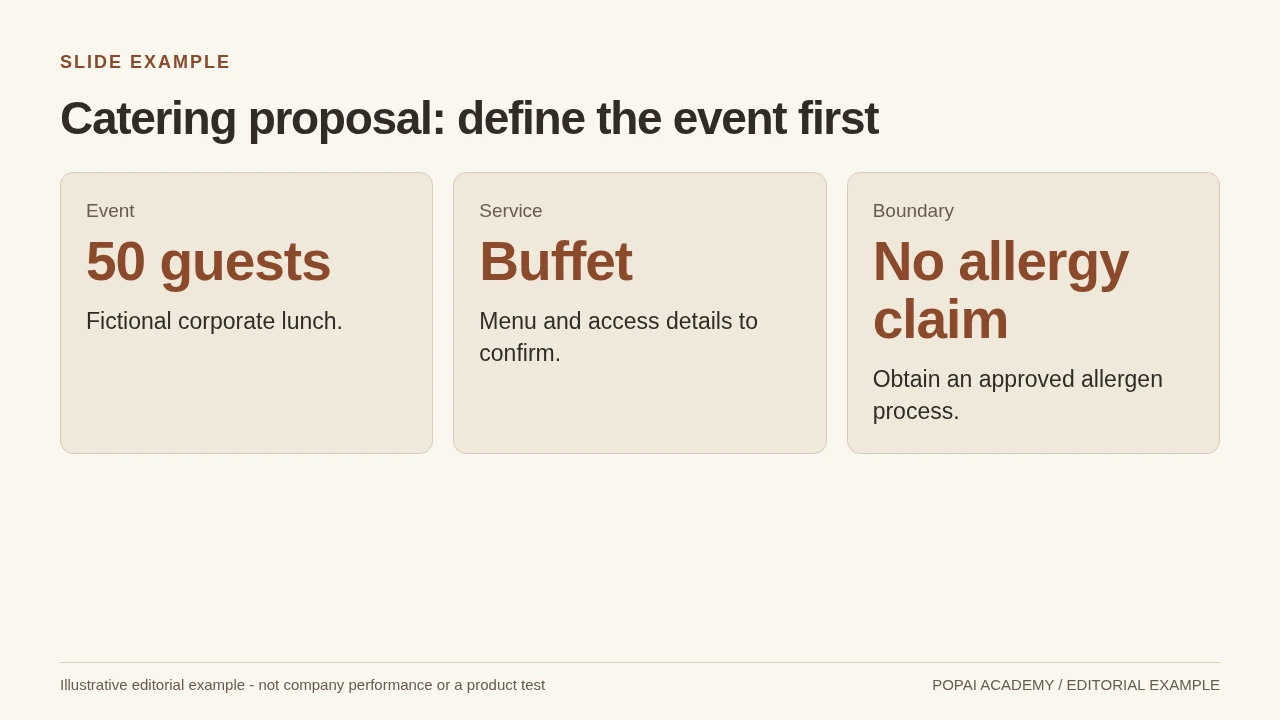
Catering page 1: fictitious event brief with unresolved dietary requirements.
Read or copy the slide content
Event
50 guests
Fictional corporate lunch.
Service
Buffet
Menu and access details to confirm.
Boundary
No allergy claim
Obtain an approved allergen process.
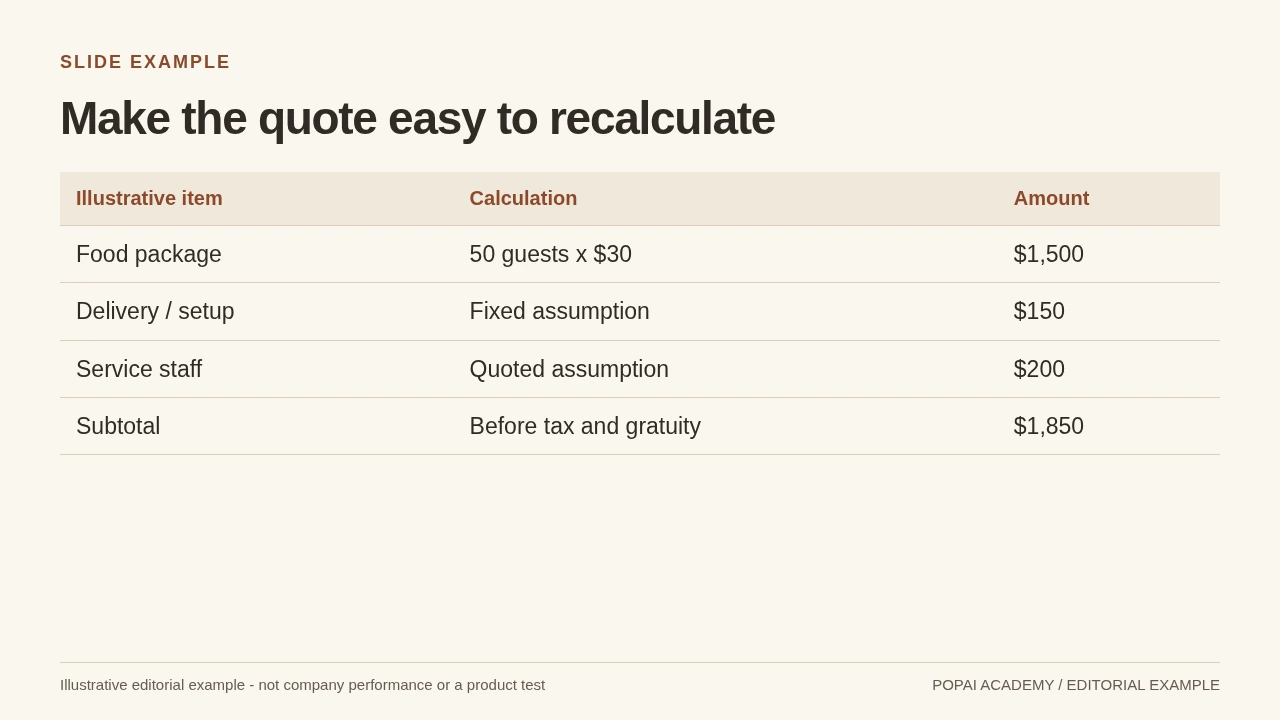
Catering page 2: explicit units and scope; not a current restaurant price list.
Read or copy the slide content
Illustrative item
Calculation
Amount
Food package
50 guests x $30
$1,500
Delivery / setup
Fixed assumption
$150
Service staff
Quoted assumption
$200
Subtotal
Before tax and gratuity
$1,850
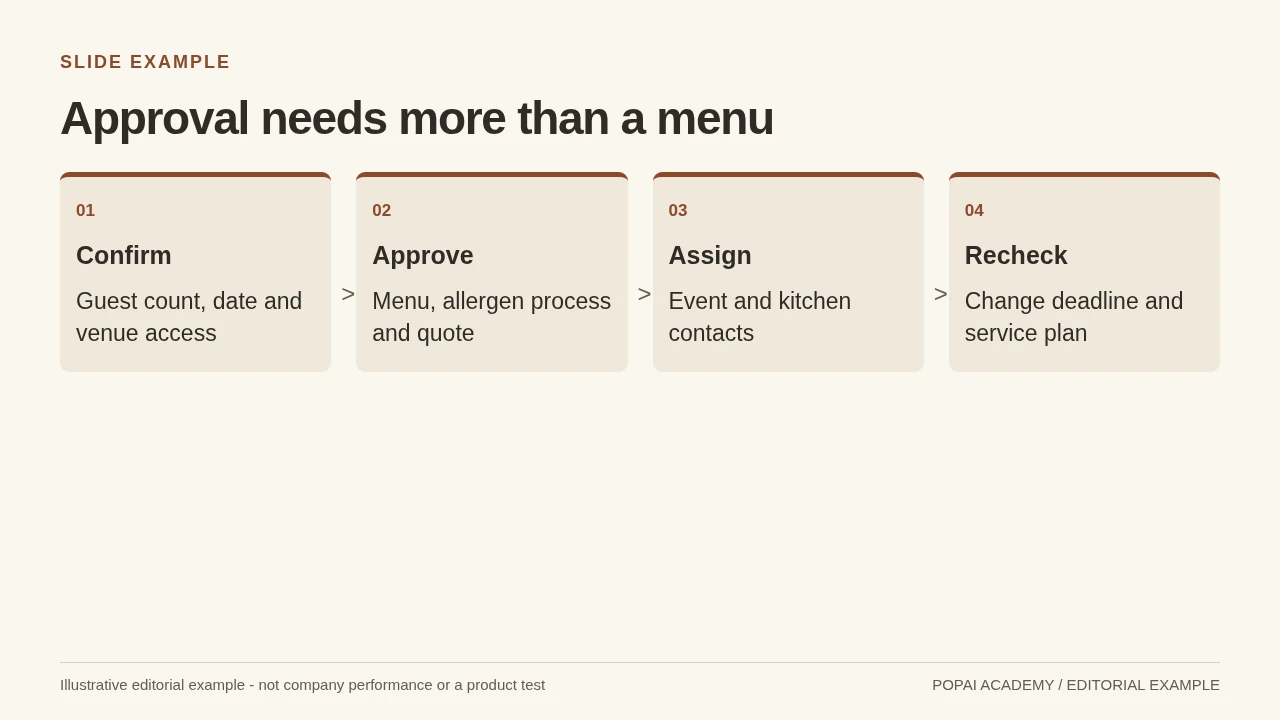
Catering page 3: clear actions and owners rather than fabricated event details.
Read or copy the slide content
01
Confirm
Guest count, date and venue access
02
Approve
Menu, allergen process and quote
03
Assign
Event and kitchen contacts
04
Recheck
Change deadline and service plan
Prompt for Catering proposal
Create a slide with the purpose "Approval needs more than a menu". Use these approved source fields or replace the illustrative inputs before use: 01 Confirm Guest count, date and venue access 02 Approve Menu, allergen process and quote 03 Assign Event and kitchen contacts 04 Recheck Change deadline and service plan. Preserve labels, units, source notes and any uncertainty. Do not add results, claims, customers or capabilities. Suggest a readable layout and keep the output editable in the chosen tool.
Store operating report
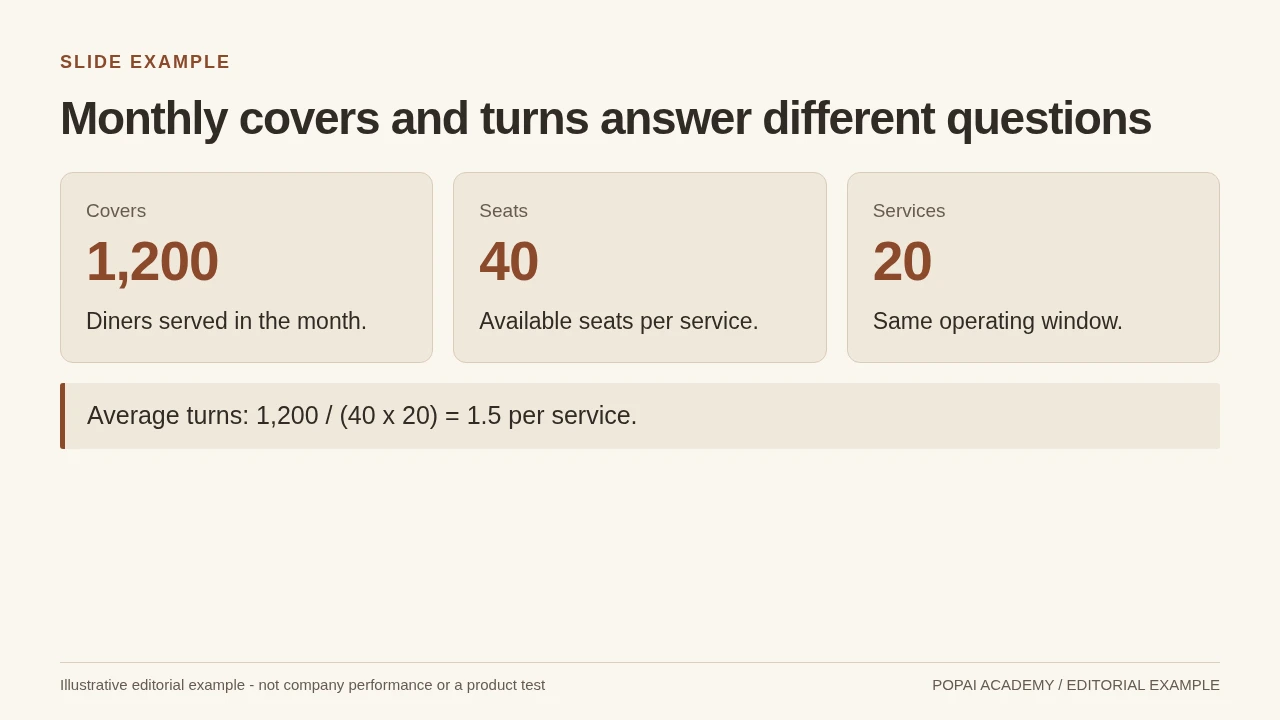
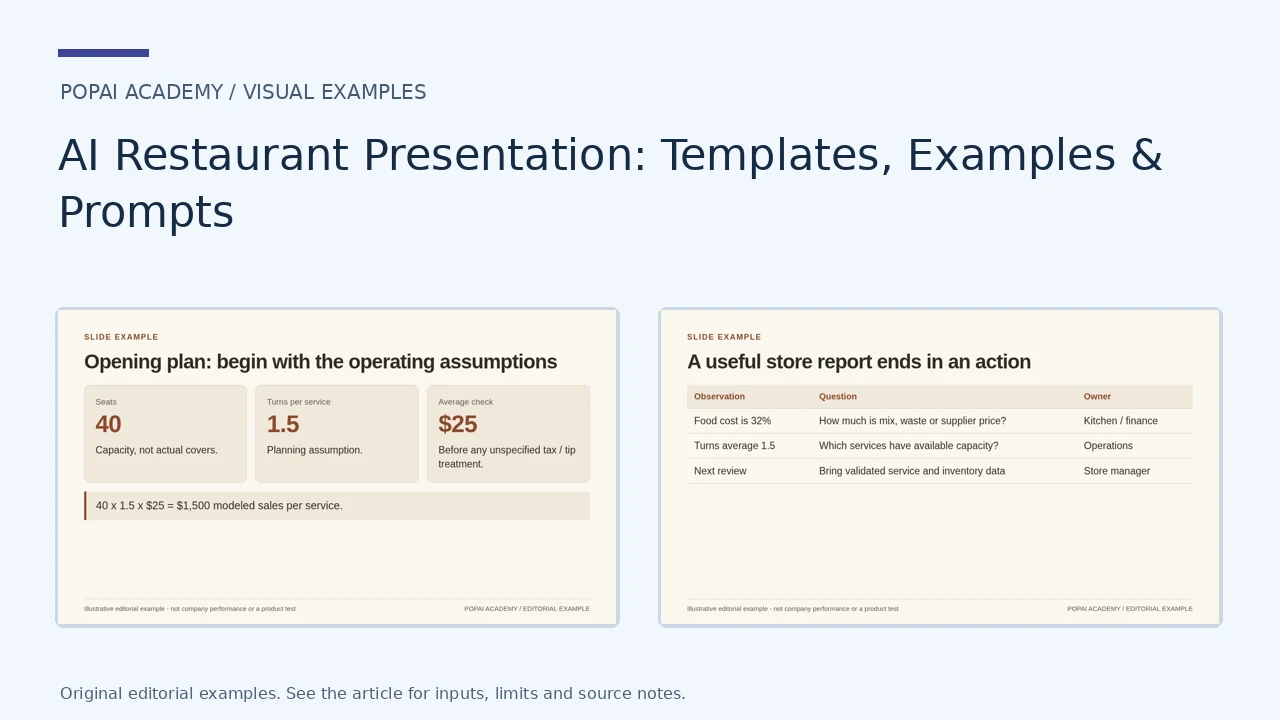
Store report page 1: illustrative turns using explicit seat and service counts.
Read or copy the slide content
Covers
1,200
Diners served in the month.
Seats
40
Available seats per service.
Services
20
Same operating window.
Average turns: 1,200 / (40 x 20) = 1.5 per service.
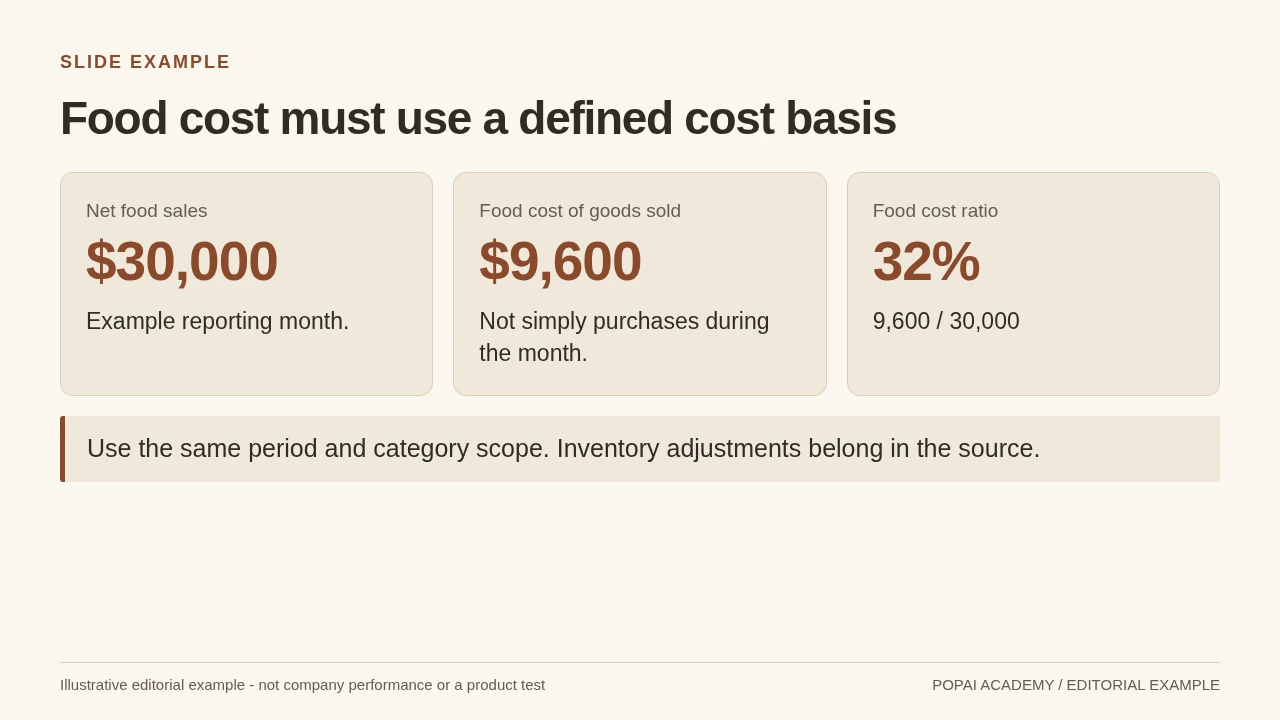
Store report page 2: synthetic values, not a recommended target.
Read or copy the slide content
Net food sales
$30,000
Example reporting month.
Food cost of goods sold
$9,600
Not simply purchases during the month.
Food cost ratio
32%
9,600 / 30,000
Use the same period and category scope. Inventory adjustments belong in the source.
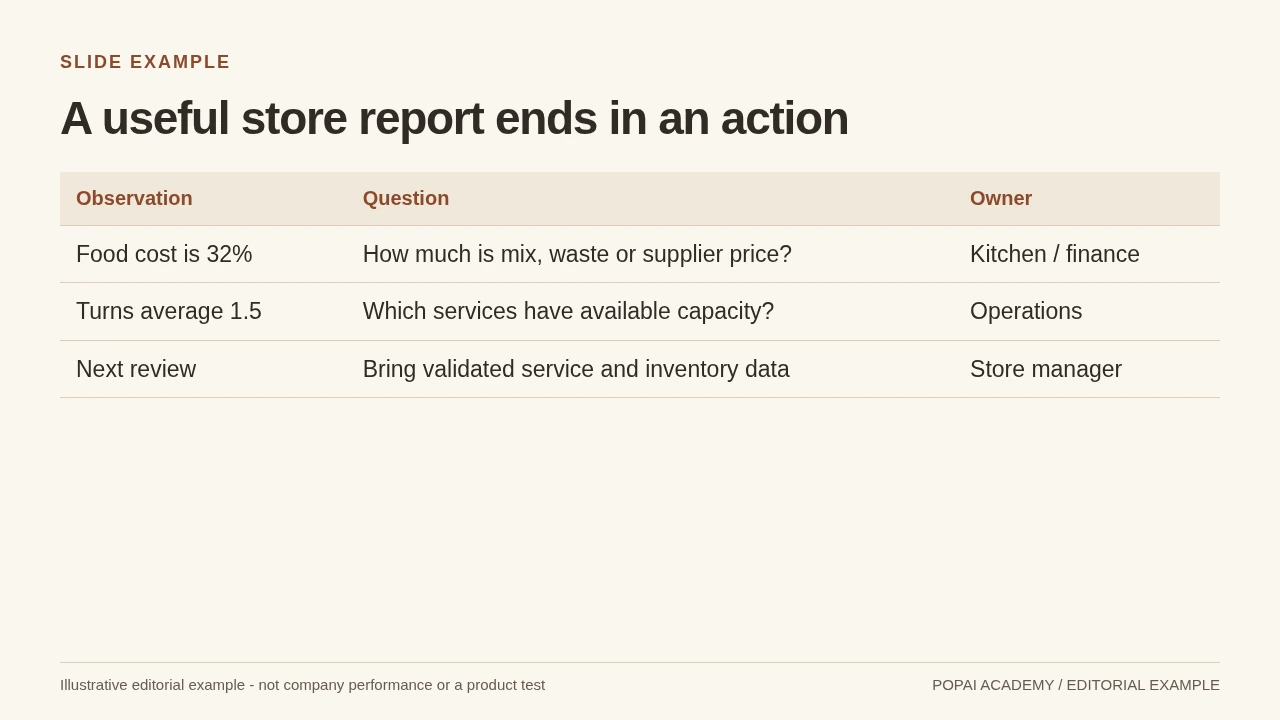
Store report page 3: do not infer a cause from a single ratio.
Read or copy the slide content
Observation
Question
Owner
Food cost is 32%
How much is mix, waste or supplier price?
Kitchen / finance
Turns average 1.5
Which services have available capacity?
Operations
Next review
Bring validated service and inventory data
Store manager
Prompt for Store operating report
Create a slide with the purpose "A useful store report ends in an action". Use these approved source fields or replace the illustrative inputs before use: Observation Question Owner Food cost is 32% How much is mix, waste or supplier price? Kitchen / finance Turns average 1.5 Which services have available capacity? Operations Next review Bring validated service and inventory data Store manager. Preserve labels, units, source notes and any uncertainty. Do not add results, claims, customers or capabilities. Suggest a readable layout and keep the output editable in the chosen tool.
Choose an AI restaurant presentation structure for your audience
Build around the decision your audience needs to make, not a generic list of restaurant topics.
A lender needs to understand repayment capacity; a landlord needs confidence that the proposed use fits the site and the tenant can open responsibly. Staff need clear procedures, while a catering client needs a menu, price, and service plan. Slide counts below are editorial starting points—not industry standards—and should grow only when the decision needs more evidence.
| Audience and goal | Useful sequence | Evidence to prepare |
|---|---|---|
| Investor or lender: assess the opportunity | Concept, demand, menu economics, site, operating model, team, funding need, risks, next step | Opening budget, forecast assumptions, founder experience, source-dated market research |
| Landlord: assess site and tenant readiness | Brand fit, proposed use, customer fit, space needs, operating plan, build-out, opening schedule | Service hours, seating and kitchen requirements, utility and ventilation needs, funding status, realistic milestones |
| Franchise prospect: assess the model | Brand promise, operating model, support, investment process, qualification steps | Approved disclosure documents and verified, appropriately qualified unit-level information |
| Staff: prepare for service or launch | Guest journey, role steps, menu knowledge, service recovery, safety, knowledge check | Current recipes, approved procedures, shift roles, escalation contacts |
| Catering client: approve an event proposal | Client needs, menu options, service format, logistics, inclusions, pricing, next step | Headcount, dietary needs, confirmed prices, staffing and setup requirements, availability |
| Restaurant manager: decide what to change | Period summary, sales mix, labor and cost trends, service issues, actions and owners | POS and payroll reports, inventory records, comparable periods, action status |
Reusable investor outline: 1) “A neighborhood dinner concept for [guest]”; 2) “The menu is designed around [occasion or need]”; 3) “Evidence suggests [specific local demand signal]”; 4) “The proposed site supports [service model]”; 5) “Startup uses total [verified amount or Needs input]”; 6) “Sales scenarios depend on [covers, average check, and operating days]”; 7) “The team has experience in [documented roles]”; 8) “The decision requested is [amount or next step].” Pair demand with a sourced map or survey, menu economics with a costed menu table, and the site slide with documented access, capacity, or lease details—not decorative food photos.
One slide should make one decision easier. If a slide cannot change what the audience understands or does next, cut it or move the detail to an appendix.
Write a precise AI restaurant presentation prompt
Give the generator a bounded brief, source rules, and a chance to show its outline before it drafts slides.
First remove unnecessary personal or confidential information. Do not upload customer names, payment details, employee records, payroll identifiers, or unreleased financials unless your organization has approved the tool and its data terms. Replace names with roles, aggregate sensitive figures where possible, and check retention and sharing settings before uploading files.
“Create a [number]-slide presentation for [audience] to support this decision: [decision]. The restaurant is [concept, service style, location or proposed area]. Use only the source material pasted below. For every factual claim, include a short source label and date in the slide or speaker notes. Mark each number ACTUAL, FORECAST, or ESTIMATE; if information is absent, write ‘Needs input’ rather than filling the gap. Do not invent sales, costs, customer research, competitors, site conditions, or credentials. Use conclusion-led slide titles, label units and periods, and suggest a chart only when the source data supports it. First return a slide-by-slide outline and a list of missing inputs for human review; do not draft the slides until I approve the outline. Sources: [paste sanitized facts, document names, periods, and dates]. Brand direction: [colors, typography, image style].”
Investor prompt: “Organize the approved facts into concept, customer evidence, menu and pricing, site rationale, operating plan, team, startup budget, forecast scenarios, risks, and funding request. Show forecast drivers separately from actual results.”
Landlord prompt: “Create a tenant proposal covering intended use, customer fit, service hours, seating and kitchen needs, utility or ventilation requirements, build-out responsibilities, funding status, and a milestone-based opening schedule. Mark unconfirmed site specifications as Needs input.”
Staff-training prompt: “Create a [length]-minute briefing for [roles] before [service or opening]. Use only the approved procedures below. Include role-specific steps, menu facts, escalation contacts, and a short knowledge check. Do not create food-safety rules; flag missing procedures for the manager.”
Catering prompt: “Prepare a proposal for [event date and client type] for [confirmed or estimated headcount]. Cover the client’s needs, menu choices, dietary requirements, service format, setup and staffing, inclusions and exclusions, price, availability status, and approval deadline. Label any unconfirmed price or availability.”
For example, paste a sanitized source line such as “POS export, 1–30 September 2026: net sales $48,200; actual; report generated 3 October 2026” rather than asking the system to infer performance from notes. You can use PopAi AI Presentation to work from a prompt or supplied materials; whatever tool you use, inspect its proposed outline and source handling before generating or sharing slides. When comparing AI presentation makers, check supported inputs, editing, export, privacy terms, and image or template licensing against your needs.
Ground restaurant slides in verifiable data
Choose metrics for the decision, then label their definition, period, status, source, and owner.
Choose metrics that answer the audience’s question
- Launch or funding deck: Show startup uses, cash needed by milestone, break-even assumptions, and forecast scenarios. State how forecast sales are built—for example, operating days × expected covers per day × average check per cover. A cover generally means one guest served; define your POS convention if it differs.
- Operating review: Pair net sales with sales by channel, covers, average check, labor hours, and relevant cost trends. Average check should specify its denominator: sales per guest/cover or per transaction. Use the same definition and comparable periods throughout.
- Site or landlord deck: Show seating capacity, planned service hours, estimated seat turns, and occupancy costs only when supported by site and lease information. A seat turn is a seat’s use during a defined service period; assumptions about turns should be labeled, not presented as observed demand.
- Catering proposal: Emphasize confirmed headcount, price per guest or total price, staffing, delivery or setup costs, and contribution after direct event costs. Contribution is not the same as profit; show which costs are included.
Definitions and accounting treatment can vary between businesses. Agree on consistent internal definitions with your accountant or finance lead before comparing periods or presenting ratios. For example, “prime cost” is commonly used for food and beverage costs plus labor costs, but the categories included can differ; state your formula and denominator rather than relying on the label alone.
Label actuals, forecasts, and missing inputs
Use a compact source log so a reviewer can trace every material figure. For a new concept with no operating history, present scenarios based on explicit drivers rather than implying that a forecast is a result.
| Metric | Period and status | Source and date | Owner / check |
|---|---|---|---|
| Net sales: $48,200 | September 2026; ACTUAL | POS monthly report; generated 3 Oct 2026 | General manager; matched to report |
| Average check: $28 | September 2026; ACTUAL, per cover | POS report; generated 3 Oct 2026 | Finance lead; confirm cover definition |
| Daily covers: 92 | Opening scenario; FORECAST | Assumption pending validation; 19 Oct 2026 | Founder; compare low/base/high cases |
Illustrative calculation, not a benchmark: If a restaurant serves 85 covers in a day and its average check is $32 per cover, estimated sales for that day are 85 × $32 = $2,720, before any adjustments needed for taxes, discounts, or the business’s reporting convention. If food cost for the same period is $816 and food sales—not total sales—are $2,720, food cost is $816 ÷ $2,720 = 30%. If $2,720 instead represents total sales, the calculation does not establish a food-cost rate unless food sales are known.
Make charts auditable
Use a descriptive title, units, date range, and consistent denominator. For a sales chart, compare like periods and distinguish dine-in, takeaway, and delivery if the channel mix affects the decision. For a location claim, show the underlying dated source—such as a public planning document, documented site visit, or customer survey—rather than a generated summary. Check the chart’s data table as well as its appearance.
When operating history is limited, a transparent range of scenarios is more useful than a precise-looking forecast with hidden assumptions.
Match restaurant presentation templates to the brand
Use repeatable slide layouts that make restaurant evidence easy to compare and discuss.
Choose a visual style for the audience: a customer-facing catering proposal can lead with menu photography, while a lender or landlord deck should give more space to costs, specifications, and milestones. Use the same type, color, and chart rules throughout; do not let a background image reduce contrast or make figures hard to read when projected.
- Menu-mix slide: Title it with the decision, such as “Three dishes account for [verified share] of entrée sales.” Show item, units sold, sales, and period in a compact bar chart or table; include food cost only if it uses the same period and a confirmed recipe cost.
- Location-rationale slide: Use a labeled map or site photo beside three evidence points: customer or trade-area evidence, access or visibility, and site constraints. Put the source and date under each point; leave unknown utilities or lease terms as open questions.
- Catering proposal slide: Show the menu choice, price basis (per guest or total), included service, and a simple event timeline. Add dietary substitutions only when the kitchen has confirmed them.
Keep slide text brief as a visual heuristic, not a rule: a procedure, financial table, or lease requirement may need more detail to be useful. Use speaker notes or an appendix for supporting calculations. Use only photos and logos you own or are licensed to use, and keep image treatment consistent—mixing unrelated stock-food styles can make a real menu feel less credible. If a tool exports a deck, inspect the final file on the presentation device for cropped text, altered charts, and font or image issues before sending it.
Review the AI restaurant presentation before sharing
Assign an owner to each important claim, record its source and check date, then approve the final deck close to presentation day.
- Log claims: Record the claim, source document or link, owner, date checked, and status (verified, assumption, or unresolved).
- Route by expertise: Have the manager confirm operating procedures and staffing; the finance lead or accountant check calculations and definitions; and the site lead or broker confirm site and lease details.
- Resolve or label gaps: Remove unsupported claims, mark open items as Needs input, or identify a forecast explicitly as a scenario with its assumptions.
- Recheck changing details: Confirm prices, staffing, availability, site terms, and forecasts near the meeting date—not only when the first draft is made.
- Rehearse and approve: Test readability on the intended screen, check the story and next step, and obtain approval from the person accountable for the presentation.
| Claim | Source / owner | Checked | Status |
|---|---|---|---|
| Menu price: $18 | Approved menu / manager | 19 Oct 2026 | Verified; recheck before client send |
| Opening in March | Project schedule / site lead | 19 Oct 2026 | Estimate; depends on permits |
Do not present until: financial figures reconcile to their sources; site requirements are confirmed or clearly marked open; menu prices and availability are current; and staffing or service instructions have manager approval. A polished slide is not evidence that its claim is ready.
Restaurant presentation examples by use case
These short outlines show how the same source-first workflow changes with the audience and the decision.
Investor deck: show the case and the open assumptions
Prompt: “Use the supplied menu, startup budget, founder bios, and dated neighborhood research to draft an investor outline. Separate evidence from forecast drivers; leave missing sales history as Needs input.”
Sample six-slide outline: 1) “A [cuisine] dinner concept for [target guest]”; 2) “The proposed menu is priced for [documented positioning]”; 3) “Local evidence supports testing [occasion or area]” (cite the research and date); 4) “The opening budget covers [verified cost categories]”; 5) “The base case depends on [covers × average check × operating days]”; 6) “The next decision is [specific funding discussion].” If there is no trading history, label slide 5 “Illustrative forecast scenario,” show the drivers, and omit invented sales actuals.
Human check: Replace a vague AI claim such as “strong demand in the neighborhood” with the actual finding, sample size, source, and date—or remove it if no evidence exists.
Landlord proposal: demonstrate site fit and readiness
Prompt: “Create a six-slide tenant proposal from the supplied concept brief and site documents. Cover intended use, service hours, customer fit, space and utility requirements, build-out responsibilities, funding status, and a milestone-based opening plan. Flag any unconfirmed specification.”
Sample sequence: “The concept serves [occasion and customer]”; “The service model requires [documented seating and kitchen needs]”; “The proposed hours align with [evidence or rationale]”; “Ventilation, power, and delivery access require confirmation”; “Build-out and approvals are planned against [dated milestones]”; “The next step is a site review of [open items].” Do not state that ventilation, power, or permitted use is adequate until the relevant site documentation or qualified professional confirms it.
Catering proposal: make scope and price easy to approve
Prompt: “Prepare a client proposal using the confirmed event brief, menu, price list, and staffing plan. Label the headcount as confirmed or estimated, list inclusions and exclusions, and flag unconfirmed availability.”
Sample five-slide sequence: “The brief calls for [event format] for [headcount status]”; “Choose from these confirmed menu packages”; “Service includes [staffing, setup, and equipment]”; “The price is [amount] per guest / total, excluding [items]”; “Approve by [date] to confirm [availability or next step].” This prevents a draft from quietly turning a tentative menu or date into a promise.
Staff briefing: turn procedures into shift-ready actions
Prompt: “Create a short pre-opening briefing for front-of-house and kitchen roles from the approved procedures below. Show who does what, when to escalate an issue, and a final knowledge check. Do not add unapproved safety or recipe instructions.”
Sample sequence: “Before doors open, each station checks [approved list]”; “Hosts confirm [reservation and waitlist steps]”; “Servers describe [approved menu facts and allergens]”; “Kitchen and floor teams escalate [defined issue] to [role]”; “At close, record [approved handover items].” Have the manager test the slides against the actual shift checklist before training staff.
Operating review: turn a report into an action plan
Prompt: “Summarize the attached POS, labor, and inventory reports for [period], comparing them with [comparison period]. Use consistent definitions, identify trends without claiming causes the data cannot establish, and end with an action, owner, and review date.”
Illustrative case, figures are hypothetical: A weekly review might show net sales of $24,100 versus $22,800 in the comparable week, while labor hours rose from 310 to 338. A useful slide title is “Sales rose, but labor hours grew faster”; the chart should show both periods and the source reports. The slide should not claim labor caused a margin decline unless payroll and cost data support that conclusion. The manager can then assign a follow-up to check schedule coverage and channel mix the next week.