Ecommerce marketers, founders, and operators often need a polished deck before a campaign, product launch, or quarterly review is fully mapped out. AI can help organize notes and reports into a clear story—but the useful output is a decision-ready deck, not a stack of attractive slides.
This guide includes slide-by-slide structures for four common ecommerce goals, copy-and-adapt prompts, and two practical layout blueprints. A worked, explicitly illustrative campaign example shows how to turn a metric into a chart title and recommendation. Use an AI presentation generator for a first draft, then apply approved brand assets and check the evidence. For a broader comparison of tools, see these AI presentation makers.
Three Ecommerce Slides Built from Explicit Data
All figures below are synthetic. The first chart uses the source table shown underneath; the cohort and promotion are separate teaching examples, not benchmarks or results from a live store.
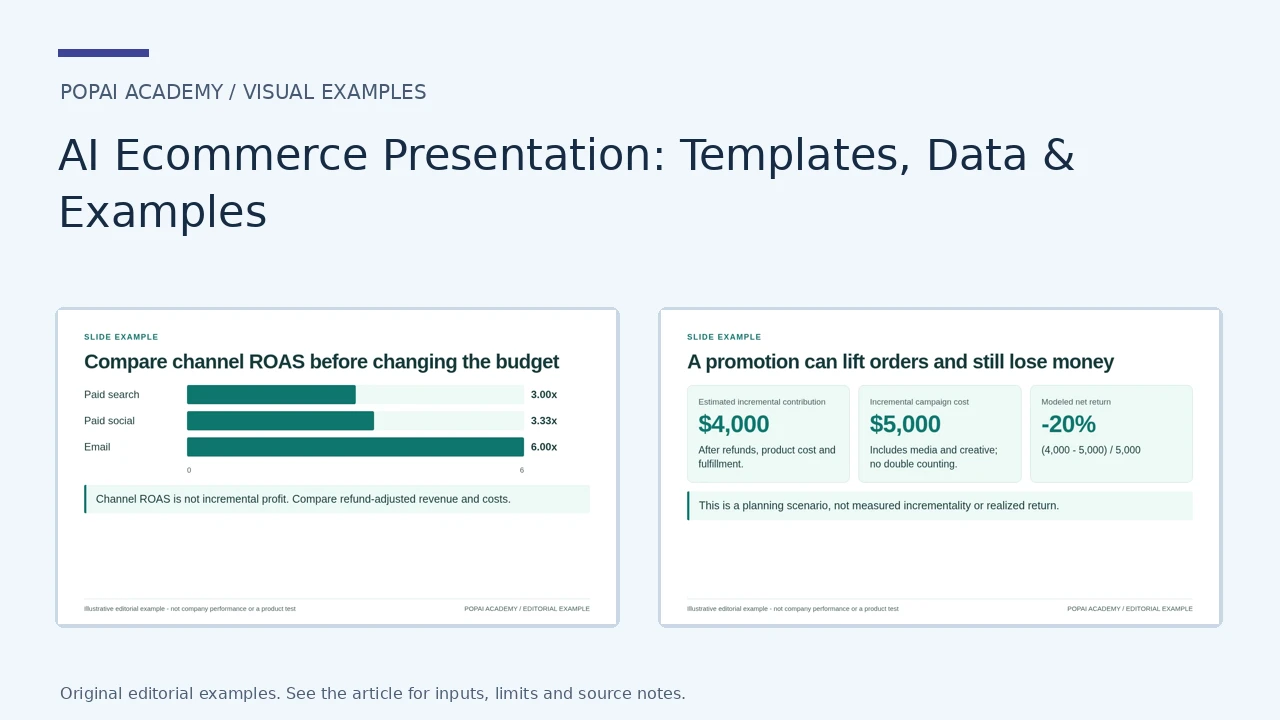
Open full-size examples and editable HTML layoutsCompare channel ROAS before changing the budget
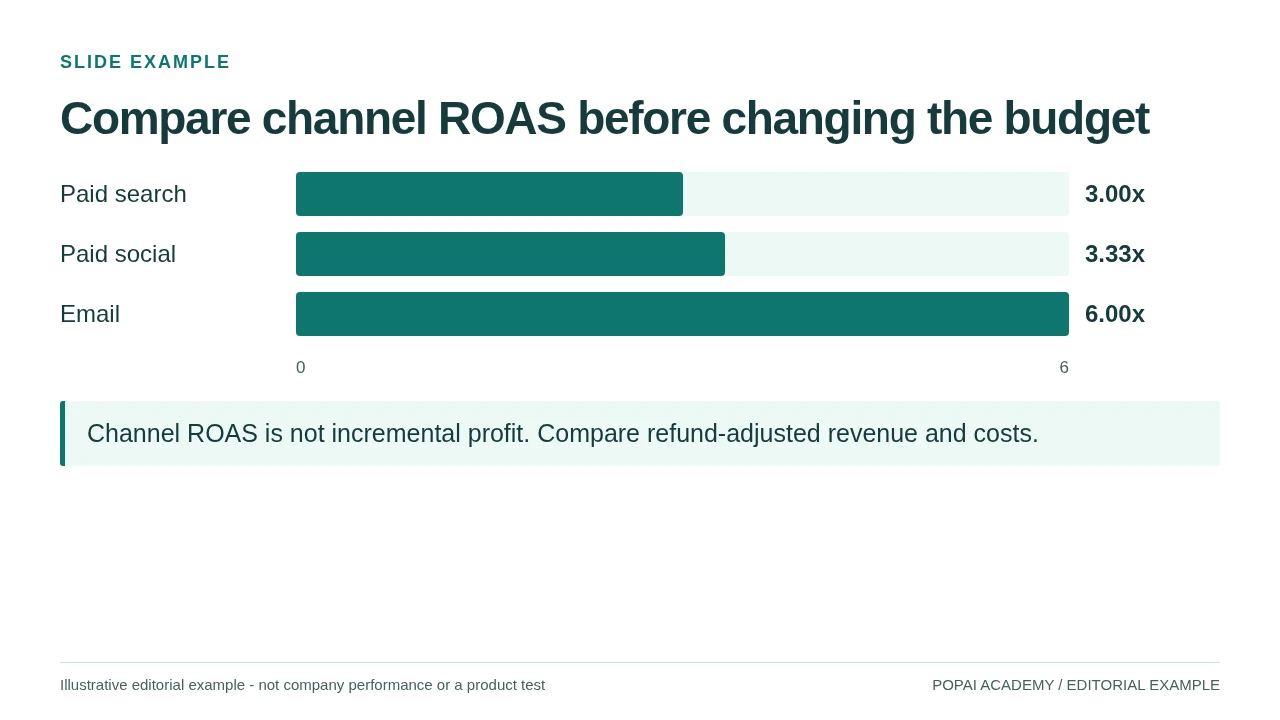
May illustrative data: ad/email spend 4,000 / 3,000 / 500; attributed net revenue 12,000 / 10,000 / 3,000.
Read or copy the slide content
Paid search
3.00x
Paid social
3.33x
Email
6.00x
0
6
Channel ROAS is not incremental profit. Compare refund-adjusted revenue and costs.
Prompt for Compare channel ROAS before changing the budget
Use the May source table to show channel ROAS. Keep store conversion separate. Show attribution as a model, not causal lift.
January cohort: 30 of 100 customers ordered again
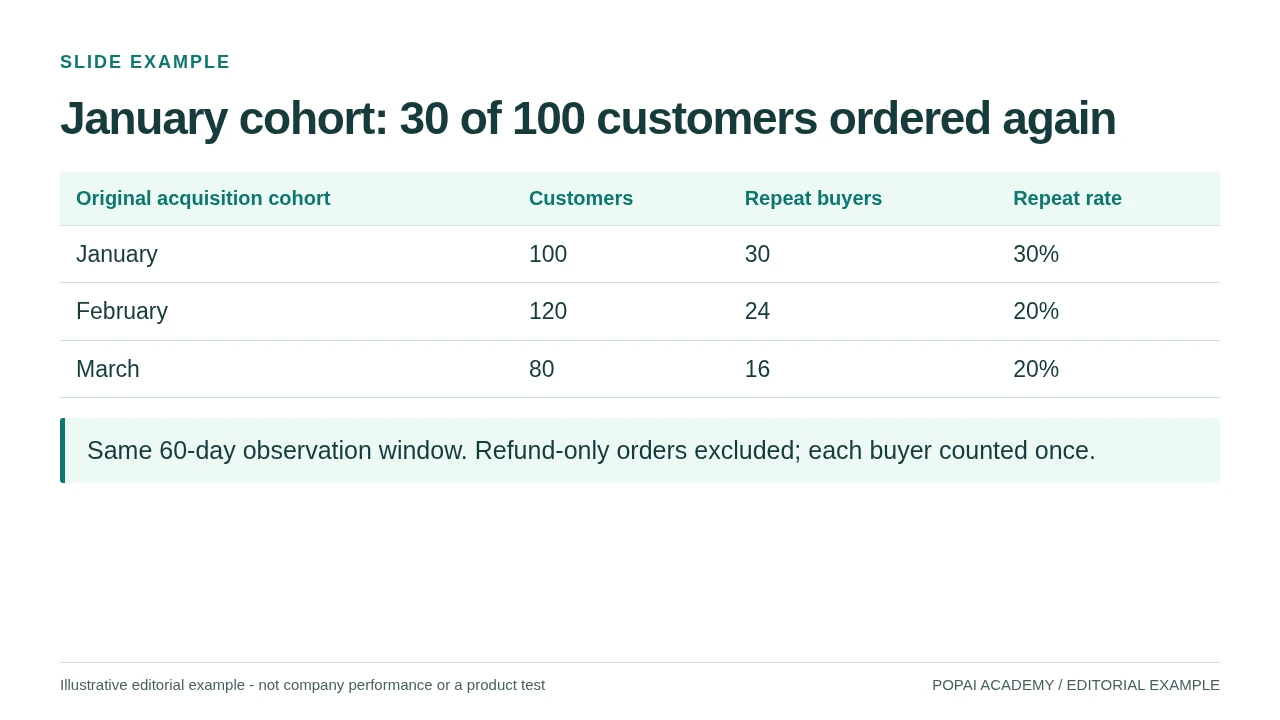
Fictional repeat-purchase cohorts; do not compare unfinished cohorts or divide by repeat orders.
Read or copy the slide content
Original acquisition cohort
Customers
Repeat buyers
Repeat rate
January
100
30
30%
February
120
24
20%
March
80
16
20%
Same 60-day observation window. Refund-only orders excluded; each buyer counted once.
Prompt for January cohort: 30 of 100 customers ordered again
Create a slide with the purpose "January cohort: 30 of 100 customers ordered again". Use these approved source fields or replace the illustrative inputs before use: Original acquisition cohort Customers Repeat buyers Repeat rate January 100 30 30% February 120 24 20% March 80 16 20% Same 60-day observation window. Refund-only orders excluded; each buyer counted once.. Preserve labels, units, source notes and any uncertainty. Do not add results, claims, customers or capabilities. Suggest a readable layout and keep the output editable in the chosen tool.
A promotion can lift orders and still lose money
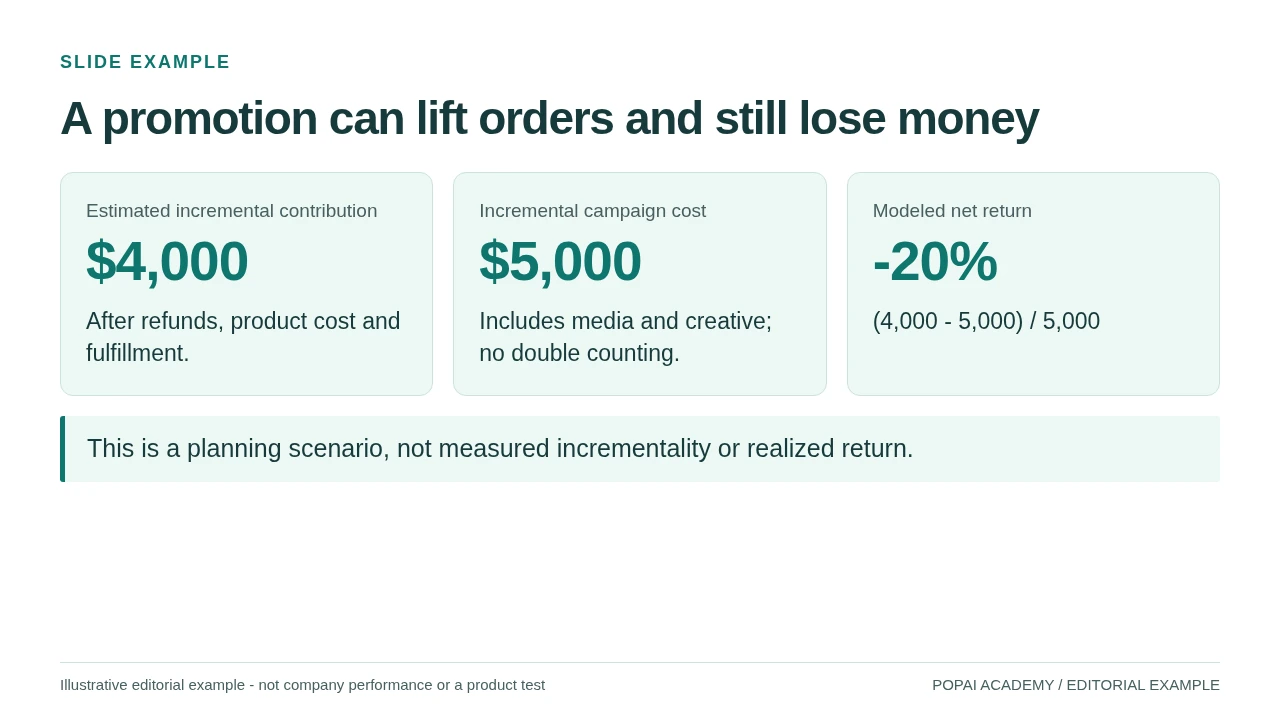
A fictional promotion ROI calculation with its cost boundary exposed.
Read or copy the slide content
Estimated incremental contribution
$4,000
After refunds, product cost and fulfillment.
Incremental campaign cost
$5,000
Includes media and creative; no double counting.
Modeled net return
-20%
(4,000 - 5,000) / 5,000
This is a planning scenario, not measured incrementality or realized return.
Prompt for A promotion can lift orders and still lose money
Create a slide with the purpose "A promotion can lift orders and still lose money". Use these approved source fields or replace the illustrative inputs before use: Estimated incremental contribution $4,000 After refunds, product cost and fulfillment. Incremental campaign cost $5,000 Includes media and creative; no double counting. Modeled net return -20% (4,000 - 5,000) / 5,000 This is a planning scenario, not measured incrementality or realized return.. Preserve labels, units, source notes and any uncertainty. Do not add results, claims, customers or capabilities. Suggest a readable layout and keep the output editable in the chosen tool.
AI Ecommerce Presentation Structure for Common Goals
Set the decision, audience, and meeting length before choosing slides.
A leadership audience usually needs the result, trade-offs, and a decision; a marketing team needs channel details, owners, and execution steps; investors need a clear separation between demonstrated traction and future assumptions. A 6–8-slide meeting deck can carry the main story, with metric definitions, channel breakouts, and detailed forecasts in an appendix. Keep the approval request or next action visible rather than burying it on the final page.
Marketing proposal or campaign plan: 8 slides
- Decision and objective: State the requested approval and the business outcome, such as acquiring first-time buyers within a set budget.
- Audience and evidence: Define the target segment and show the customer research or sales evidence behind the opportunity.
- Offer and creative idea: Present the offer, message, and one example of the campaign concept.
- Channel sequence: Show how email, paid media, organic content, and partners work together over time.
- Budget and assumptions: Separate confirmed costs from estimates; note inventory, discount, and production assumptions.
- Measurement plan: Define the primary KPI, comparison period, attribution approach, and reporting owner.
- Risks and mitigations: Cover stock, margin, timing, creative approvals, and operational dependencies.
- Approval and next steps: Name the decision-maker, deadline, and immediate actions.
Quarterly business review: 6–8 slides
Lead with the quarter’s outcome and the decision needed, then show the goal-versus-actual view, revenue and conversion trend, channel or product drivers, customer retention, operational risks, and prioritized actions. Put detailed SKU, campaign, and regional breakouts in an appendix. A leadership version should emphasize business impact; a working-session version can add channel owners and diagnostic detail.
Product launch: 7–9 slides
Build the story from customer problem to product value, proof points, offer and merchandising, launch calendar, channel plan, inventory and fulfillment readiness, success measures, and approval request. Keep product claims tied to approved research or specifications. If the launch has not happened yet, label targets as forecasts and show the assumptions behind them; do not present targets as early results.
Investor update: 8–10 slides
Cover the customer problem, product, market opportunity, business model, traction, unit economics, growth plan, risks, and the specific ask. Mark actuals, estimates, and forecasts distinctly, including the period and assumptions for each. Put detailed cohort tables and sensitivity analyses in an appendix. A chart of past orders is evidence of traction; a projected growth curve is a forecast, not proof that the growth will occur.
Same source, different story: Suppose a campaign report shows more first orders but lower contribution margin after discounts. Marketing may need a channel and creative test plan; leadership needs the margin trade-off and a decision on future discount depth; investors may need the result placed in the context of customer acquisition cost and repeat behavior. The source facts stay the same—the headline and supporting detail change with the audience.
Make each slide title a takeaway, not a category label. “Paid social brought in more first orders, but at lower margin” is more useful than “Channel Performance”—provided the data supports both parts.
Choose Ecommerce Metrics That Make the Story Clear
A chart earns its space when it clarifies a decision, change, or trade-off.
Choose metrics that connect to the deck’s objective and define them before generating charts. For example, specify whether conversion rate means orders divided by sessions or users, and whether orders are net of cancellations. Define repeat purchase rate by cohort and observation window—for example, the share of customers in a first-order cohort who placed another order within 90 days. For inventory turnover, state whether the calculation uses cost of goods sold divided by average inventory value, and name the period.
| Question | Metric and definition to state | Useful visual and decision |
|---|---|---|
| Is the store converting more visits? | Orders ÷ sessions, with the same analytics definition and date range | Line chart across comparable periods; investigate a meaningful change before changing the funnel |
| Which channel reports efficient revenue? | Attributed revenue ÷ ad spend; include attribution window and platform | Bar chart with spend and attributed revenue beside ROAS; decide where to investigate, not where to scale automatically |
| Are customers returning? | Customers with a repeat order ÷ customers in a defined first-order cohort | Cohort view by elapsed time; compare like-for-like cohorts before changing retention investment |
| Is stock moving at a healthy pace? | Cost of goods sold ÷ average inventory value, with period and inventory basis | Trend by category plus stockout or aging-stock context; inform purchasing and markdown decisions |
Illustrative example, not a benchmark: A store records 12,000 sessions and 300 completed orders in May, giving a session conversion rate of 2.5% (300 ÷ 12,000). In April, the same report definition showed 2.2%. A conclusion-led slide could say, “Conversion rose 0.3 percentage points month over month”; the accompanying recommendation might be to check whether the lift came from a specific landing page or offer before rolling it out sitewide. If cancellations or returns are material, show net sales or net orders separately rather than implying that completed checkouts equal retained revenue.
ROAS is attributed revenue divided by ad spend, but it is not the same as incremental impact or profit. Platform-reported revenue can overlap across channels, and gross revenue does not account for product costs, discounts, returns, or fulfillment. State the source and attribution window; where the decision depends on profitability, pair ROAS with contribution margin or another agreed profit measure. A higher AOV and lower conversion rate in the same period also do not prove that a promotion caused either change—show the comparison and describe the cause as a hypothesis unless a test supports it.
If a source does not contain a metric, label it unavailable. If you include an estimate, mark it as an assumption and state the method and owner. This keeps a useful but incomplete story more credible than a dashboard that mixes dates or definitions.
Copy-and-Adapt AI Ecommerce Presentation Prompts
Ask for a slide outline before a designed deck so you can correct the story early.
Include the audience, decision, reporting period, approved source material, desired length, and visual direction. Ask the tool to distinguish source facts from assumptions and to flag conflicting figures instead of silently choosing one. Review the outline first; only then ask for charts and slide copy.
Quarterly performance review prompt: “Act as an ecommerce business analyst. Draft an 8-slide outline for a leadership review of [quarter and year]. The decision needed is [decision]. Use only the attached approved reports. For each proposed slide, return a conclusion-led title, the evidence required, source file and reporting period, and one implication or question. Include goal versus actual, revenue and conversion trends, channel performance, customer retention, operational risks, recommendations, and owners. If sources conflict, show both figures and flag the discrepancy for review. Separate actuals from estimates. Do not infer causation. After I approve the outline, draft concise slide copy in [brand style].”
Product launch proposal prompt: “Create a 7-slide proposal for [product] for [customer segment], to be presented to [decision-maker]. First return a slide-by-slide outline with a conclusion-led title and the evidence needed on each slide. Cover customer need, approved product proof points, offer, channel sequence, budget assumptions, launch KPIs, stock and fulfillment risks, and the approval request. Mark unsupported claims ‘needs confirmation’ and label targets as forecasts, not results. Leave space for approved product photography; do not create product features or testimonials.”
Marketing campaign proposal prompt: “Prepare a 6-slide campaign recommendation for [audience and product]. The requested decision is [budget/approval]. Use the supplied customer and sales evidence to compare [campaign options]. Show the target segment, insight, offer, channel roles, budget, KPI definition, measurement window, risks, and next steps. Return the outline first. Separate known costs from assumptions and identify the source and owner for each key number. Recommend a test if the evidence does not support a confident forecast.”
Investor update prompt: “Draft a 9-slide investor update for [period]. Return an outline before drafting. Cover customer problem, product, business model, actual traction, unit economics, growth priorities, risks, and [specific ask]. Label each figure actual, estimate, or forecast and include its period, definition, and source. Do not treat a forecast as a result or market-size estimate as obtainable revenue. Put detailed cohorts and forecast assumptions in an appendix; flag missing or conflicting evidence.”
Illustrative prompt input and output: Input: “May sessions 12,000; completed orders 300; April conversion 2.2%; same store analytics definition; campaign discounts increased in May.” A useful outline item might be: “Conversion reached 2.5% in May; test whether the lift persists without the deeper discount.” The title reports the calculation, while the second clause presents a testable question—not an unsupported causal claim.
Iterate in focused passes: approve the outline, check the evidence and definitions, then refine slide length and visual hierarchy. If you are using PopAi AI Presentation, check the current product page for the workflow and options available to your account; capabilities and export behavior can change. Regardless of tool, treat generated summaries as drafts and compare important figures with the source reports.
Templates and Visual Direction for Ecommerce Slides
Use a repeatable layout that gives the conclusion and its evidence more space than decoration.
These two slide blueprints can be recreated in a presentation template. They are layouts, not pre-populated benchmark data: replace the bracketed fields with your approved figures and assets.
- Channel-performance slide: Put a one-sentence conclusion across the top. Use the left two-thirds for a horizontal bar chart comparing channels on one defined measure; place spend and attributed revenue beside the bars so ROAS is not shown in isolation. Use the right third for two short callouts: the strongest supported finding and the decision or test it suggests. Add a compact footer with source, period, attribution window, and metric definition.
- Product-launch slide: Give one side to an approved product image and the other to the customer problem, product benefit, and substantiated proof point. Add a narrow bottom strip for launch date, offer, primary KPI, and approval needed. Do not fill the slide with multiple product images if they make the claim or requested decision harder to find.
Use actual logos, approved brand colors, and product images with confirmed rights and details. Use charts for comparisons or trends and product photography to explain the offer or product—not as a substitute for evidence. Check text and chart contrast, avoid relying on color alone to distinguish series, and keep labels large enough to read on a projected screen. A theme is a starting point: simplify layouts that crowd the conclusion.
Design should make the evidence easier to scan. If a visual treatment competes with the conclusion, simplify the slide before adding another decorative element.
A Safer Workflow for Source Data and Final Slides
Keep a traceable path from each important slide claim back to its source.
Before drafting, make a small source register for key figures: slide or claim, source file and report name, reporting period, metric definition, owner, and whether the value is actual, estimated, or forecast. Keep source data distinct from AI-generated summaries and assumptions. For a deck that needs only aggregate performance, customer names, email addresses, order IDs, and other customer-level details are usually unnecessary; remove or aggregate them before sharing. Check your organization’s rules and the presentation tool’s current data-handling terms before uploading sensitive material.
- Prepare the brief: Set the audience, objective, meeting length, slide count, and decision required.
- Register the evidence: Record approved sources, dates, metric definitions, currency, and owners; identify the report that governs if sources disagree.
- Generate and approve the outline: Remove irrelevant sections and check that every slide helps answer the brief before drafting full slides.
- Verify key claims: Recalculate headline ratios and totals against the source register; check periods, units, labels, and product details.
- Refine and export: Improve layouts and chart choices, then inspect the exported file on the device and software used for the presentation.
Illustrative reconciliation: An ad platform reports $24,000 in attributed revenue for a campaign, while the store’s order report shows $21,500 during the same dates. These figures may use different attribution windows, order scopes, or return and cancellation treatment; neither should be silently substituted for the other. Label the platform figure as platform-attributed, state its window, and show the store figure separately if it answers a different question. Ask the report owners to reconcile the difference before presenting a single blended number.
For each key chart, compare displayed values with the underlying report and check that the scale does not exaggerate or conceal the change. A bar chart starting above zero can magnify a small difference; label the axis clearly or choose another view. Keep detailed definitions and supporting tables in an appendix or reference file so the main narrative stays readable.
Privacy reminder: Share the minimum data needed to build the deck. Prefer aggregated totals over customer-level records, follow your organization’s approval process, and confirm the tool’s data retention and access terms before uploading confidential material.
Edit, Share, and Check Your Ecommerce Deck
Run separate checks for the story, the visuals, and the exported file.
- Content: Confirm the headline answers the brief, actuals and forecasts are distinct, source notes are present, and the requested decision is explicit.
- Visuals and accessibility: Check legibility at presentation size, contrast, chart labels, image quality, and that color is not the only way information is conveyed.
- File compatibility: Open the exported file in the presentation software you will use. Check fonts, line breaks, cropped images, chart data and labels, hyperlinks, and speaker notes. Editable exports may not preserve every object or layout exactly.
Tool-specific editing and export options can vary by product version and account. Consult the current product documentation before relying on a particular chart-editing, file-format, or collaboration capability. If you use PopAi, check its current product information and test a representative slide in your own workflow before building a time-critical deck around an export feature.
A strong ecommerce presentation makes clear what happened, what the evidence can and cannot establish, and what action is being requested. Keep the main deck focused; move supporting detail—not uncertainty—into the appendix or notes.
Source Table to Channel Slide: The Working
The first chart uses the following synthetic May source table. Currency is USD. A session is a store visit under the same analytics definition; an order is a completed order, not a buyer. These are assigned channel counts for this teaching dataset, not proof of an attribution method. Net attributed revenue is after recorded discounts and refunds in this example.
| Channel | Sessions | Orders | Spend | Net attributed revenue | ROAS |
|---|---|---|---|---|---|
| Paid search | 6,000 | 150 | $4,000 | $12,000 | 3.00x |
| Paid social | 5,000 | 125 | $3,000 | $10,000 | 3.33x |
| 1,000 | 25 | $500 | $3,000 | 6.00x | |
| Total | 12,000 | 300 | $7,500 | $25,000 | 3.33x blended |
Store conversion is 300 / 12,000 = 2.5%. ROAS is attributed revenue divided by the matching spend; it is not profit or incremental lift. The illustrative attribution rule is last assigned eligible click within seven days, with no view-through credit. Use your approved model instead and do not add overlapping platform totals. For real reporting, freeze a dated extract, specify how later refunds are handled and reconcile the ledger before drawing conclusions.
The cohort slide counts unique first-time buyers who make a second valid purchase within 60 days. A completed 60-day window is required for every cohort. The promotion slide is a separate model: estimated incremental contribution of $4,000 less $5,000 of incremental campaign cost produces a -20% modeled return. Do not label that return as observed without a design that estimates incrementality.