Marketing design is most useful when a reader can distinguish the conclusion from the measurement behind it. Start with approved campaign numbers, then redesign the KPI, attribution and creative-test slides. Keep the metric scope, denominator and source close to the claim instead of hiding them in a distant appendix.
Marketing Design Examples: KPI, Attribution and A/B Creative
Read the numbers and their scope as part of the design. The same synthetic data appears before and after; a cleaner slide does not establish attribution, statistical significance or incremental return.
Open full-size examples and editable HTML layoutsDesign the campaign dashboard around a decision
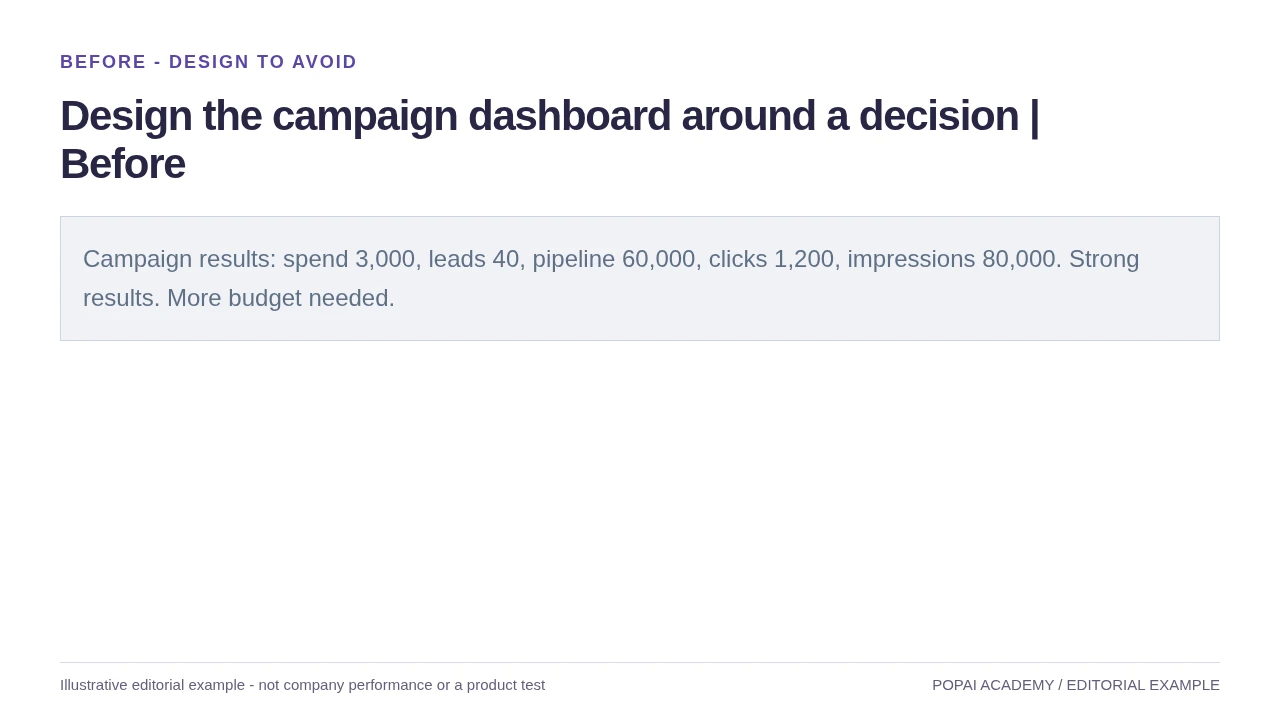
Before: Highlight the decision metric; do not infer ROI from pipeline.
Read or copy the slide content
Campaign results: spend 3,000, leads 40, pipeline 60,000, clicks 1,200, impressions 80,000. Strong results. More budget needed.
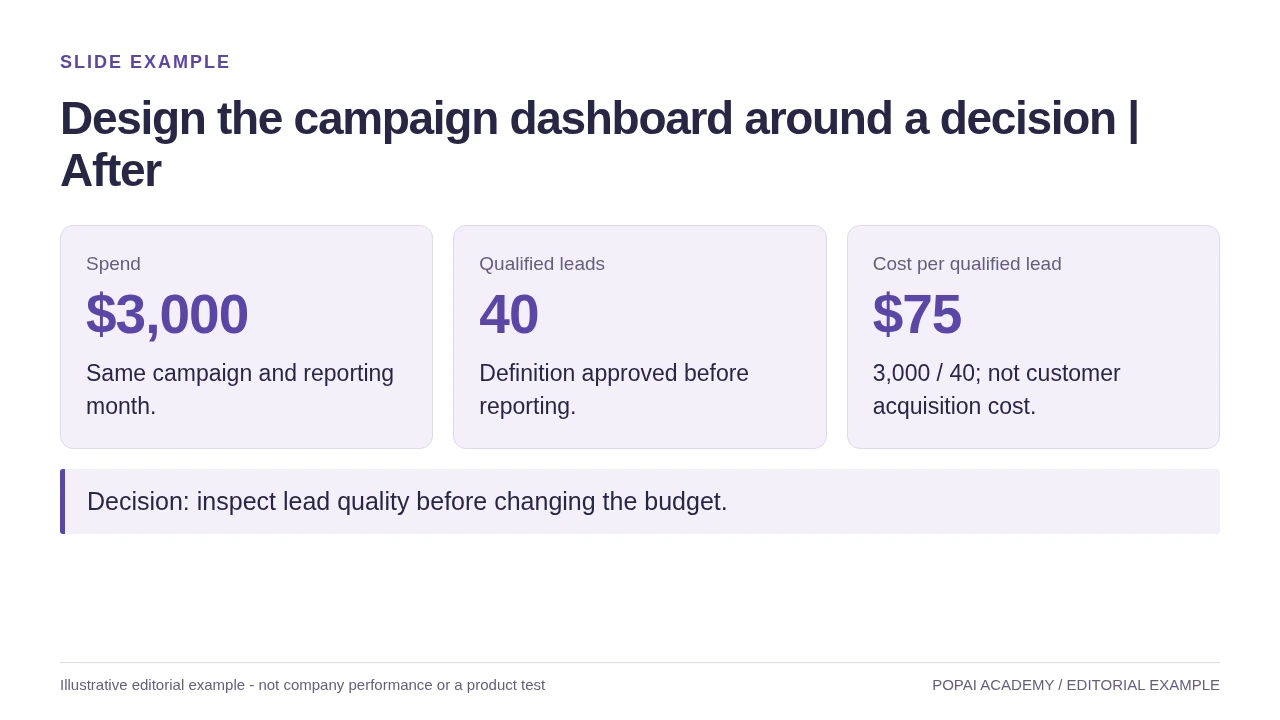
After: Highlight the decision metric; do not infer ROI from pipeline.
Read or copy the slide content
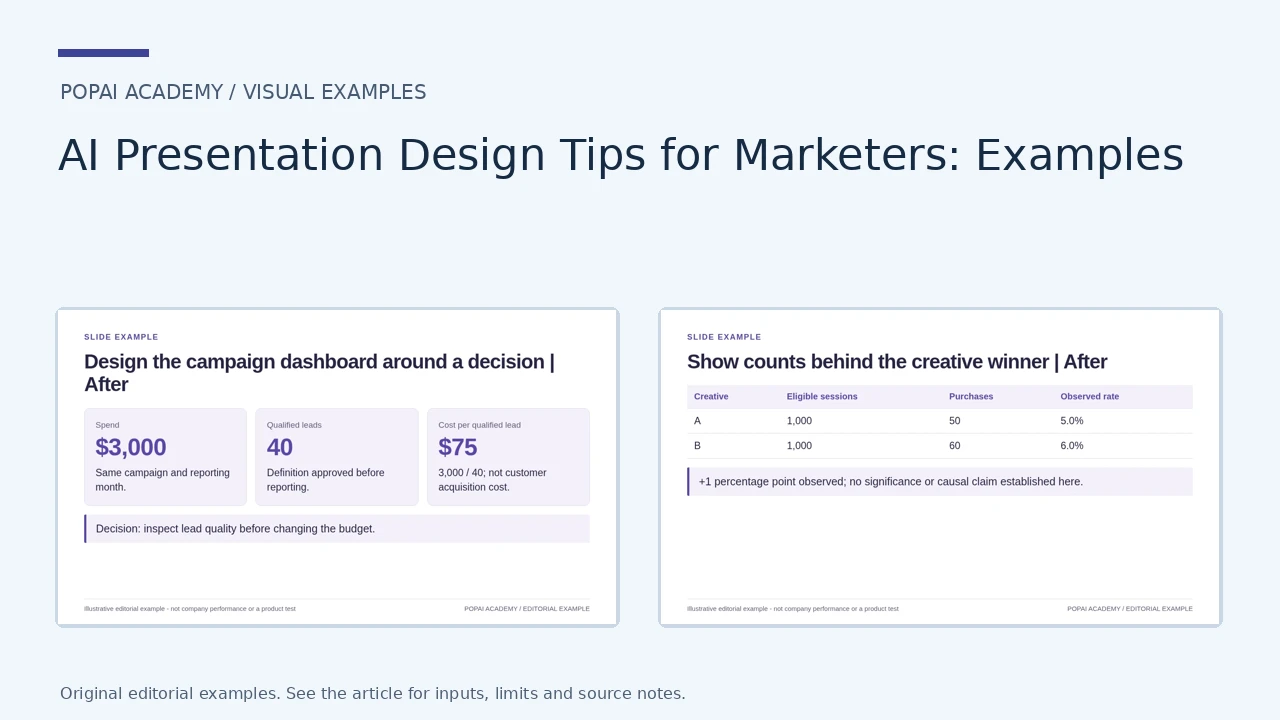
Spend
$3,000
Same campaign and reporting month.
Qualified leads
40
Definition approved before reporting.
Cost per qualified lead
$75
3,000 / 40; not customer acquisition cost.
Decision: inspect lead quality before changing the budget.
Prompt for Design the campaign dashboard around a decision
Create a slide with the purpose "Design the campaign dashboard around a decision | After". Use these approved source fields or replace the illustrative inputs before use: Spend $3,000 Same campaign and reporting month. Qualified leads 40 Definition approved before reporting. Cost per qualified lead $75 3,000 / 40; not customer acquisition cost. Decision: inspect lead quality before changing the budget.. Preserve labels, units, source notes and any uncertainty. Do not add results, claims, customers or capabilities. Suggest a readable layout and keep the output editable in the chosen tool.
Put measurement scope next to the chart
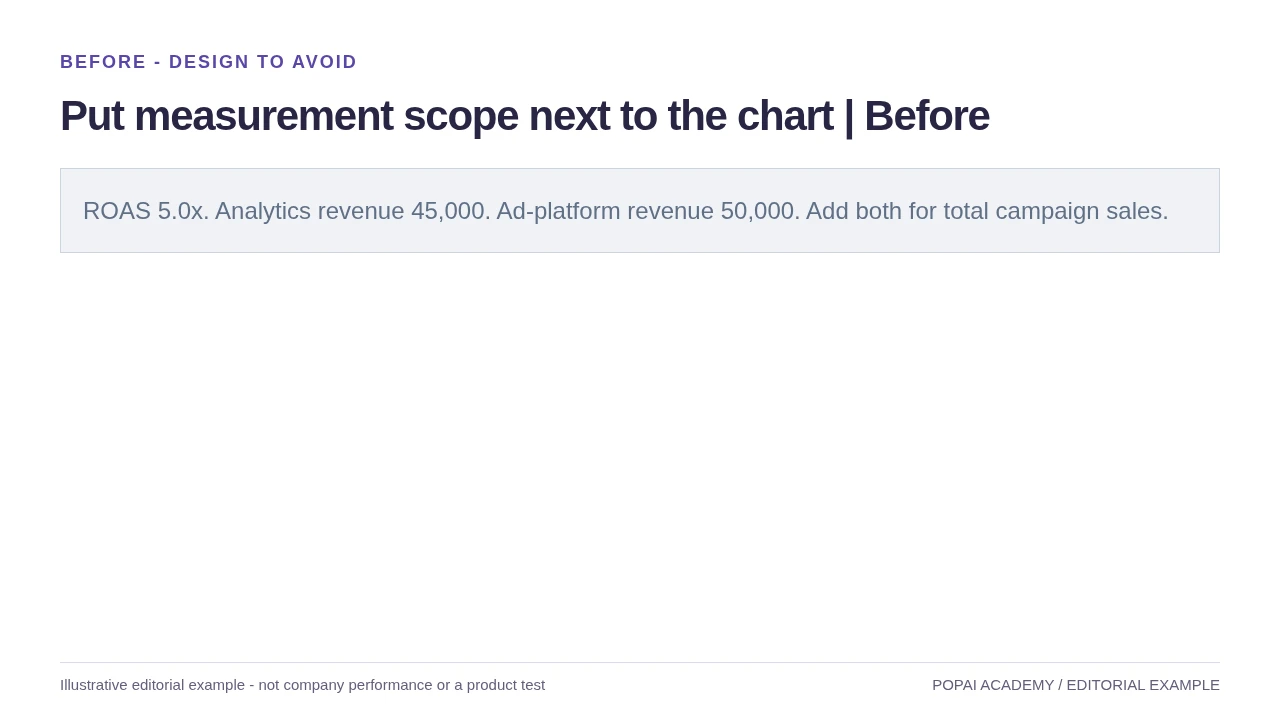
Before: Show definitions beside the numbers; incompatible scopes should not share a single total.
Read or copy the slide content
ROAS 5.0x. Analytics revenue 45,000. Ad-platform revenue 50,000. Add both for total campaign sales.
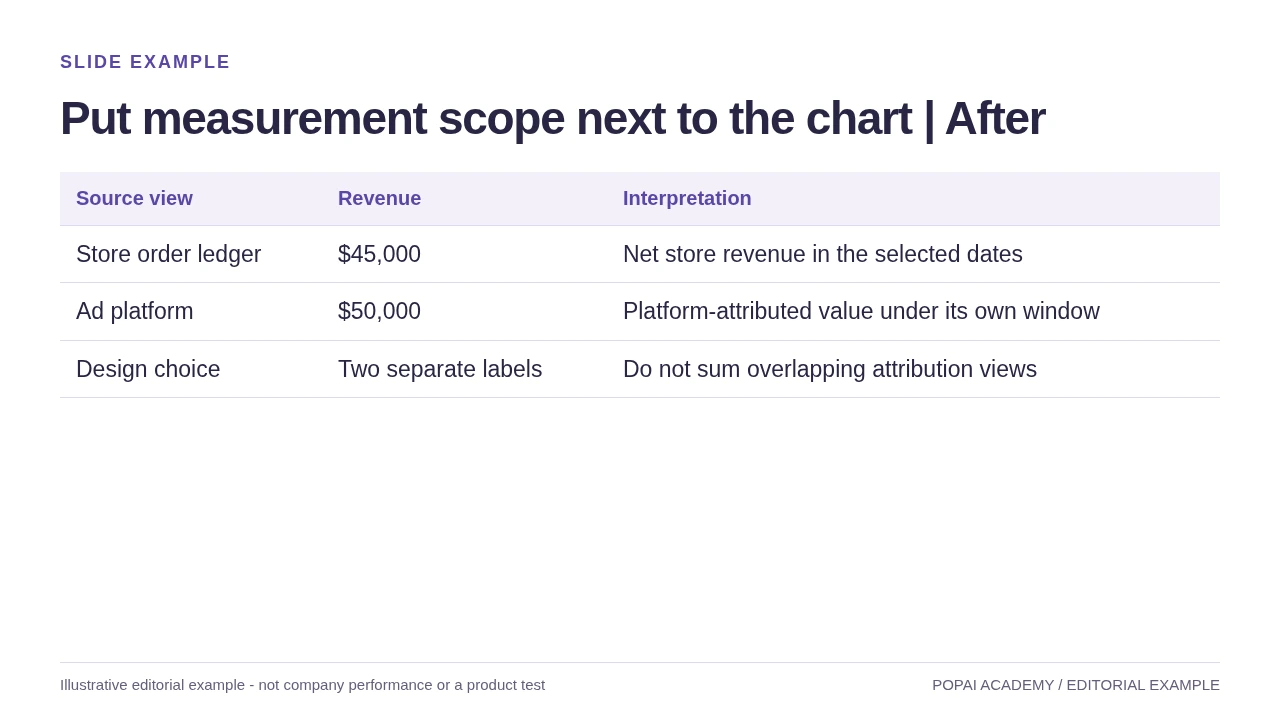
After: Show definitions beside the numbers; incompatible scopes should not share a single total.
Read or copy the slide content
Source view
Revenue
Interpretation
Store order ledger
$45,000
Net store revenue in the selected dates
Ad platform
$50,000
Platform-attributed value under its own window
Design choice
Two separate labels
Do not sum overlapping attribution views
Prompt for Put measurement scope next to the chart
Create a slide with the purpose "Put measurement scope next to the chart | After". Use these approved source fields or replace the illustrative inputs before use: Source view Revenue Interpretation Store order ledger $45,000 Net store revenue in the selected dates Ad platform $50,000 Platform-attributed value under its own window Design choice Two separate labels Do not sum overlapping attribution views. Preserve labels, units, source notes and any uncertainty. Do not add results, claims, customers or capabilities. Suggest a readable layout and keep the output editable in the chosen tool.
Show counts behind the creative winner
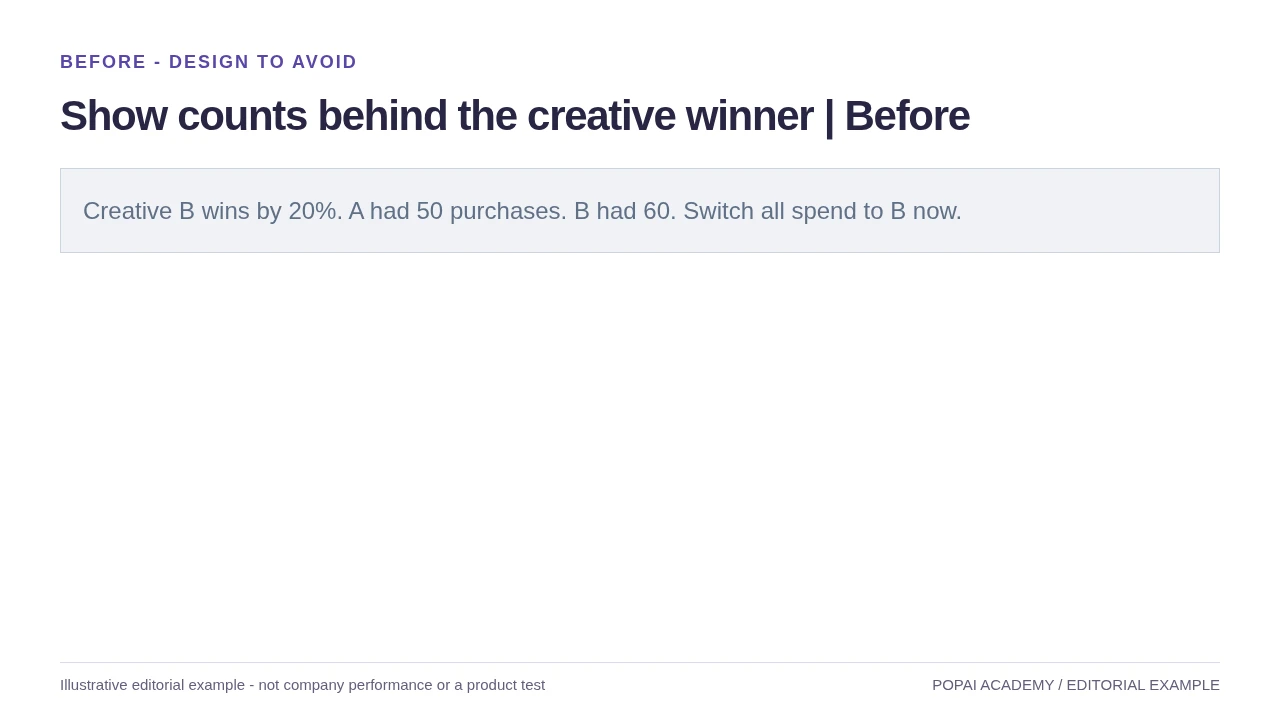
Before: Use the same observation window and disclose uncertainty; these are synthetic counts.
Read or copy the slide content
Creative B wins by 20%. A had 50 purchases. B had 60. Switch all spend to B now.
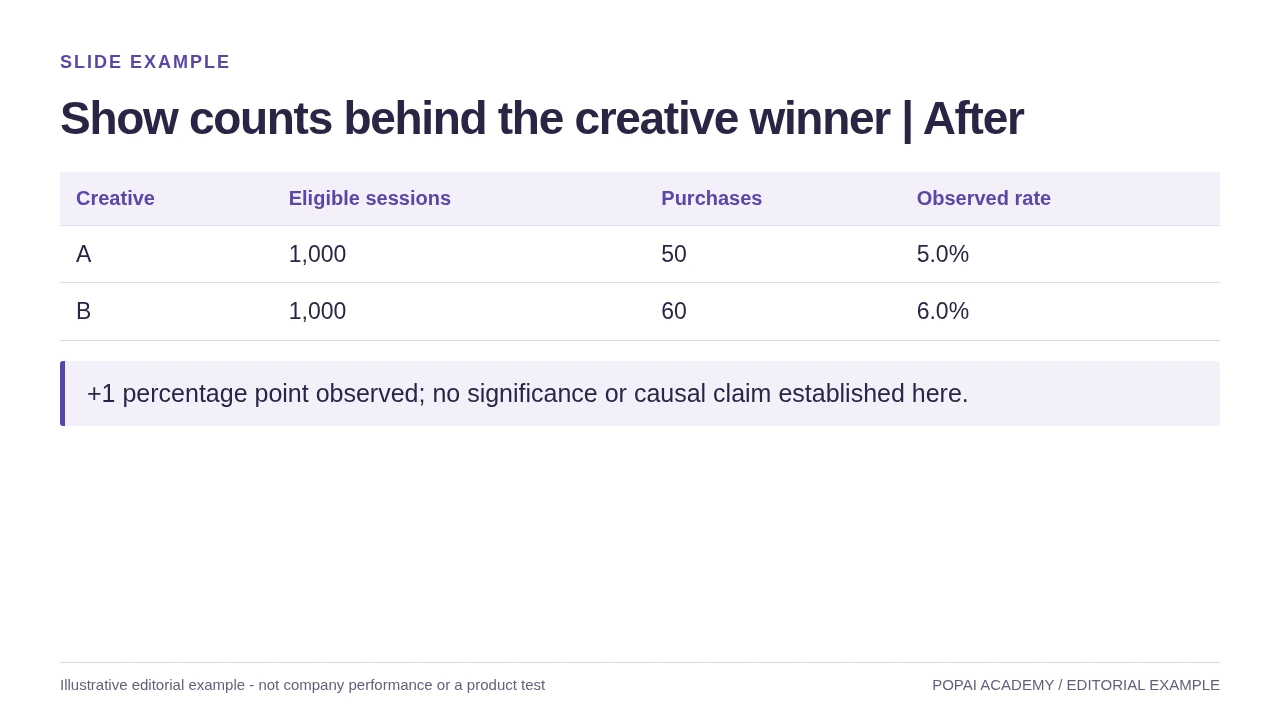
After: Use the same observation window and disclose uncertainty; these are synthetic counts.
Read or copy the slide content
Creative
Eligible sessions
Purchases
Observed rate
A
1,000
50
5.0%
B
1,000
60
6.0%
+1 percentage point observed; no significance or causal claim established here.
Prompt for Show counts behind the creative winner
Create a slide with the purpose "Show counts behind the creative winner | After". Use these approved source fields or replace the illustrative inputs before use: Creative Eligible sessions Purchases Observed rate A 1,000 50 5.0% B 1,000 60 6.0% +1 percentage point observed; no significance or causal claim established here.. Preserve labels, units, source notes and any uncertainty. Do not add results, claims, customers or capabilities. Suggest a readable layout and keep the output editable in the chosen tool.
Build a slide sequence that answers the audience’s question
Give each slide a job in the argument, then choose a format that makes its evidence easy to understand.
For the leadership test pitch above, a concise sequence could be: “Our current message attracts clicks but not enough qualified leads” (problem and evidence); “Two message variants will test whether clearer use cases improve lead quality” (proposal and test design); and “Approve $30,000 for six weeks; scale only if the qualified-lead threshold is met” (decision and next step). Each headline advances the same argument rather than merely naming a topic.
Choose the layout that makes the point easiest to check
- Use a headline and one proof point for an audience insight.
- Use a process diagram for a customer journey or launch sequence.
- Use a comparison layout when the audience must choose between options; state the criteria used to compare them.
- Use a chart for a trend or quantitative comparison, with the period and units visible.
Move background that does not change the decision—such as a full channel inventory or detailed methodology—to an appendix. Keep caveats on the main slide when they materially change how a result should be interpreted. A live deck can rely more on speaker explanation; an emailed deck needs definitions, context, and source notes on the slides themselves.
When using PopAi AI Presentation, or another presentation tool, inspect the outline before polishing layouts. A generated sequence is a proposal: the marketer still decides which evidence belongs in the argument and what should be moved to an appendix.
Slide test: can a reader state the headline’s claim and find the evidence for it without searching through unrelated text?
Create a visual system that holds up across the whole deck
A theme is only a starting point; check how it handles real content, not just its title slide.
Use a small palette, consistent typography, and repeatable spacing. Then test the theme on four different slides: a title, a dense data slide, a comparison, and an image-led concept slide. Check that titles remain distinct from body text, chart labels are readable, images feel like they belong together, and the layout still works when a headline wraps.
If a brand color has poor contrast, keep it for accents rather than small text or essential chart labels. Use a more legible approved color for those elements and preserve the brand color elsewhere. For ordinary text, WCAG 2.2 AA calls for a contrast ratio of at least 4.5:1; large text has a 3:1 minimum. Check the actual color pair with a contrast checker rather than judging it by eye. For a standard 16:9 presentation viewed in a room, body text around 18–24 pt is a practical starting range, but test it at the intended viewing distance.
Check readability, image fit, and brand exceptions
- Do not use color alone to distinguish chart series; add direct labels, symbols, or line styles.
- Enlarge footnotes and chart labels until they are legible in the actual presentation setting.
- Use images that accurately represent the product, audience, and use case. Check factual details, usage rights, and whether a generated image could be mistaken for a real customer or product.
- Add captions to video and meaningful alternative text to images in the final format when supported.
Preview the deck at its intended size and, for important presentations, ask someone who did not build it to read a few slides. If they cannot identify the point quickly, simplify the layout or make the label more explicit.
Make campaign charts and claims reproducible
A defensible chart shows the measure, denominator, period, comparison, and source behind its takeaway.
Illustrative example—not campaign results: Suppose a team reports that weekly leads rose from 100 to 120 after increasing paid-social spend from $10,000 to $15,000. “Leads rose 20%” is accurate for volume, but incomplete for a budget decision: cost per lead changed from $100 to $125. If qualified leads fell from 5% to 4% of leads, the qualified-lead count would be 5 versus 4.8 per week, approximately flat. The extra volume does not, by itself, show that the campaign became more efficient or that the spend increase caused the change.
For this comparison, a small table or paired bars can show spend, total leads, qualified-lead rate, and cost per lead side by side. A useful source note would name the reporting system, date range, attribution window, and extraction date—for example: “CRM and ad-platform exports; 1–7 and 8–14 May 2026; seven-day click attribution; extracted 16 May 2026.” Use a line chart for a time trend, bars for category comparisons, and a table when readers need to verify several exact values.
Data review: Reconcile totals to the approved source, confirm that periods and definitions match, and show the denominator for rates. If a sample is small, data is incomplete, or attribution settings changed, disclose that limitation beside the claim. Describe an observed relationship as an association unless the measurement design supports a causal conclusion.
Keep the source file and calculation notes with the deck so another reviewer can reproduce the result. If a chart is edited in a presentation tool, check the displayed values and labels against that source after editing; do not assume a visually plausible chart is numerically correct.
Use a quality gate before sharing the deck
Assign the right checks to the right reviewer, and block delivery when a material claim or file issue remains unresolved.
Run four passes in order: the marketer checks the story and audience fit; the data or subject-matter owner verifies claims; a designer or accessibility reviewer checks legibility; then the delivery owner tests the final file. For a low-stakes internal draft, some roles may be combined. For a customer-facing deck with performance or product claims, keep factual approval with the relevant subject-matter owner.
| Gate and owner | Pass criterion | Block delivery if… |
|---|---|---|
| Story — marketer | The requested action or decision is explicit, and the slides support it. | The deck’s purpose or next step is unclear. |
| Facts — data or subject-matter owner | Figures, dates, quotes, product details, and citations match approved sources. | A material claim is unsupported, inconsistent, or missing its context. |
| Design — designer or accessibility reviewer | Text, charts, contrast, images, and reading order work in the intended setting. | Essential information is unreadable or conveyed by color alone. |
| Delivery — deck owner | Links work, citations are present, and the exported file has been opened and checked. | Fonts, layout, media, or permissions fail in the destination environment. |
For an asynchronous-read test, send the deck to someone outside the project team without presenting it. Ask them to summarize the recommendation and identify its evidence. Check every external link and source note, and record the approver, version, and approval date in the team’s normal system. Keep a final approved file separate from working drafts so reviewers do not mistake an earlier version for the release copy.
Export behavior varies by tool, file, and software version. Open the exported presentation in the software and environment where it will be used; verify text, fonts, spacing, links, and media rather than assuming the export matches the editor. Follow your organization’s tool-approval and data-handling policies before uploading confidential material.
A repeatable AI-friendly workflow for marketing decks
Give each handoff a defined output and a decision gate so a fast first draft does not become a fast route to an unreviewed claim.
- Brief — marketer, about 15 minutes: provide the audience, requested outcome, decision, success measure, and constraints. Output: a one-page brief. Gate: the brief names an owner for the decision.
- Evidence pack — data or subject-matter owner, about 20–45 minutes: supply approved figures, definitions, sources, and usable assets; flag gaps and conflicts. Output: a source list and approved facts. Gate: no unresolved number is presented as confirmed.
- Outline and draft — marketer, about 20–40 minutes: prompt for a slide sequence, review it, then generate the draft. Output: a deck aligned to the brief. Gate: the story and evidence fit before visual polish begins.
- Review and revise — marketer, relevant reviewer, and designer as needed, about 30–60 minutes: check claims, story, accessibility, and layout. Output: an approved version with issues resolved. Gate: the factual owner signs off on material claims.
- Delivery — deck owner, about 10 minutes: test the exported file in its destination, verify links, and record the final version. Output: a usable, approved deck. Gate: no broken media, unreadable content, or open approval issues.
These are planning estimates, not guaranteed production times; complex claims, missing data, or stakeholder disagreements can add substantial review time. For an internal working draft, label unverified content clearly. For a customer-facing deck, do not publish until evidence, permissions, and required approvals are complete.