For a student balancing research, deadlines, and a presentation rubric, AI can help turn notes into a first draft. The hard part is making sure the deck is accurate, readable, properly cited, and reflects what you understand—not just what a tool produced.
Start with the assignment brief, turn its criteria into a slide plan, and use AI only where it helps. For example, a dense slide titled “Survey Results” might become “Most respondents chose option B,” supported by one clearly labeled chart and a source note. The presenter can then explain why that result matters.
Student Slides: Research Question, Results and References
This is one synthetic assignment example. It shows where a question, denominator and source marker should appear, without inventing academic references or claiming a real experiment was conducted.
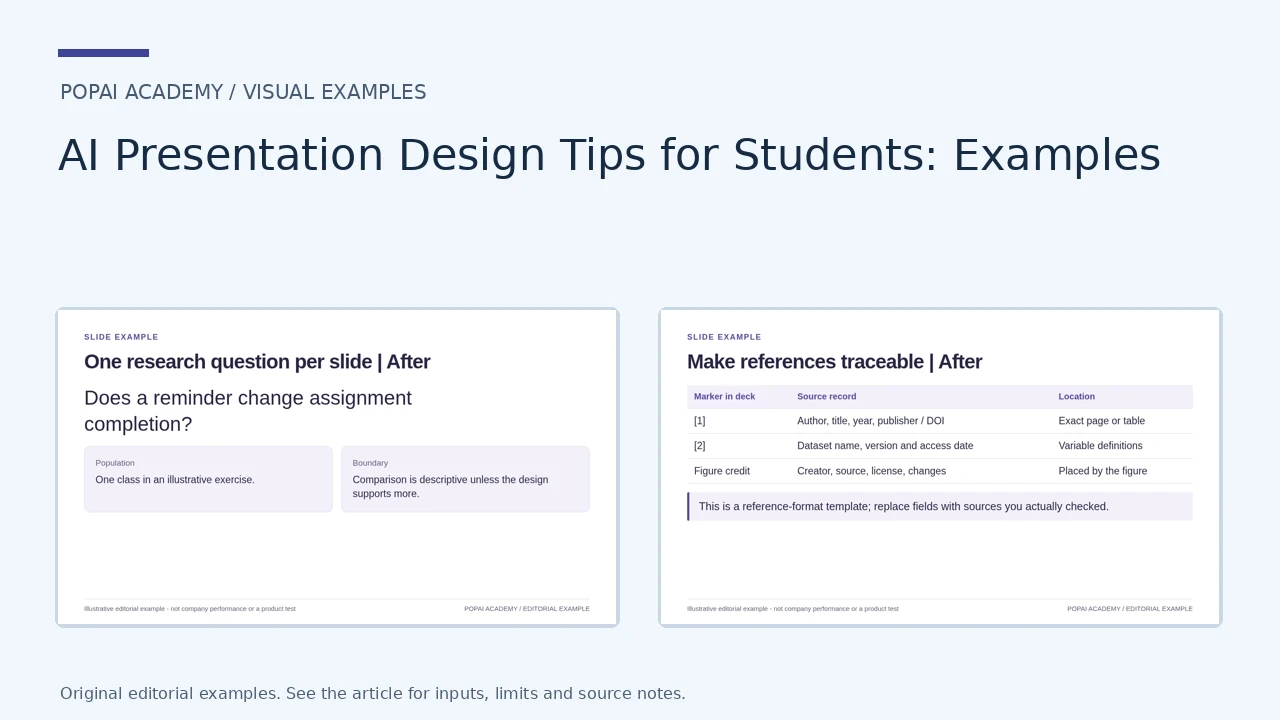
Open full-size examples and editable HTML layoutsOne research question per slide
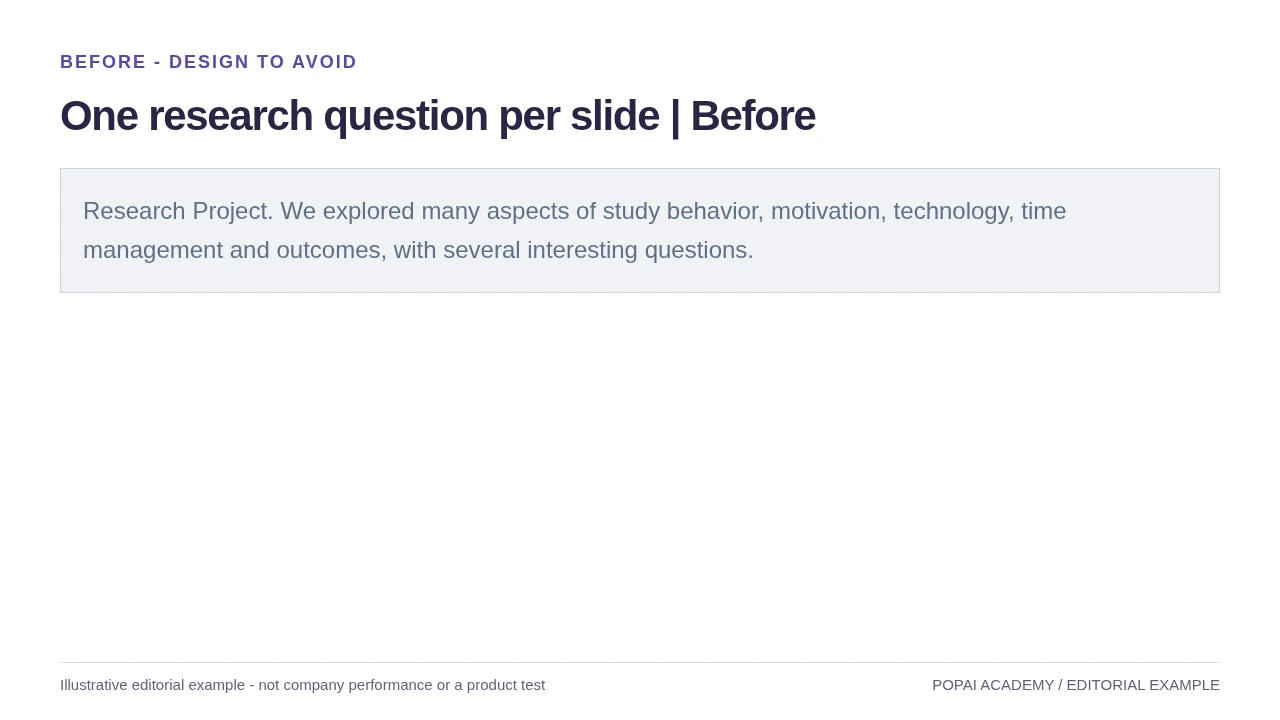
Before: Use a question-led heading and retain the assignment scope; not an actual student study.
Read or copy the slide content
Research Project. We explored many aspects of study behavior, motivation, technology, time management and outcomes, with several interesting questions.
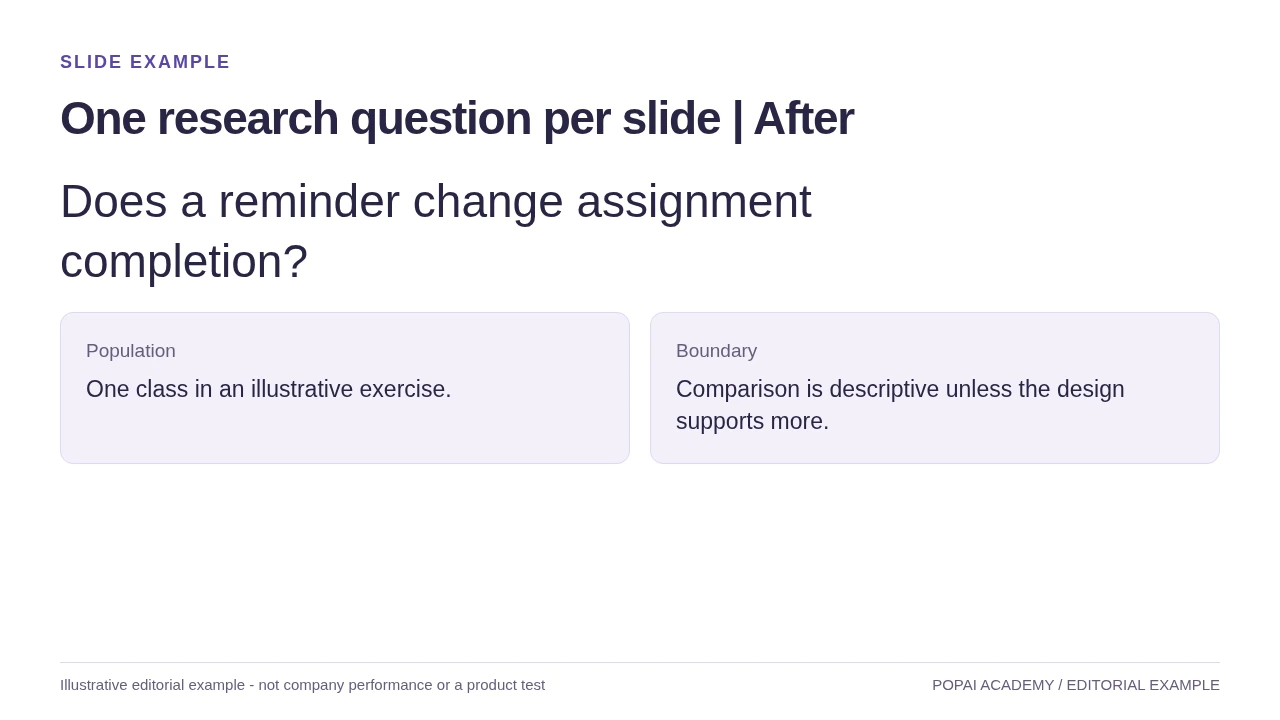
After: Use a question-led heading and retain the assignment scope; not an actual student study.
Read or copy the slide content
Does a reminder change assignment completion?
Population
One class in an illustrative exercise.
Boundary
Comparison is descriptive unless the design supports more.
Prompt for One research question per slide
Create a slide with the purpose "One research question per slide | After". Use these approved source fields or replace the illustrative inputs before use: Does a reminder change assignment completion? Population One class in an illustrative exercise. Boundary Comparison is descriptive unless the design supports more.. Preserve labels, units, source notes and any uncertainty. Do not add results, claims, customers or capabilities. Suggest a readable layout and keep the output editable in the chosen tool.
Keep counts and limits with the result
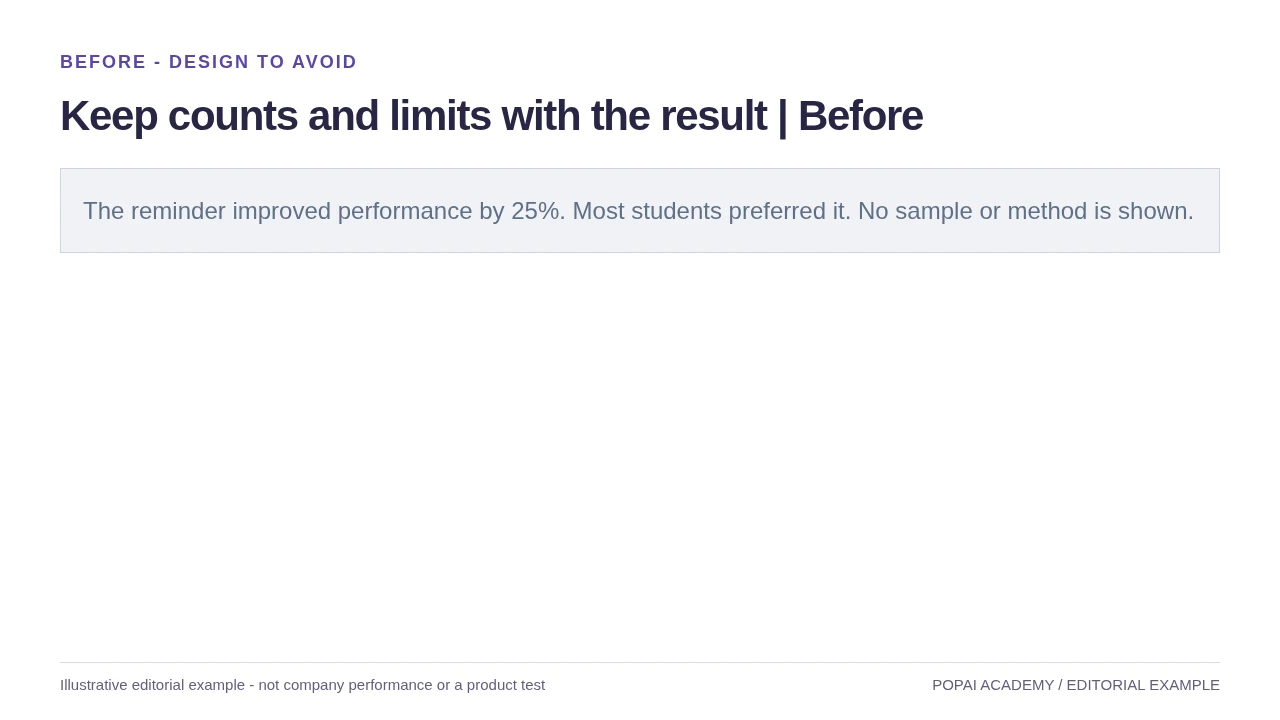
Before: A result slide needs counts, denominator and study limits rather than a louder percentage.
Read or copy the slide content
The reminder improved performance by 25%. Most students preferred it. No sample or method is shown.
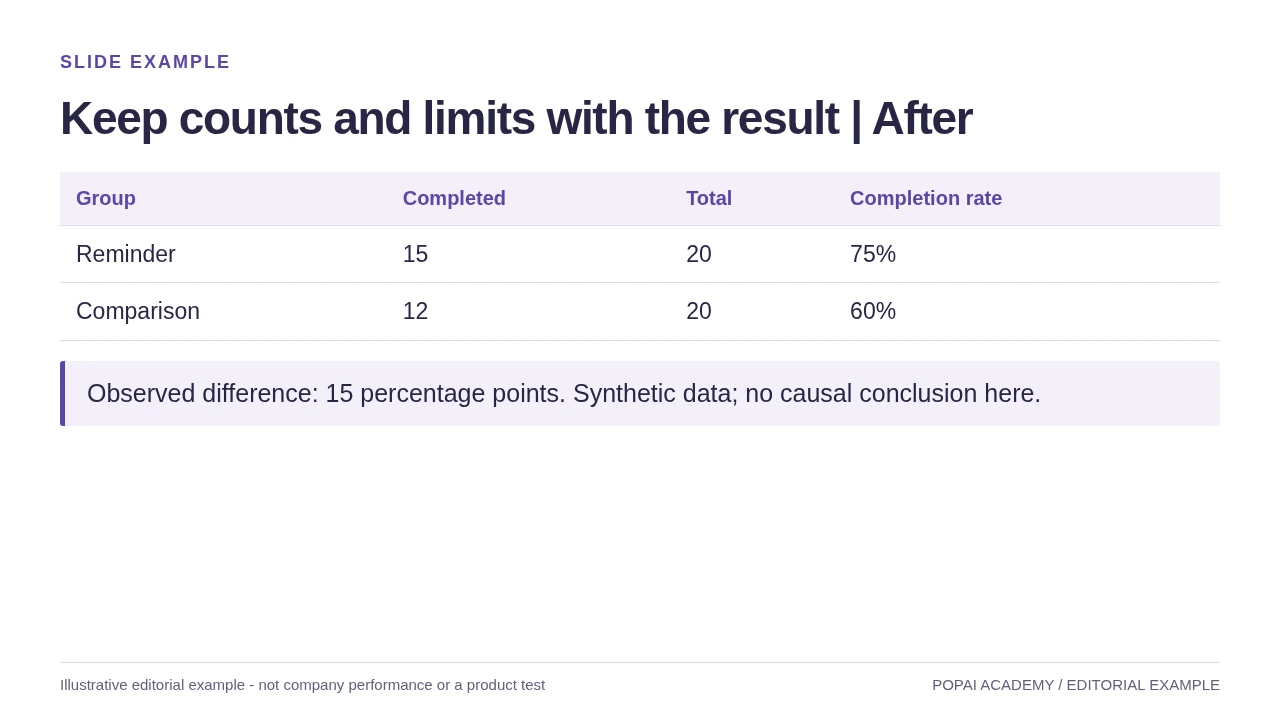
After: A result slide needs counts, denominator and study limits rather than a louder percentage.
Read or copy the slide content
Group
Completed
Total
Completion rate
Reminder
15
20
75%
Comparison
12
20
60%
Observed difference: 15 percentage points. Synthetic data; no causal conclusion here.
Prompt for Keep counts and limits with the result
Create a slide with the purpose "Keep counts and limits with the result | After". Use these approved source fields or replace the illustrative inputs before use: Group Completed Total Completion rate Reminder 15 20 75% Comparison 12 20 60% Observed difference: 15 percentage points. Synthetic data; no causal conclusion here.. Preserve labels, units, source notes and any uncertainty. Do not add results, claims, customers or capabilities. Suggest a readable layout and keep the output editable in the chosen tool.
Make references traceable
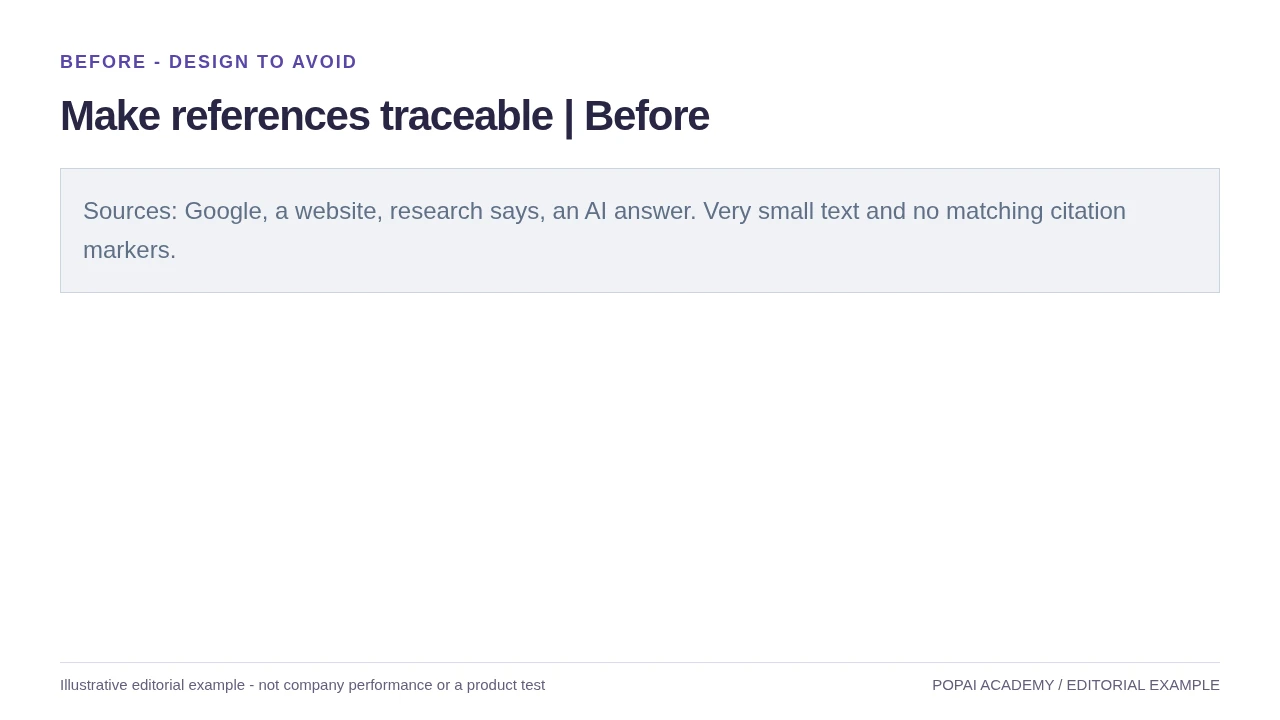
Before: Show matching markers and readable source records; placeholders are not valid citations.
Read or copy the slide content
Sources: Google, a website, research says, an AI answer. Very small text and no matching citation markers.
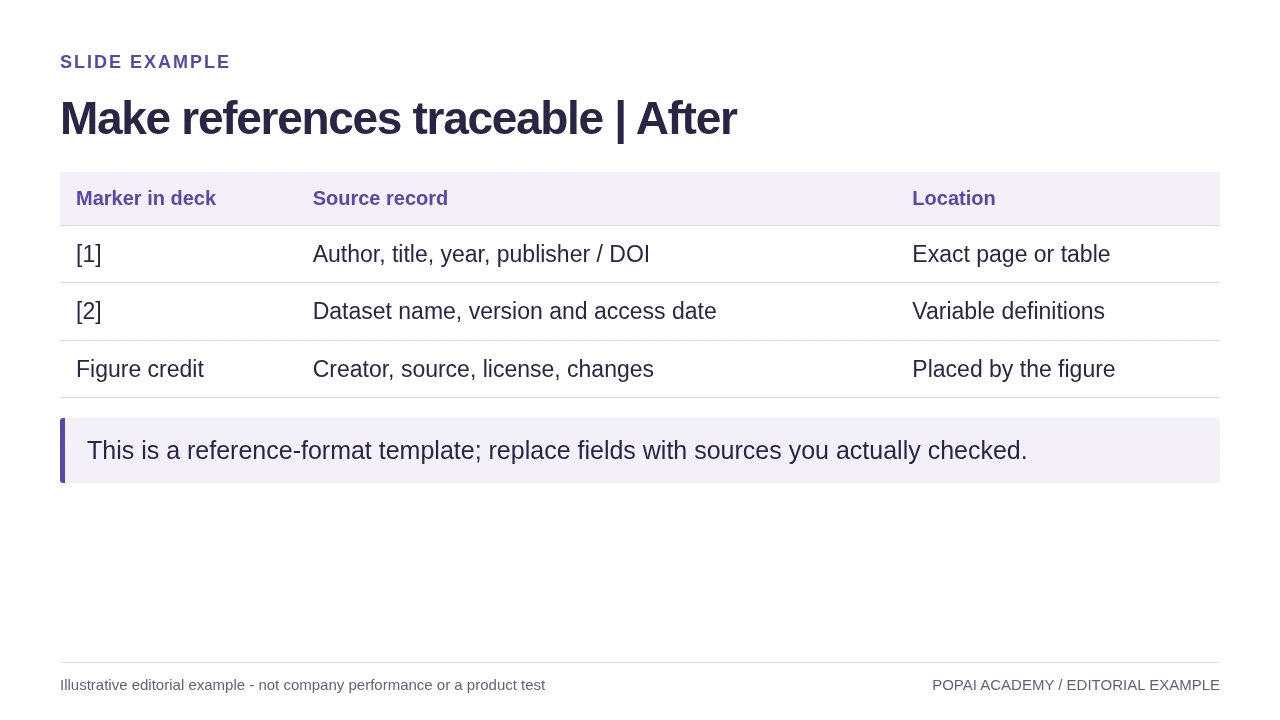
After: Show matching markers and readable source records; placeholders are not valid citations.
Read or copy the slide content
Marker in deck
Source record
Location
[1]
Author, title, year, publisher / DOI
Exact page or table
[2]
Dataset name, version and access date
Variable definitions
Figure credit
Creator, source, license, changes
Placed by the figure
This is a reference-format template; replace fields with sources you actually checked.
Prompt for Make references traceable
Create a slide with the purpose "Make references traceable | After". Use these approved source fields or replace the illustrative inputs before use: Marker in deck Source record Location [1] Author, title, year, publisher / DOI Exact page or table [2] Dataset name, version and access date Variable definitions Figure credit Creator, source, license, changes Placed by the figure This is a reference-format template; replace fields with sources you actually checked.. Preserve labels, units, source notes and any uncertainty. Do not add results, claims, customers or capabilities. Suggest a readable layout and keep the output editable in the chosen tool.
Start with the assignment, not the template
Translate the rubric into visible evidence the audience can find in your slides.
Before writing a prompt, identify what your instructor expects the audience to know or do by the end. Turn each criterion into a check: if the rubric asks you to compare viewpoints, include a slide that directly compares them—not just separate lists of facts. If it assesses your conclusion, reserve space to explain what the evidence means.
Turn one rubric criterion into a slide requirement
Illustrative example: If a rubric says “evaluate two proposed solutions using evidence,” the slide requirement could be: “Show the two solutions side by side, compare them against the same criteria, cite the evidence, and state which trade-off matters most.” After AI drafts the outline, check that it includes that comparison and your own reasoned judgment.
Give AI only materials you are allowed to share, and ask for an outline before a full deck. A detailed prompt can guide a draft, but it cannot guarantee accurate claims or preserve academic integrity for you. Follow your course’s AI policy; disclose assistance when required, and write or revise the analysis yourself so you can explain it aloud. Do not upload personal information, classmates’ work, or restricted course materials unless your institution permits it.
Student prompt template: “Create a [number]-slide presentation for [course and audience] about [topic]. The audience should understand [main takeaway]. Follow these rubric criteria: [criteria]. Use only the notes I provide for factual claims, and flag anything that needs checking. Propose an outline first. Include [required sections], concise slide text, speaker-note suggestions, and a references slide. Do not invent citations. Use a [visual style] style.”
Use AI to organize a route through the material; you are responsible for understanding and defending the argument.
Make each slide clear at a glance
A viewer should be able to find the slide’s main point before reading its supporting detail.
Build a clear hierarchy, then test it
- Headline: State the takeaway, not just the topic. “Survey results” names a subject; “Most respondents chose option B” tells the audience what to notice.
- Text: Keep only the words needed to support the point. As a starting check, try a 28-point title and body text around 18–24 points, then test the deck at its actual presentation size. These are practical starting values, not universal standards.
- Layout and color: Align related items and repeat spacing, type, and color choices. Use strong text-to-background contrast, and do not rely on color alone to distinguish categories.
- Visual choice: Use a chart for comparisons or trends, a diagram for a process, an image when it adds relevant context, and plain text when the evidence is a short quotation or definition. Label data clearly and credit visuals you did not create.
Illustrative before-and-after: Imagine a draft slide with a paragraph of survey findings, a small chart, and the headline “Results.” Revise it to a claim-led headline, one chart with readable labels, and a short note naming the survey group and period. Move the explanation into speaker notes. If the chart still needs a long spoken disclaimer to make sense, simplify it or use a small comparison table instead.
Run two quick checks: zoom out until the slide is about the size it will appear on a projector, and ask someone unfamiliar with the topic what they notice first. If they cannot identify the takeaway, increase its visual prominence or remove competing details. Check contrast and labels as well as font size; a large label can still be hard to read against a low-contrast background.
Use AI for a first draft, then direct the design
Keep the workflow anchored to your own notes and decisions, whether you draft slides with AI or by hand.
- Prepare: Gather the brief, your notes, and sources you are permitted to use. Remove private or restricted information before using an online tool.
- Outline: Ask for a slide-by-slide plan. Check its order against the assignment and make sure it includes your analysis, not just background information.
- Draft: Generate or build a first version, then compare each slide with the outline and rubric. Treat missing details and suggested claims as questions to investigate.
- Revise: Rewrite generic headlines, reduce crowded slides, check chart labels, and replace visuals that do not help explain the point.
- Deliver: Use the format your instructor accepts. Open the exported file on the device you will present from and check for shifted text, missing fonts, or altered charts.
For example, a student preparing a short presentation on campus food waste could use their own class notes to request an outline, then add the instructor-required comparison of two interventions. They would still need to check that any suggested statistic appears in a source they have consulted and write their own explanation of which intervention seems more practical. If you want to try a prompt-based option, PopAi AI Presentation is one tool to consider; check its current privacy terms, supported inputs, and export behavior before using it with coursework. You can also compare other AI presentation makers against your school’s requirements.
A generated outline is a draft of the route, not proof that you understand the destination.
Check claims, citations, and rubric alignment
Confirm both that a source exists and that it supports the exact statement on your slide.
AI can produce an incomplete claim, misstate a statistic, or suggest a reference that does not support the slide. Keep a source list as you research. For each factual claim, open the original source and check its context; for a chart, verify the values, units, time period, labels, and source note. A search result or a plausible-looking reference entry is not enough.
Trace a claim back to the evidence
Illustrative verification example: Suppose a generated slide says, “A campus composting program cuts food waste by 40%,” and lists a report in the references. Open the report and search for the figure. Check whether it measures food waste, whether the population and time period match the slide, and whether the report describes a comparable program. If it reports a 40% reduction at one site, do not present that as a general result. Narrow the wording and name the context—or remove the claim if the source does not support it.
Run a source and rubric check
- Match each factual claim to a source you actually consulted; distinguish source-backed facts from your interpretation.
- Check quotations against the original wording and give generated or third-party visuals appropriate attribution.
- Confirm reference details—author, title, date, and publication—and use the citation style your instructor requires.
- If sources conflict, state the difference in scope or method rather than selecting the more convenient number. If a claim remains unsupported, qualify or remove it.
- Mark AI assistance or generated content when your course policy requires disclosure, then map each rubric criterion to the slide that demonstrates it.
Match slide count to speaking time
Choose the number of slides by timing your explanation, not by treating a common range as a rule.
For a 10-minute talk, seven to ten slides can be a starting estimate, not a standard. A demonstration may need more short steps; a debate or a question-heavy talk may need fewer slides and more time for discussion. One possible 10-minute plan is a brief opening, six or seven minutes for the main explanation, and a conclusion, with time reserved for questions if the format requires them.
Use rehearsal to decide what to cut
Rehearse aloud with a timer and note the time at each section. If you rush through a finding, shorten the background; if you read a slide word for word, cut text and move explanation into your notes; if a transition feels abrupt, add a spoken link rather than another full slide. For a team presentation, time each speaker, rehearse handoffs, and check that everyone uses the same terms and visual style.
Final check: Can you explain every slide without reading it? Can a viewer read the text and chart labels from the presentation location? Does each page support the assignment’s argument? If a slide does not help the audience understand your point, revise or remove it.