An effective sales slide makes the buyer's question and the relevant evidence visible on the first read. This design guide focuses on four page types: problem-to-solution, ROI, proof labels and scope comparison. Discovery, value modeling and opportunity strategy belong in the AI sales pitch deck guide.
Four Sales Slide Design Comparisons
The revised slides make uncertainty easier to see, not easier to hide. Figures are hypothetical. The ROI example uses the same $38 hourly rate and corrected arithmetic as the sales-pitch guide.
Open full-size examples and editable HTML layoutsMake the problem-solution pairing visible
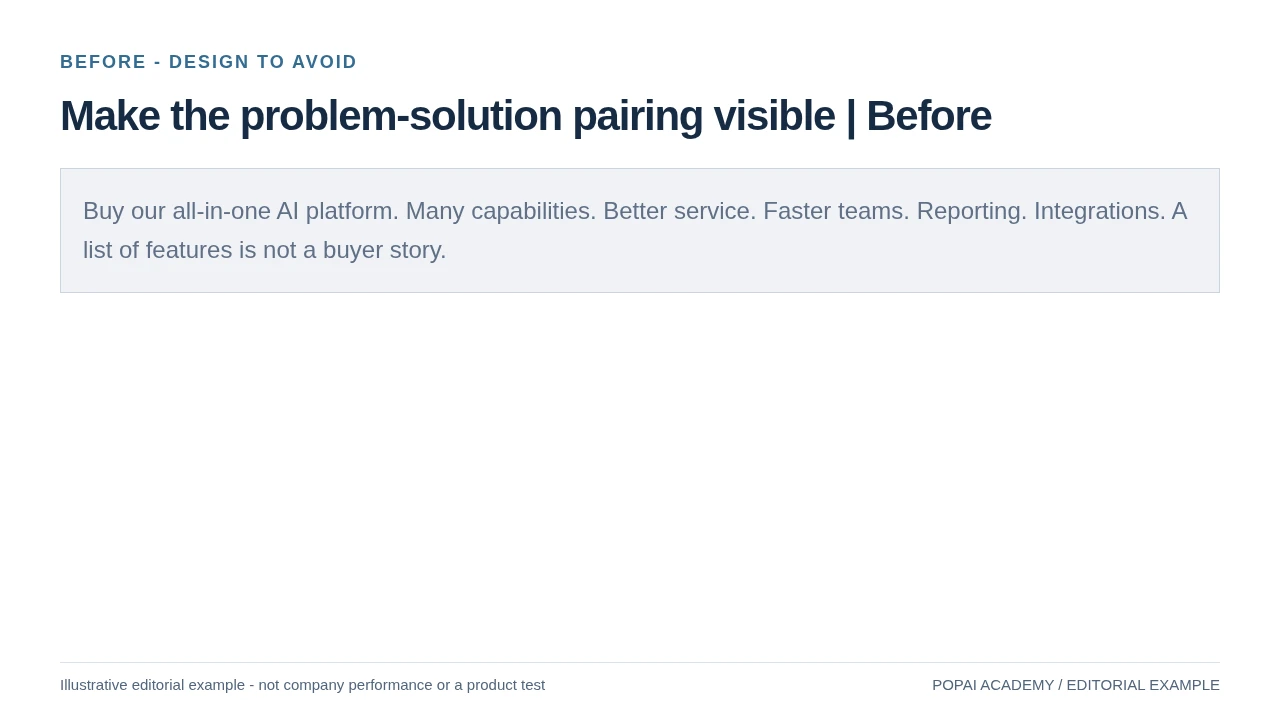
Before: Use aligned columns for pain, proposed change and evidence; leave account strategy to the pitch guide.
Read or copy the slide content
Buy our all-in-one AI platform. Many capabilities. Better service. Faster teams. Reporting. Integrations. A list of features is not a buyer story.
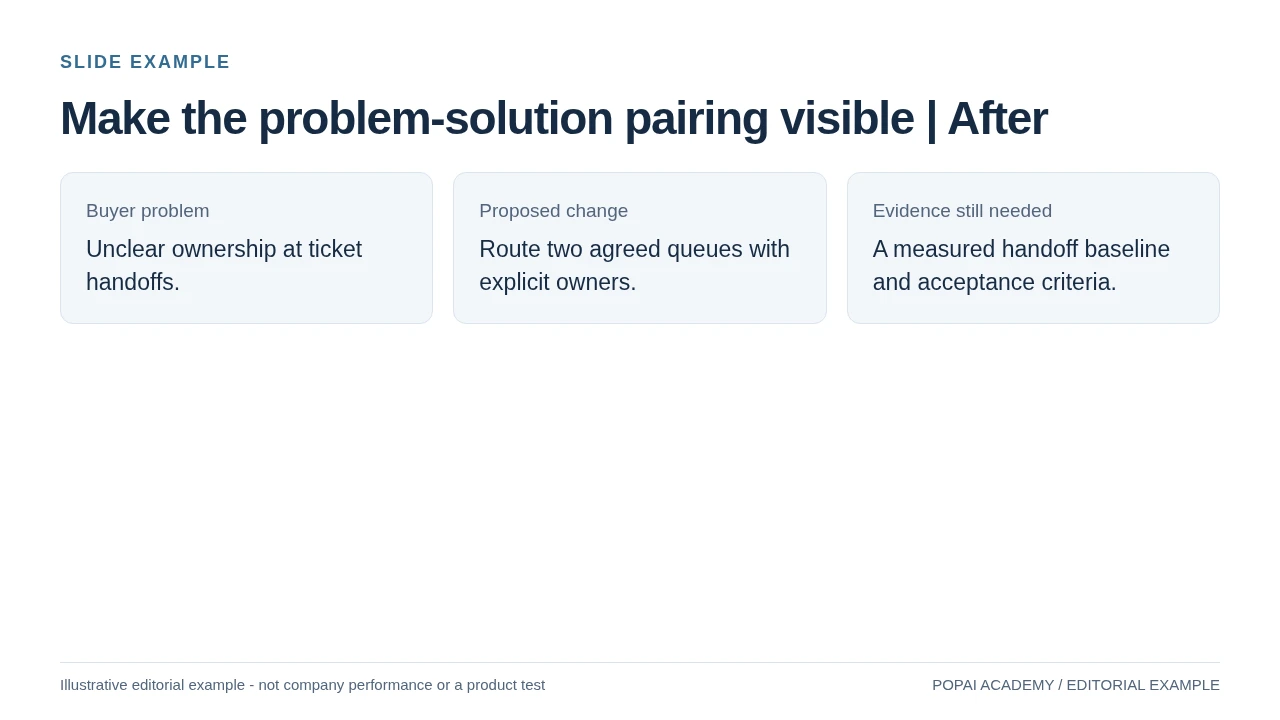
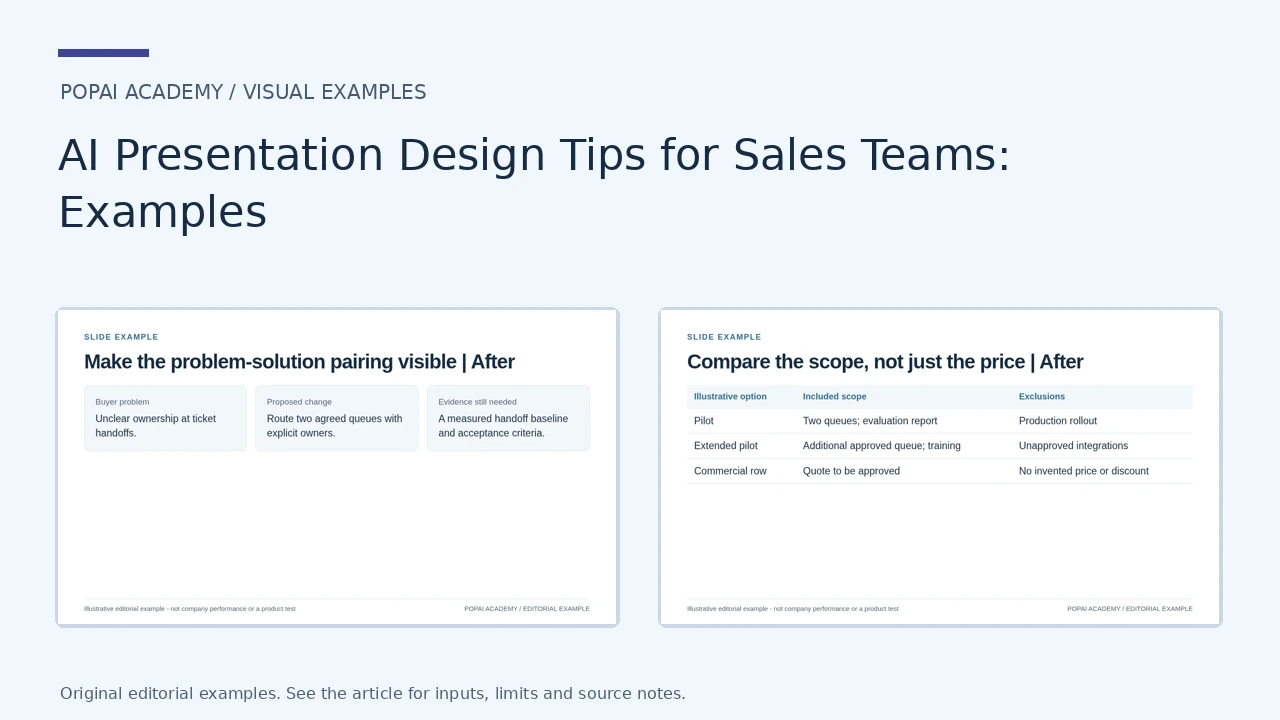
After: Use aligned columns for pain, proposed change and evidence; leave account strategy to the pitch guide.
Read or copy the slide content
Buyer problem
Unclear ownership at ticket handoffs.
Proposed change
Route two agreed queues with explicit owners.
Evidence still needed
A measured handoff baseline and acceptance criteria.
Prompt for Make the problem-solution pairing visible
Create a slide with the purpose "Make the problem-solution pairing visible | After". Use these approved source fields or replace the illustrative inputs before use: Buyer problem Unclear ownership at ticket handoffs. Proposed change Route two agreed queues with explicit owners. Evidence still needed A measured handoff baseline and acceptance criteria.. Preserve labels, units, source notes and any uncertainty. Do not add results, claims, customers or capabilities. Suggest a readable layout and keep the output editable in the chosen tool.
Highlight capacity value, not a savings promise
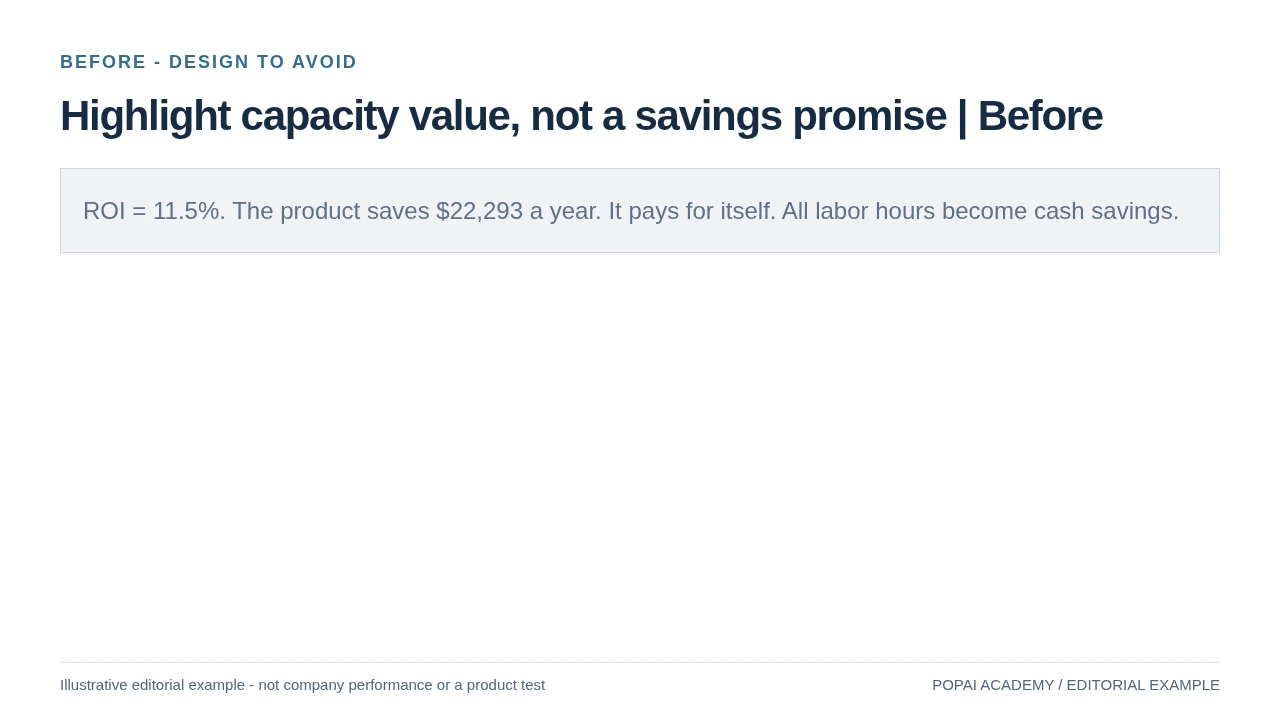
Before: Keep benefit definition and cost scope adjacent to the ROI label; labor rate is explicit.
Read or copy the slide content
ROI = 11.5%. The product saves $22,293 a year. It pays for itself. All labor hours become cash savings.
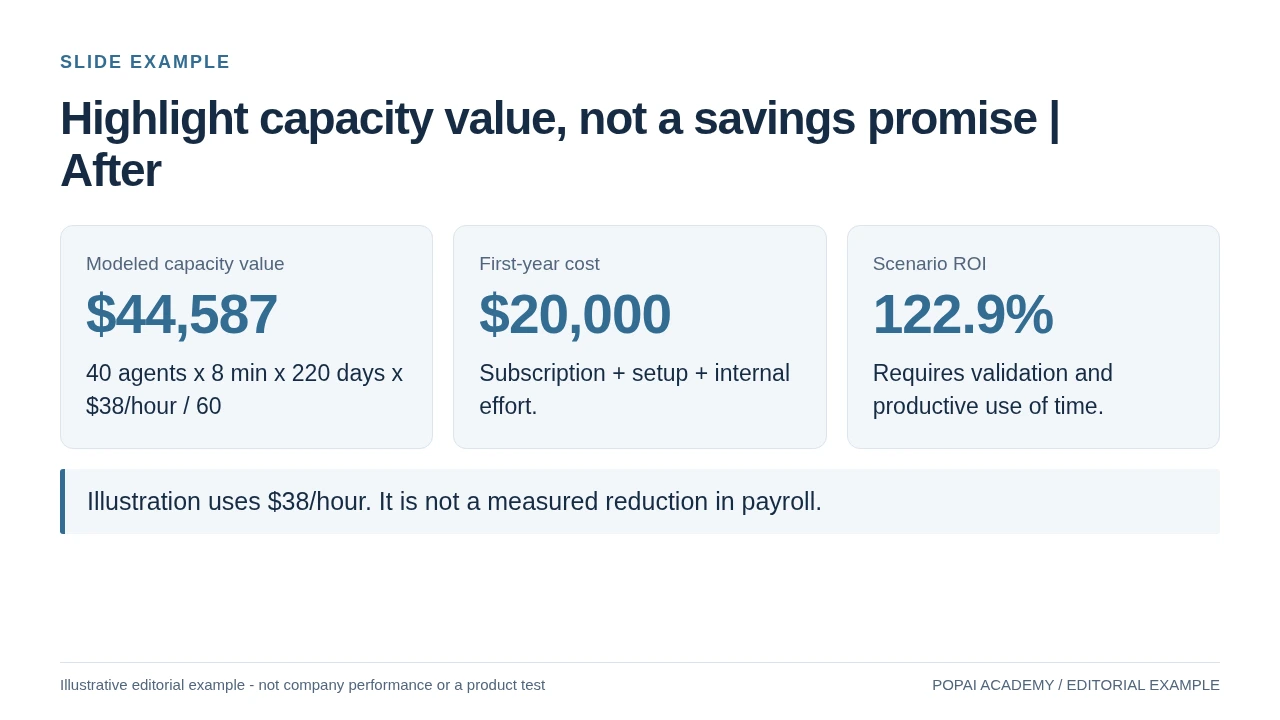
After: Keep benefit definition and cost scope adjacent to the ROI label; labor rate is explicit.
Read or copy the slide content
Modeled capacity value
$44,587
40 agents x 8 min x 220 days x $38/hour / 60
First-year cost
$20,000
Subscription + setup + internal effort.
Scenario ROI
122.9%
Requires validation and productive use of time.
Illustration uses $38/hour. It is not a measured reduction in payroll.
Prompt for Highlight capacity value, not a savings promise
Create a slide with the purpose "Highlight capacity value, not a savings promise | After". Use these approved source fields or replace the illustrative inputs before use: Modeled capacity value $44,587 40 agents x 8 min x 220 days x $38/hour / 60 First-year cost $20,000 Subscription + setup + internal effort. Scenario ROI 122.9% Requires validation and productive use of time. Illustration uses $38/hour. It is not a measured reduction in payroll.. Preserve labels, units, source notes and any uncertainty. Do not add results, claims, customers or capabilities. Suggest a readable layout and keep the output editable in the chosen tool.
Evidence labels are better than invented badges
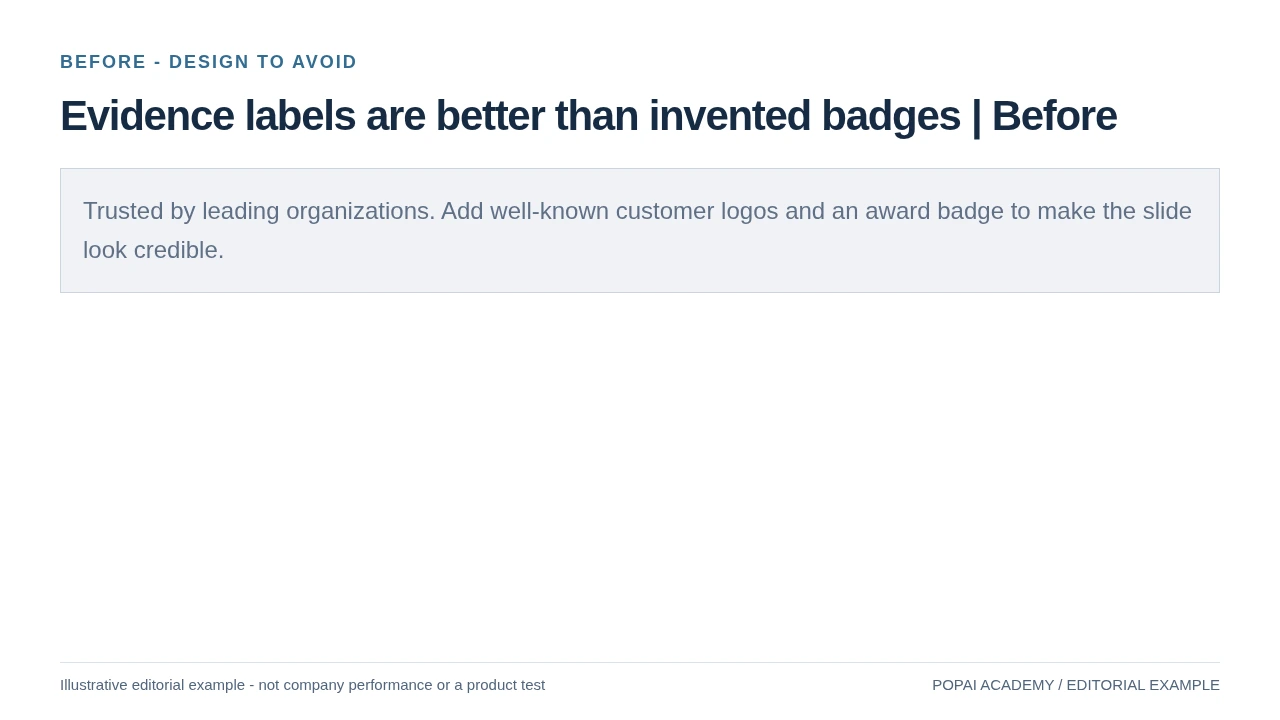
Before: Do not fabricate customer logos, certifications or endorsement cues.
Read or copy the slide content
Trusted by leading organizations. Add well-known customer logos and an award badge to make the slide look credible.
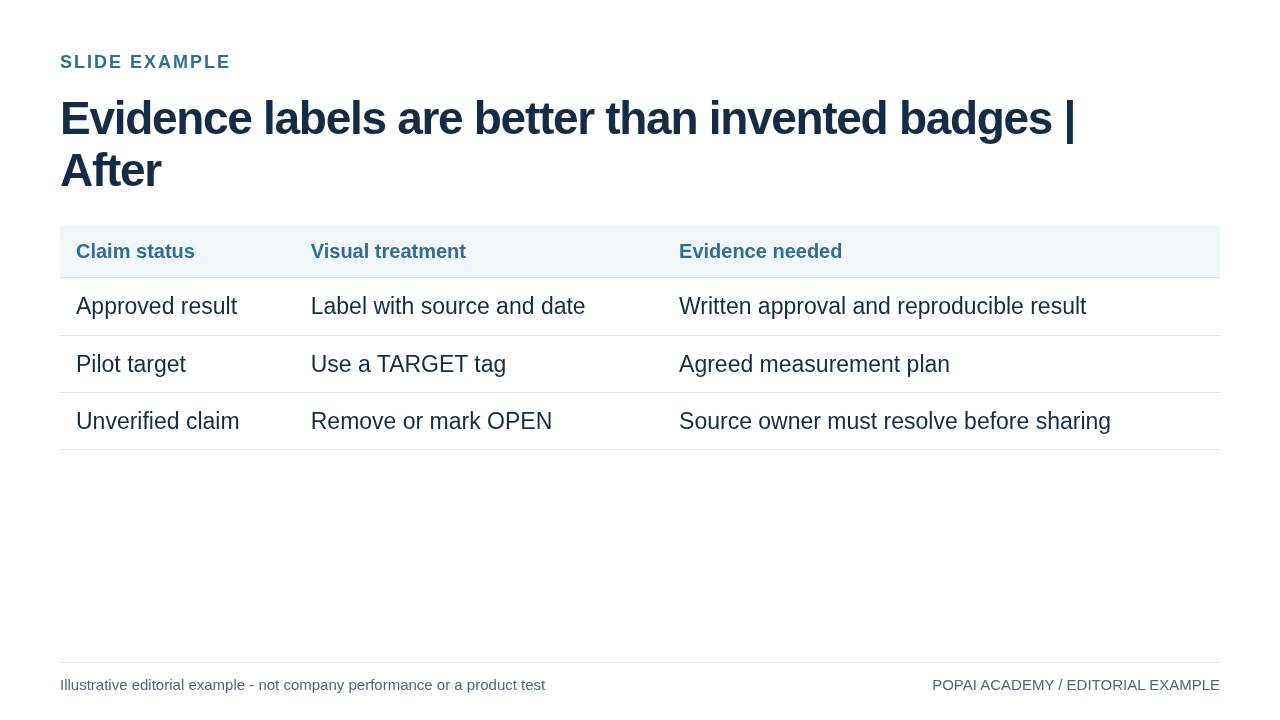
After: Do not fabricate customer logos, certifications or endorsement cues.
Read or copy the slide content
Claim status
Visual treatment
Evidence needed
Approved result
Label with source and date
Written approval and reproducible result
Pilot target
Use a TARGET tag
Agreed measurement plan
Unverified claim
Remove or mark OPEN
Source owner must resolve before sharing
Prompt for Evidence labels are better than invented badges
Create a slide with the purpose "Evidence labels are better than invented badges | After". Use these approved source fields or replace the illustrative inputs before use: Claim status Visual treatment Evidence needed Approved result Label with source and date Written approval and reproducible result Pilot target Use a TARGET tag Agreed measurement plan Unverified claim Remove or mark OPEN Source owner must resolve before sharing. Preserve labels, units, source notes and any uncertainty. Do not add results, claims, customers or capabilities. Suggest a readable layout and keep the output editable in the chosen tool.
Compare the scope, not just the price
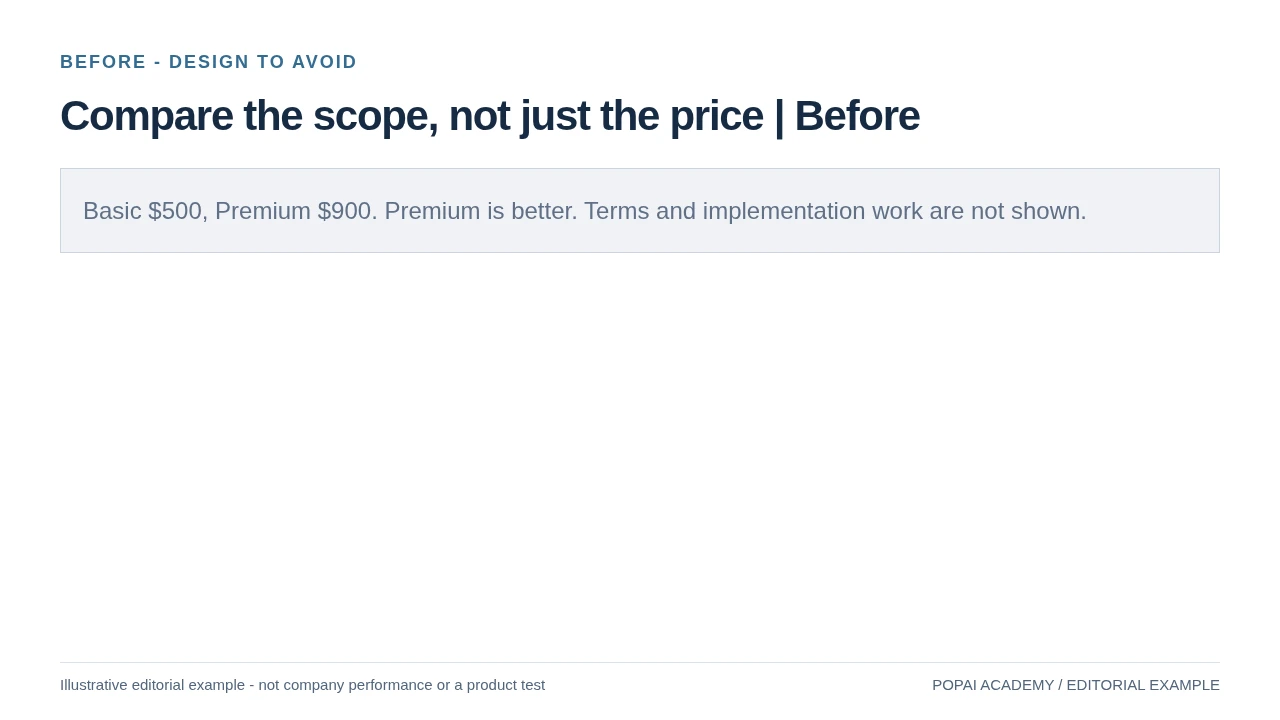
Before: Place inclusion and exclusion rows on the same slide; example scope is not an actual offer.
Read or copy the slide content
Basic $500, Premium $900. Premium is better. Terms and implementation work are not shown.
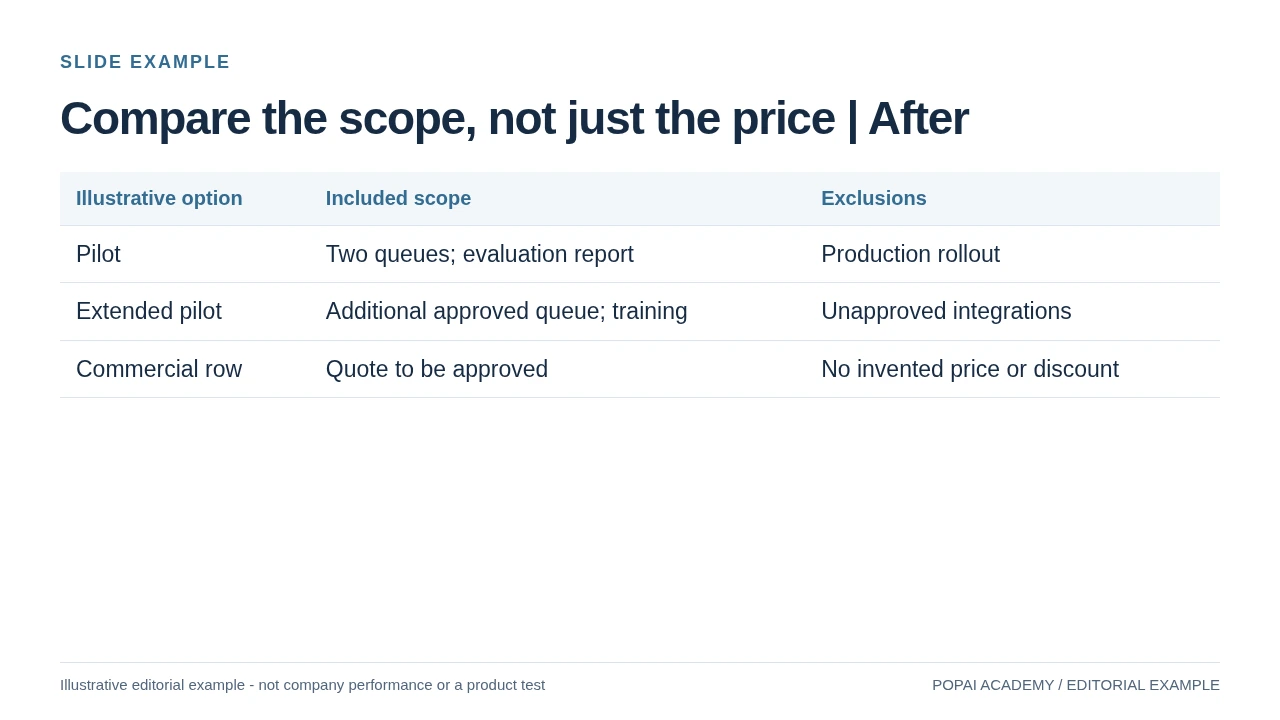
After: Place inclusion and exclusion rows on the same slide; example scope is not an actual offer.
Read or copy the slide content
Illustrative option
Included scope
Exclusions
Pilot
Two queues; evaluation report
Production rollout
Extended pilot
Additional approved queue; training
Unapproved integrations
Commercial row
Quote to be approved
No invented price or discount
Prompt for Compare the scope, not just the price
Create a slide with the purpose "Compare the scope, not just the price | After". Use these approved source fields or replace the illustrative inputs before use: Illustrative option Included scope Exclusions Pilot Two queues; evaluation report Production rollout Extended pilot Additional approved queue; training Unapproved integrations Commercial row Quote to be approved No invented price or discount. Preserve labels, units, source notes and any uncertainty. Do not add results, claims, customers or capabilities. Suggest a readable layout and keep the output editable in the chosen tool.
Turn the buyer’s decision into a slide sequence
For a broader view of available tools, compare the latest AI presentation makers before choosing the workflow that best fits your team.
One-line takeaway: Give each slide a job in the buyer’s decision, then choose a layout that makes that job easy to understand.
A sales narrative can move from confirmed context to business impact, proposed change, evidence, risks, and next steps. The slide sequence should reflect the meeting: an executive review may need a concise recommendation and decision; a technical evaluation may need workflow and architecture detail. For a broader tool comparison, see AI presentation makers.
Carry one example through the deck: capability → workflow change → possible business impact → evidence needed. In the retail scenario, the capability might support inventory reporting; the workflow change might be fewer manual reconciliation steps; the possible impact might be time returned to exception analysis. The first two points still need validation against the product and buyer’s process, and any time-saving figure needs evidence. A forecast is not an observed result.
“A feature describes what the product does. A buyer-centered slide explains why that capability matters in this customer’s situation—and what evidence supports the connection.”
Simulated example, not a customer result: If the buyer confirms reconciliation takes two days each week, show that baseline as a buyer-provided figure with its source and date. Put the proposed workflow on the next slide, then make the pilot’s measurement plan explicit: compare time spent on the same task before and during the pilot. Do not claim savings until the comparison has been completed and reviewed.
As a planning heuristic, spend more slides on the buyer’s context, decision, and evidence than on a feature inventory. Adjust the balance to the meeting: an executive sponsor may need the business case, risks, and decision in a few slides, while a technical team may need more space for integration, security, and implementation details.
Design slides for a quick first read
One-line takeaway: A buyer should be able to identify a slide’s point and read its key evidence without squinting or waiting for narration.
Give each slide one main message. Use a conclusion-led title such as “The proposed pilot tests whether reconciliation time can be reduced” rather than a topic label like “Pilot.” Then make the visual support that point: a short process diagram for a workflow, a line chart for change over time, or a labeled bar chart for category comparisons.
Use measurable checks, not “make it cleaner”
- Text size: As a practical starting point for a 16:9 meeting-room deck, use titles around 28–36 pt and body text around 18–24 pt. Check the actual screen or room; do not shrink essential content to fit.
- Density: Keep each slide to one takeaway and a few supporting points. Move detail to speaker notes or an appendix instead of compressing it into tiny text.
- Hierarchy: Use one title style, one body style, and a consistent treatment for labels. Reserve the accent color for the most important comparison or action.
- Charts: Label axes, units, date ranges, and categories directly where possible. Avoid relying on color alone to distinguish series.
- Contrast: Check text and chart contrast, including when projected. WCAG’s contrast guidance is a useful reference for digital content, though a projected room may need stronger contrast and larger type.
- Whitespace: Separate competing ideas with space. If the slide still feels crowded, split it or move supporting detail to an appendix.
Before-and-after design decision: A crowded slide might combine six feature bullets, a paragraph, and a chart titled “Efficiency.” Rework it as a conclusion-led title, a three-step workflow diagram, and one sourced metric with its date and unit. Keep the remaining capabilities for a separate slide or appendix. The redesign reduces competing elements; it does not make an unverified claim more credible.
Choose a chart only when comparison or change is the point. If the audience needs to understand a sequence of tasks, use a simple process diagram; if the takeaway is a single decision or caveat, a short text slide may be clearer than a decorative chart. For every metric, check the source, time period, units, and denominator, and label estimates and assumptions explicitly.
“If a buyer cannot tell what the chart measures, when it was measured, and what decision it informs, simplify the slide before presenting it.”
For accessibility, do not use color as the only signal: add direct labels, patterns, or symbols where needed. Check that the exported file remains legible and that chart labels are not clipped. The W3C contrast guidance provides a reference for text contrast; presentation conditions can make larger type and stronger contrast necessary.
Personalize the context; govern reusable content
One-line takeaway: Reps should tailor the buyer context, while owners control templates, product claims, and approved proof.
Keep a master deck or approved content library with a named owner for each component—for example, enablement for the template, product marketing for product claims, and the case-study owner for customer evidence. Lock brand elements and approved claims where the software allows it; let reps adapt the opening, relevant use case, confirmed priorities, and next-step slide.
Use a simple maintenance cycle: assign an owner and review date to each module; check product claims and brand assets on a set schedule and whenever they change; record the current version in one shared location; and archive or remove superseded copies. A rep should be able to identify the current approved version without comparing several files.
Personalize only with relevant, permitted information. If a buyer priority or case-study permission is uncertain, confirm it before using it. When a claim, competitive comparison, or customer quote is not in the approved library, send it for review rather than asking AI to improvise. If you use a generation tool with source documents or templates, check its current documentation and test whether the resulting file is editable in your team’s required format.
Review high-risk claims before visual polish
One-line takeaway: Check customer-facing claims and commercial terms first, then review the design and the exported file.
Assign a named reviewer for each customer-facing deck. The presenter can check audience fit and flow; an authorized product, legal, or commercial owner should review claims in their area when required. Keep the source for each material metric, quotation, product capability, price, and competitive comparison so approval does not depend on a reviewer’s memory.
Use a two-pass review and a simple scorecard
- Pass one—content and risk: Verify claims, pricing, product limitations, customer permissions, and the distinction between observed results, estimates, and assumptions. Resolve or remove unsupported points before polishing.
- Pass two—presentation and file: Check the story, readability, chart labels, contrast, brand elements, and accessibility. Export to the meeting format, open that file in the software or device you will use, and inspect every slide for layout changes.
- Record the review: Score each area 0 (not checked), 1 (needs correction), or 2 (ready): claim traceability; buyer relevance; visual readability; brand fit; and export integrity. A zero on a required check or any unresolved high-risk claim means the deck is not ready to send.
Track corrections by type—unsupported claim, wrong source, audience mismatch, layout issue, or export problem—rather than recording only that a deck “needed edits.” That record helps the team improve prompts and templates without mistaking a visually polished draft for a verified one.
Simulated pilot example: Compare AI-assisted and current-process decks for similar meeting types, such as discovery follow-ups, rather than comparing an executive renewal deck with a technical evaluation. Record preparation time, reviewer corrections, rubric scores, export issues, and whether the planned next step was agreed. A shorter draft time is useful only if review effort and quality are also acceptable; buyer engagement or a later sale cannot by itself prove that AI caused the result.
Practical experiment: Have a small group of reps use the same review rubric for a short pilot. Compare similar opportunities, log preparation and correction time, and review the findings with enablement before changing the team template or approval rules.