Presentation Analytics: AI Engagement Metrics and Review Guide
Published on September 10, 2026
If you create sales decks, investor pitches, training lessons, or executive updates, the hard question usually comes after the send: who opened the deck, which slides mattered, and what should you do next? AI presentation analytics helps answer that with slide views, dwell time, completion rate, CTA clicks, repeat visits, forwarding signals, and AI-generated interpretation.
A practical example: after a sales demo, a rep shares a proposal by tracked link instead of attaching a PDF. The dashboard shows three viewers from the same account, repeated visits to security and pricing slides, no click on the “book implementation call” CTA, and a drop-off before the customer proof section. That does not prove the buyer is ready to purchase, but it gives the rep a better next move: send a security FAQ, add a shorter ROI summary, and ask whether procurement or IT should join the next call.
This guide covers what presentation analytics tools measure, how link-based tracking works, how AI turns slide-level behavior into cautious intent signals, and how to build a dashboard and workflow that improves the next deck rather than simply collecting vanity metrics.
What AI Presentation Analytics Actually Measures
Presentation analytics starts with observable viewer behavior: opens, slide progression, pauses, revisits, clicks, exits, and repeat sessions.
Core metrics, formulas, and practical interpretation
The same number can mean different things depending on audience, deck length, sharing method, and slide type. Use the metrics below as decision inputs, not isolated proof.
| Metric | Useful formula or definition | What it can indicate | Common false positive | Practical next step |
|---|---|---|---|---|
| Unique viewers | Distinct sessions, devices, emails, or authenticated users depending on the platform | Audience reach and possible stakeholder spread | One person opening from phone and laptop; forwarded anonymous link | Use gated or personalized links for high-value sales and investor decks. |
| Completion rate | Viewers reaching final slide ÷ total viewers | Whether the story carries people to the CTA | Deck opened during a live meeting where the presenter controls pacing | Compare asynchronous views separately from live-meeting views. |
| Average dwell time | Total time on slide ÷ slide views, often capped to reduce idle-tab distortion | Interest, confusion, review effort, or friction | Browser tab left open; viewer distracted | Compare against slide complexity and deck average before changing content. |
| Drop-off rate | Viewers exiting at a slide ÷ viewers who reached that slide | Weak transition, irrelevant content, excessive length, or CTA timing problem | Viewer got the answer they needed and stopped early | Review the slide before the drop-off, not only the drop-off slide itself. |
| CTA conversion rate | CTA clicks ÷ viewers who reached the CTA | Whether the proposed next step is clear and compelling | CTA was discussed in a separate email or meeting | Test clearer button copy, earlier CTA placement, or a lower-friction action. |
| Repeat-view rate | Viewers with 2+ sessions ÷ unique viewers | Ongoing evaluation, internal review, or unresolved questions | Internal team previews and quality checks | Filter employee domains and tag test sessions before reporting. |
Data analysis note: Dwell time is more reliable when capped and compared by slide type. For example, a 75-second average on a dense technical architecture slide may be normal, while 75 seconds on a five-word agenda slide often points to an idle tab or a confused viewer. Many teams cap slide dwell time at 2–5 minutes for reporting so one abandoned browser window does not distort the deck average.
When evaluating tools, compare presentation creation capability separately from measurement depth. Many AI presentation makers can generate strong slide drafts quickly, but only some platforms provide viewer identity, slide-level dwell time, CTA attribution, CRM syncing, or account-level engagement scoring.
Experienced revenue teams do not ask, “Did the buyer like the deck?” They ask, “Which part of the deck created a useful follow-up question, and can we verify that signal with the buyer?”
How AI Presentation Analytics Tools Track Engagement
The most measurable decks are shared as browser-based experiences rather than static attachments.
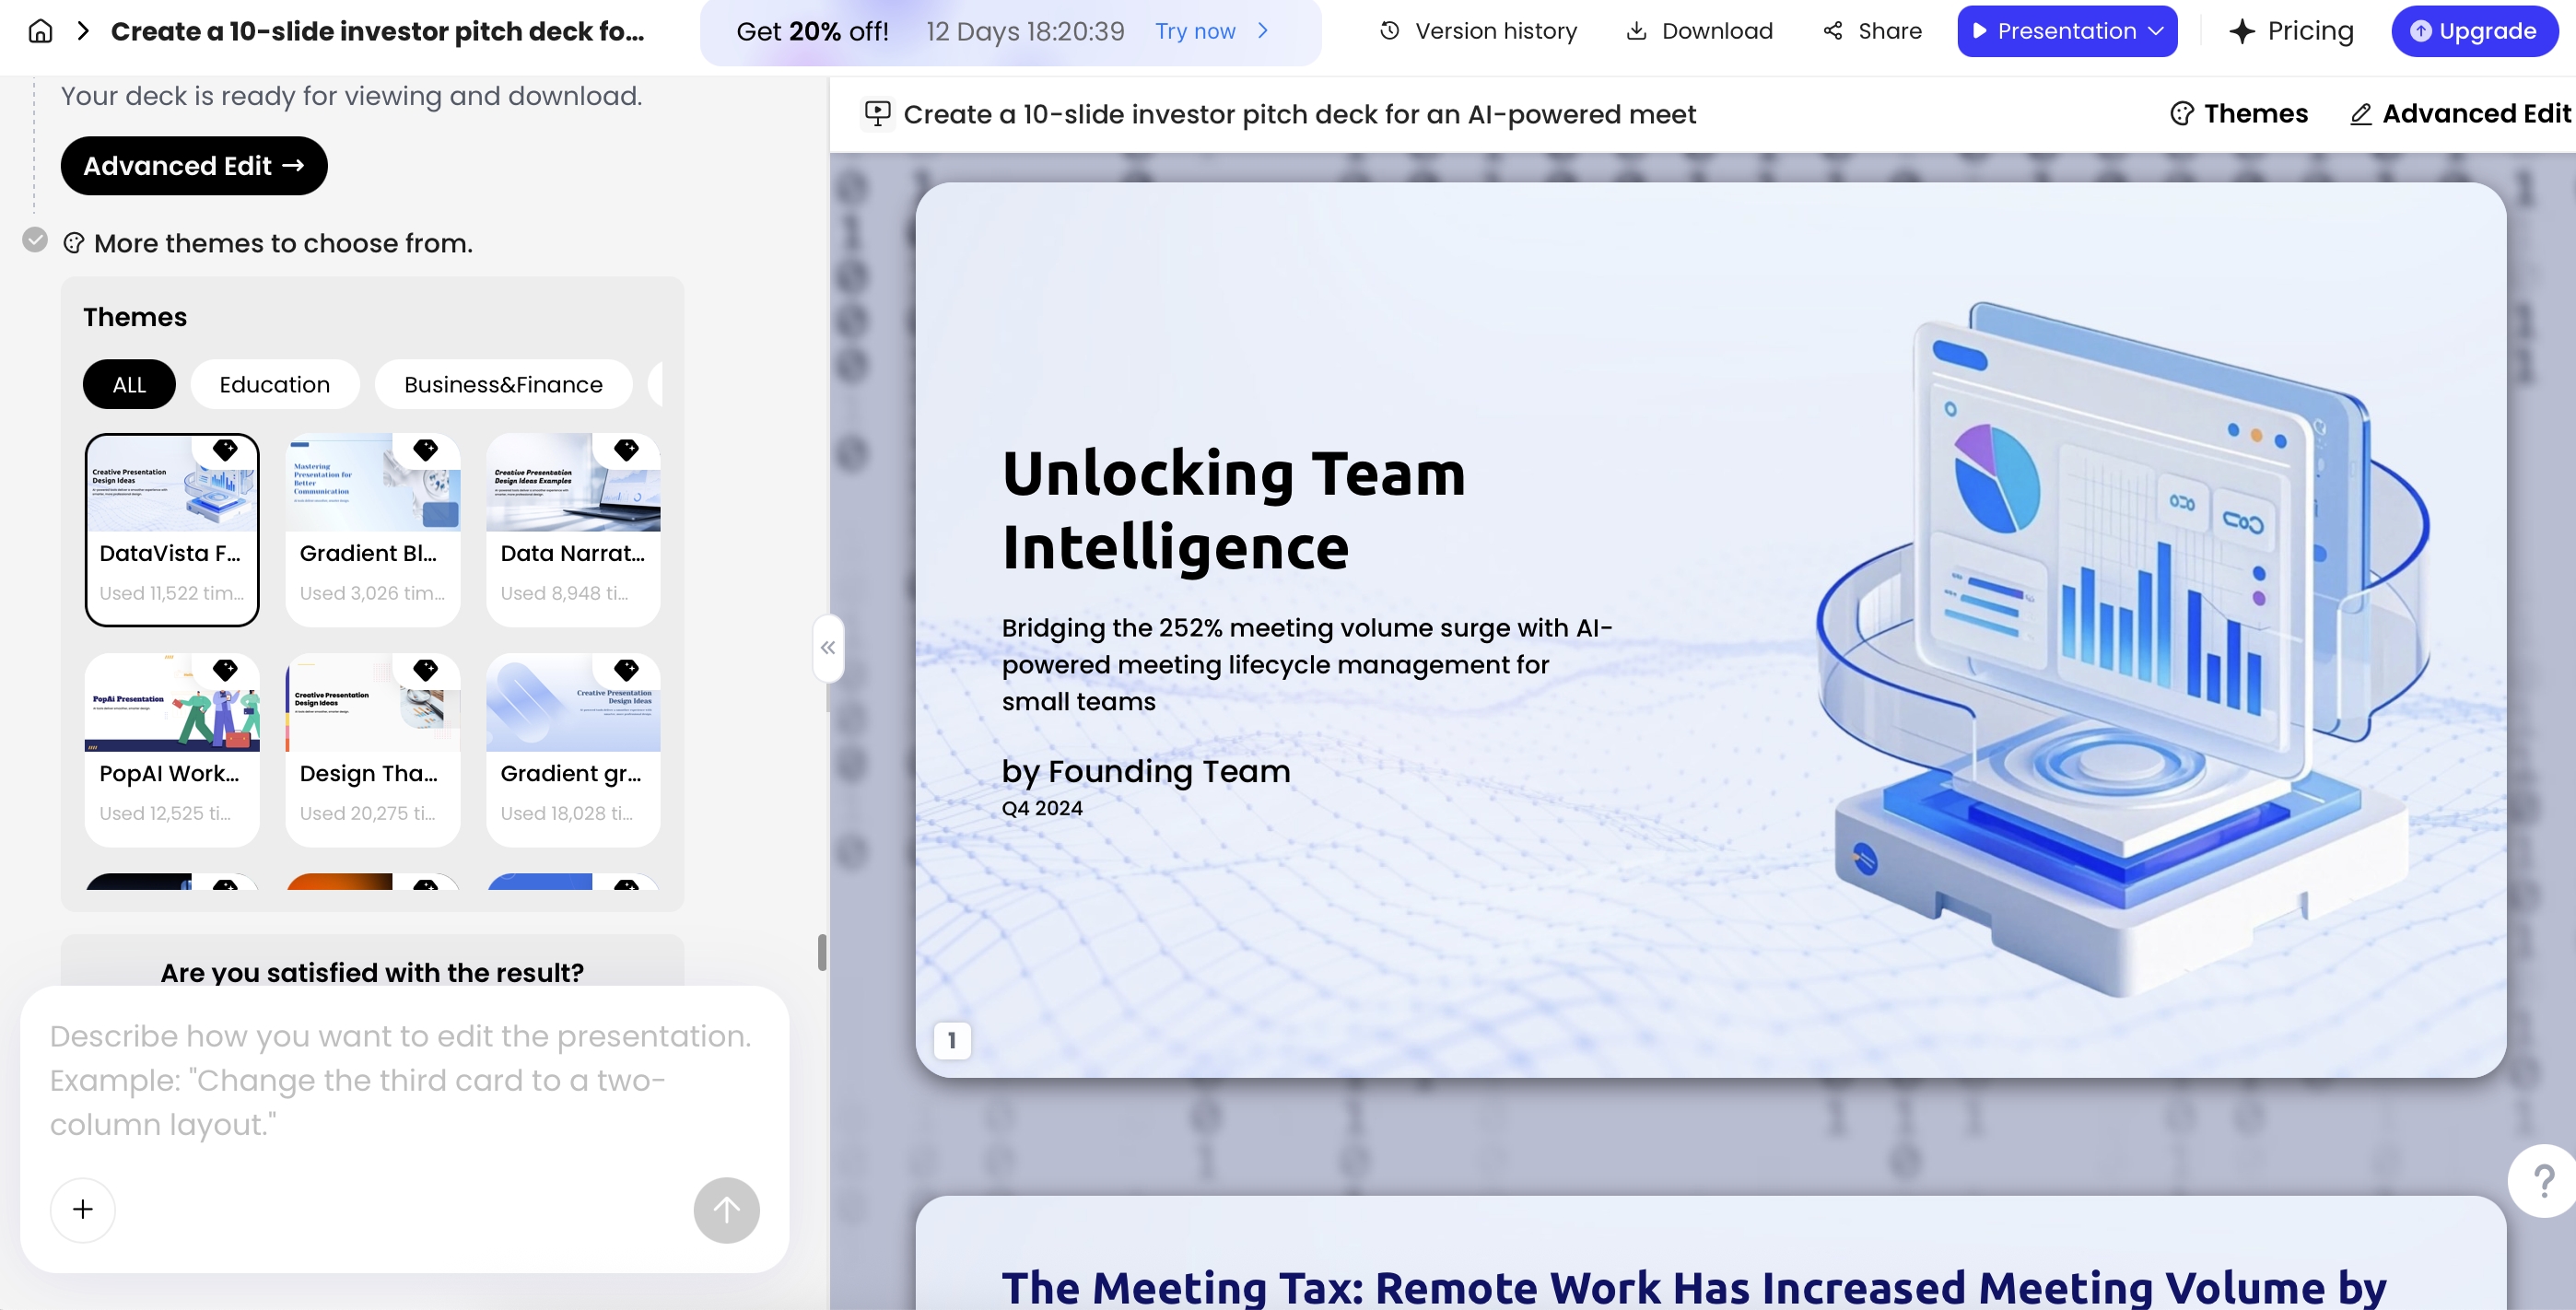
A typical tracking flow works like this: the platform generates a link, the viewer opens the deck in a browser, the system assigns a session ID or matches the viewer to an email/authenticated profile, slide events are logged, bot and internal traffic are filtered, and AI summarizes patterns into alerts or recommendations. Tools such as PopAi AI Presentation are useful on the creation and distribution side because teams can generate decks from prompts or uploaded materials, edit them, export to PPTX/PDF, and share by link; if you need slide-level engagement dashboards, confirm whether your chosen workflow includes native analytics or a connected analytics/sales-enablement layer.
Tracking methods and what they actually capture
| Sharing method | What it can capture | Identity confidence | Limitations | Best fit |
|---|---|---|---|---|
| Public anonymous link | Opens, sessions, slide views, dwell time, device, approximate location, CTA clicks | Low | Forwarded links and shared devices blur viewer identity | Marketing decks, public webinars, broad content testing |
| Personalized tracked link | Viewer-specific sessions, repeat opens, slide behavior, CTA clicks | Medium to high | Email forwarding can misattribute views unless forwarding is detected | Sales proposals, investor outreach, account-based campaigns |
| Gated form | Submitted identity plus engagement events after access | Medium | Form friction reduces opens; false form data is possible | Lead generation, training enrollment, partner enablement |
| Authenticated portal | User-level behavior, permissions, audit logs, version access | High | Requires account setup and stronger governance | Employee training, customer portals, confidential materials |
| Email attachment | Usually email open/click only, not slide-level behavior | Low to medium | PDF/PPTX activity is mostly invisible after download | Low-risk sharing where tracking is not important |
| Downloaded PDF/PPTX | Usually no post-download slide analytics | Very low | Forwarding, printing, offline use, and edits are not visible | Final handouts, procurement archives, board packets |
Where AI enters the tracking workflow
- Event cleanup: flagging internal previews, unusually fast sessions, repeated bot-like opens, and idle-tab outliers.
- Slide classification: reading slide titles, extracted text, visual layout, and user-applied labels such as “pricing,” “proof,” or “risk.”
- Pattern detection: identifying high-friction slides, repeated review paths, common exit points, and CTA timing problems.
- Recommended action: suggesting a follow-up asset, deck revision, CRM note, nurture email, or A/B test.
Technical details matter. Anonymous session IDs are useful for aggregate behavior, but they are weak for individual follow-up. Email-tokenized links improve attribution, but corporate security scanners can trigger false opens. Cookies can help with session continuity, but they may require consent depending on jurisdiction and implementation. UTM parameters help attribute traffic source, but they do not solve viewer identity by themselves.
From Slide-Level Data to Audience Intent
AI can suggest possible intent from behavior, but it cannot read a viewer’s mind.
Signal, possible interpretation, and validation question
| Observed signal | Possible interpretation | Do not assume | Validation question or action |
|---|---|---|---|
| Long time on pricing | Budget review, package comparison, procurement concern, or serious purchase consideration | That the buyer wants a discount | “Would it help if I mapped the price to expected ROI and rollout assumptions?” |
| Repeated security/compliance views | IT, legal, or procurement may be involved | That the deal is blocked | Send a security packet and ask whether a technical reviewer should join. |
| Skipped customer proof | Proof is too generic, too late, or not matched to industry | That the viewer does not care about evidence | Replace logos with one relevant before/after case study. |
| Drop-off before ROI | The opening may not establish urgency quickly enough | That the ROI slide is bad | Move the quantified pain or outcome closer to the beginning. |
| Forwarding after technical slides | A champion may be involving evaluators | That the buying committee is aligned | Offer a technical appendix or implementation walkthrough. |
Field observation: In sales and investor decks, the most useful signal is often not the longest-viewed slide but the combination of repeat views, stakeholder spread, and next-step action. A pricing slide viewed once for two minutes is ambiguous; a pricing slide revisited by three identified contacts, followed by a procurement FAQ click, is a stronger account-level signal.
AI models usually classify slide content by extracting text, reading titles, recognizing layout patterns, and comparing the slide to semantic categories such as problem, solution, proof, pricing, implementation, risk, or CTA. Manual slide labels are still valuable because AI may misread a slide with sparse text, dense charts, screenshots, or unusual terminology. The safest workflow is to let AI generate a hypothesis, then have the presenter validate it through follow-up questions and deal context.
Presentation analytics should produce better questions, not automatic conclusions. “They spent time on compliance” is useful; “legal is blocking the deal” is a guess until someone confirms it.
AI Presentation Analytics by Use Case
Each presentation type needs its own scorecard because the desired audience action is different.
Sales decks and proposals: detect buying-committee movement
- Primary goal: identify whether the account is still evaluating, expanding stakeholders, or ready for a next meeting.
- Watch: unique viewers by account, repeat views, pricing dwell time, security/procurement slides, CTA clicks, and forward signals.
- Warning sign: pricing revisits with no CTA click and no follow-up response.
- Action: send a short ROI summary, procurement FAQ, or implementation timeline rather than a generic “checking in” email.
- False positive: internal sales team previews can look like account engagement unless filtered.
Investor pitch decks: separate curiosity from diligence
- Primary goal: understand whether investors are moving from initial screening into partner review or data-room diligence.
- Watch: completion rate, time on market, traction, business model, team, financials, and repeat visits after the first open.
- Warning sign: strong first-slide opens but drop-off before traction.
- Action: tighten the problem statement, move proof earlier, and send a concise traction memo with the follow-up.
- False positive: a forwarded link may represent an associate review, not partner interest, unless viewer identity is known.
Training and enablement decks: measure learning friction
- Primary goal: improve comprehension, completion, and behavior change.
- Watch: module completion, knowledge-check clicks, skipped sections, repeat visits, quiz scores, and time spent on process slides.
- Warning sign: long dwell time across nearly every slide, which often means cognitive overload rather than deep engagement.
- Action: split dense modules, add checkpoints, convert text-heavy instructions into diagrams, and compare results in the next cohort.
- False positive: mandatory employee training can show high completion without real understanding unless paired with assessments.
Executive updates and business reviews: surface decisions faster
- Primary goal: help leaders reach decisions, spot risks, and prepare for discussion before the meeting.
- Watch: pre-read completion, repeat views on KPI/risk slides, comments or questions, and whether decision slides are reached.
- Warning sign: executives repeatedly revisit risk tables but do not reach the recommendation slide.
- Action: move the risk summary earlier, add an explicit decision slide, and separate supporting detail into an appendix.
- False positive: an assistant or analyst may open the deck on behalf of an executive.
For executive and business-review workflows, deck creation often starts with messy source material: PDFs, Word documents, HTML reports, spreadsheets, prior PPTX files, images, meeting notes, audio, or video transcripts. A generation tool can help organize that material into a clearer outline before analytics is applied to the shared version. Keep the boundary clear: content-generation features help prepare the deck; analytics features or connected systems measure how the audience uses it.
A Practical Dashboard Template for Presentation Performance
A useful dashboard should tell the team what happened, why it may matter, and what to do next.
Sample dashboard fields
| Field | Example value | Why it matters |
|---|---|---|
| Viewer/account | Acme Corp / 3 identified viewers | Shows whether engagement is individual or account-level. |
| Deck version | Proposal v2 - procurement version | Prevents mixing performance from different narratives. |
| Source channel | Rep email, campaign, partner portal, event follow-up | Connects deck behavior to distribution quality. |
| First open / latest open | Opened 2 hours after send; revisited 3 days later | Helps time follow-up and identify renewed interest. |
| Completion rate | 68% | Shows whether viewers reached the final recommendation or CTA. |
| Most-viewed slide | Slide 9: implementation timeline | Indicates the topic attracting attention or concern. |
| Drop-off slide | Slide 4: company overview | Highlights likely narrative drag or irrelevant content. |
| CTA action | No demo-booking click; pricing PDF clicked | Distinguishes passive viewing from next-step behavior. |
| AI interpretation | High implementation interest; unclear economic case | Creates a hypothesis for follow-up, not a final verdict. |
| Recommended next step | Send rollout plan and ROI assumptions; ask about technical review | Turns analytics into an action owner can execute. |
Recommended dashboard sections
- Audience overview: unique viewers, total sessions, repeat viewers, device mix, geography, internal/test views, and traffic source.
- Engagement funnel: open rate, first-slide retention, midpoint completion, final-slide completion, and CTA conversion rate.
- Slide heatmap: average dwell time, capped dwell time, skips, revisits, exits, and drop-off points by slide.
- Intent signals: pricing attention, proof engagement, security review, implementation interest, and share activity.
- Action queue: follow-up owner, recommended message, deck revision, CRM alert, nurture sequence, or A/B test.
A simple engagement score can help prioritize follow-up, but it should remain transparent. For example: Engagement score = completion points + repeat-view points + CTA points + high-intent slide points - bot/internal penalties. Keep the formula visible so sales, marketing, or training teams can challenge it when the score does not match reality.
Sales managers may want account-level views and rep coaching insights. Marketing teams need campaign attribution, message testing, and CTA conversion. Content teams need slide quality patterns: where narrative flow breaks, which visuals perform, and whether evidence slides carry enough weight. Executives need trend-level summaries that connect deck engagement to pipeline, learning outcomes, or strategic alignment.
Tip: Before reviewing analytics, label every slide by purpose: hook, pain, solution, proof, offer, objection handling, implementation, risk, or CTA. When the structure is explicit, AI recommendations are easier to audit and less likely to confuse a proof slide with a sales claim or a risk slide with a blocker.
Using AI Insights to Improve Your Next Presentation
Analytics is only useful when it changes the next deck version or the next conversation.
An analytics-driven revision workflow
- Define the intended action: book a meeting, approve a budget, complete training, review a risk, or click a resource.
- Tag slide purpose: label slides as hook, pain, proof, pricing, implementation, risk, or CTA.
- Share through a measurable channel: use a web link, personalized link, gated portal, or campaign link instead of relying only on attachments.
- Wait for enough signal: avoid overreacting to one viewer unless the deck is for a high-value individual buyer or executive.
- Form a hypothesis: “The pricing slide lacks value framing,” not “price is too high.”
- Change one major variable: revise opening, move proof earlier, simplify pricing, add appendix detail, or change CTA copy.
- Compare the next version: track completion, drop-off, CTA clicks, and repeat views by deck version.
A simple optimization playbook
- If viewers drop off early: rewrite the opening around the audience’s urgent problem, not your agenda.
- If viewers skip proof slides: replace generic logos with a relevant customer story, metric, or before-and-after example.
- If pricing gets long dwell time: add value framing, package comparison, ROI assumptions, procurement FAQs, or a “what is included” note.
- If CTA clicks are low: make the next step specific, low-friction, and repeated near the moment of highest intent.
- If technical slides are revisited: create a follow-up appendix, technical one-pager, security packet, or implementation walkthrough.
Case example: In a monthly business review deck, analytics showed repeated attention on a risk table and drop-off before the recommendation slide. The revision moved the risk summary from slide 12 to slide 4, converted the dense table into a severity-by-owner visual, and added a one-slide decision request immediately after it. In the next version, more viewers reached the decision slide, and follow-up questions shifted from “What is the issue?” to “Which mitigation option do you recommend?” That is the kind of improvement analytics should drive: clearer discussion, not just better-looking slides.
Deck-generation tools can speed up the revision side of this loop when the required change is structural. For example, a tested HTML-to-slides workflow took an HTML report containing an executive summary, KPI section, and risk register, then organized it into a six-page deck with a separate risk table showing severity, owner, and mitigation. The important lesson was not that the first draft was final; it was that a structured draft made the analytics-driven revision faster because the risk section could be moved, simplified, and retested without rebuilding the presentation from scratch.
When revising from analytics, change fewer things than your instincts suggest. If you rewrite the opening, replace all visuals, shorten the deck, and change the CTA at the same time, the next dashboard cannot tell you which change helped. For high-volume sales or training decks, use A/B versions; for low-volume investor or executive decks, document the hypothesis and interpret results qualitatively.

Privacy, Compliance, and Data Quality in AI Presentation Analytics
Tracking viewer behavior creates legal, ethical, and operational responsibilities.
Privacy questions to ask before rollout
- Are viewers anonymous, pseudonymous, or personally identified?
- Does the audience know engagement is being measured?
- Are cookies, email pixels, device fingerprints, or authenticated portals involved?
- Can viewers opt out or request deletion?
- Who can access analytics: individual reps, managers, admins, customer success teams, or external partners?
- Is sensitive content protected from public forwarding, search indexing, and unauthorized downloads?
- Where is analytics data stored, and are cross-border transfers involved?
- Does the vendor offer a DPA, retention controls, access logs, SSO, SOC 2, ISO 27001, or equivalent security documentation?
Tracking mode risk checklist
| Tracking mode | Privacy risk | Controls to consider |
|---|---|---|
| Anonymous public link | Lower identity risk, higher forwarding risk | Expiration dates, password protection, watermarking, no sensitive data. |
| Gated form | Personal data collection and consent obligations | Clear notice, minimal fields, deletion workflow, consent records. |
| Email-tokenized link | Viewer behavior tied to an identifiable person | Consent review, CRM access control, scanner filtering, opt-out process. |
| Authenticated employee training | Workplace monitoring concerns | HR/legal review, role-based access, transparent purpose, retention limits. |
| Confidential investor or customer deck | Commercial sensitivity and unauthorized redistribution | Access expiry, domain restrictions, NDA process, audit logs, download control. |
Depending on geography and audience, GDPR, CCPA/CPRA, the EU ePrivacy framework, internal security policy, procurement requirements, and customer contractual terms may apply. This is not legal advice, but teams should involve legal, security, or privacy owners before rolling out identified tracking at scale, especially for employee monitoring, healthcare, finance, government, or confidential deal materials.
Data quality is the other half of trust. Analytics can be polluted by internal previews, bots, shared links, privacy browsers, email security scanners, multiple people using one link, screenshots, downloaded files, or a presenter leaving a tab open. AI can detect some anomalies, but it cannot guarantee perfect interpretation.
Practical guardrail: Filter internal traffic, mark test views, separate live-meeting sessions from asynchronous reading, exclude obvious security-scanner events, and review AI recommendations before changing sales priority, training content, or executive messaging.
Choosing Between Deck Creation and Analytics Tools
Choose tools by workflow fit: creation, sharing, measurement, governance, and integration are separate capabilities.
Tool categories to compare
| Tool category | Best for | Analytics depth | Typical limitation |
|---|---|---|---|
| AI presentation generators | Creating and revising decks quickly from prompts or documents | Varies widely; may focus more on content than tracking | Engagement analytics may require another system or plan. |
| Sales enablement platforms | Account-level content tracking, rep workflows, CRM alerts | Often strong for sales engagement and attribution | Can be expensive or complex for small teams. |
| Pitch deck sharing tools | Investor outreach, link control, data-room follow-up | Good for opens, viewer identity, forwarding, and page-level interest | Less flexible for training or broad marketing campaigns. |
| LMS and training platforms | Employee/customer learning, quizzes, compliance completion | Strong for learner progress and assessments | Not designed for sales intent or investor follow-up. |
| Web analytics on hosted slides | Campaign reporting and traffic-source analysis | Strong for aggregate web behavior | May lack slide semantics, viewer identity, and CRM context. |
| PowerPoint/Google Slides add-ons | Teams staying inside existing slide workflows | Depends on add-on and sharing model | Downloaded files and offline use remain difficult to track. |
Trial checklist: test the edge cases before buying
- Create a short test deck with a pricing slide, proof slide, technical slide, and CTA.
- Share one anonymous link and one personalized or gated link.
- Open the deck from desktop and mobile, then compare how sessions are counted.
- Leave a tab idle for 10 minutes and check whether dwell time is capped or distorted.
- Forward the link to a colleague and see whether the platform detects a new viewer.
- Click the CTA and confirm whether the event appears in the dashboard and CRM.
- Download PDF/PPTX and verify whether tracking stops after export.
- Open from an internal domain and confirm whether test traffic can be filtered.
- Ask for retention, deletion, consent, SSO, audit-log, and data-residency controls.
Evaluation criteria
- Analytics depth: slide-level time, section engagement, completion, CTA tracking, viewer identity, account rollups, and trend reports.
- Sharing model: web links, gated pages, password protection, expiring links, PDF/PPTX export, public/private access, and channel distribution.
- AI insight quality: explainable summaries, anomaly detection, intent scoring, slide classification, and recommended revisions.
- Integrations: Salesforce, HubSpot, marketing automation, email tools, BI dashboards, LMS platforms, and web analytics.
- Content workflow: prompt-to-deck, document-to-slides, template control, brand governance, editing flexibility, and export quality.
- Governance: permissions, consent controls, data retention, auditability, SSO, security documentation, and admin reporting.
The strongest workflow is a closed loop: create the deck, share it through a measurable channel, analyze behavior with clear caveats, revise the content, and compare the next version. Presentation analytics is commercially useful when it helps a team send a better follow-up, shorten a weak deck, clarify a buying objection, improve a training module, or bring executives to the right decision faster.
Analytics Interpretation Matrix
Engagement data is useful, but it rarely proves audience intent on its own. Use metrics as signals that need context.
| Metric | Possible meaning | Validation question |
|---|---|---|
| High total views | The deck is being shared, reopened, or reviewed by multiple people. | Are the views from the intended audience or internal testing? |
| Long time on one slide | The slide may be important, confusing, or left open in a browser tab. | Did the viewer interact, ask a question, or stop progressing? |
| Low completion rate | The story may be too long, irrelevant, or blocked by permissions. | Where do viewers drop off and what was the page context? |
| Repeat visits | A stakeholder may be evaluating details or forwarding the deck. | Which sections are revisited and did follow-up activity occur? |
| CTA clicks | The deck may be driving action. | Does the click connect to qualified demand, not just curiosity? |
If analytics collect personal or account-level behavior, add privacy review, consent language, retention rules, and internal access controls before rollout.
Presentation Analytics Tool Capability Matrix
Separate AI deck creation from analytics and sales-enablement platforms. A tool that creates decks does not automatically track engagement.
| Tool / category | Typical analytics to verify | Best fit | Editorial caution |
|---|---|---|---|
| Pitch / collaborative deck platforms | Link views, engagement, team comments, share behavior, and workspace-level analytics where supported. | Team-created decks and collaborative review. | Verify analytics availability by plan and current product docs. |
| DocSend / pitch-deck sharing platforms | Viewer identity, time spent, page or slide activity, completion, download controls, and sharing restrictions where supported. | Fundraising, sales docs, investor outreach, controlled deck sharing. | These are analytics/sharing tools, not necessarily AI deck generators. |
| Sales enablement platforms | Recipient engagement, CRM sync, content performance, rep usage, and deal-stage reporting. | Sales teams that need governance and pipeline visibility. | Implementation and data quality matter more than slide design. |
| AI presentation creators such as PopAi | Generation, editing, export, and share workflows that are publicly visible or verified. | Creating the deck before it enters an analytics workflow. | Do not imply slide-level analytics unless verified in current PopAi product documentation. |
| Website analytics / embedded deck pages | Page views, events, scroll depth, CTA clicks, conversions, and traffic source. | Crawlable landing pages or content hubs built from presentations. | Page analytics are not the same as per-slide attention data. |
Verification date: September 10, 2026. Always check whether viewer identity, slide-level dwell time, CTA tracking, CRM integration, and download tracking are available on the current plan.
FAQ: AI Presentation Analytics
Can AI presentation tools track who opened my deck?
Some analytics-enabled platforms can identify viewers when the deck is shared through tracked links, gated forms, CRM emails, or authenticated portals. Anonymous public links usually provide aggregate behavior instead of confirmed identity.
Can presentation analytics show time spent on each slide?
Yes, link-based or web-view presentations can often measure slide-level dwell time, completion rate, drop-off, and revisits. Downloaded PPTX or PDF attachments are much harder to track after they leave the platform.
Which metrics matter most for sales presentations?
Sales teams usually prioritize unique viewers, repeat opens, time on problem and pricing slides, CTA clicks, forward or share activity, and CRM lead-score changes after viewing.
How do I avoid misreading AI presentation analytics?
Filter internal previews, watch sample size, separate meeting views from asynchronous views, and validate AI recommendations with human judgment before changing messaging or lead priority.
Create a presentation draft faster
Turn prompts, documents, reports, and ideas into editable presentations, then prepare them for export or link-based sharing.
Create the deck first with PopAi AI Presentation