
This guide is for recurring updates to existing investors—not fundraising pitch decks—and shows how to turn an evidence pack into a reviewed, shareable presentation.
The workflow is: choose the story, map the data, ask AI for an outline, correct the draft, and complete a named-owner review before sending. Set aside time to assemble and reconcile the source material first; once that is ready, the first outline and slide draft can often be produced in a focused working session. The exact format depends on your stage and audience: an early, pre-revenue company may need a short written update and a few milestone slides, while a company with recurring revenue may need a consistent KPI trend view. By the end, you should have a period-labeled deck, a specific investor ask, and a record of who approved it.
How to Make an Investor Update Presentation with AI: Start with the Story
Start with the change investors need to understand, then choose the format that makes it easiest to act on.
Before opening a slide tool, finish this sentence: “Since our last update, ___ changed; the main implication is ___.” For example: “Since our last update, activation improved but paid conversion stayed flat; the next six weeks are focused on testing onboarding rather than increasing acquisition spend.” That sentence can become the opening slide and guide what belongs later in the deck.
A short email is often enough when there is little new information or one decision is needed. Use slides when trends, several workstreams, or a visual comparison would be hard to follow in prose. A 10-slide sequence below is an example, not a target; omit sections that do not fit your company.
- Opening: reporting period, headline, and the most important change.
- Commitments: what you said you would do last time, what happened, and what changed in the plan.
- Business evidence: the few metrics that explain performance. A pre-revenue team might show product usage, customer discovery, and milestone progress; a revenue-generating team might show revenue, retention, and pipeline quality.
- Cash and runway: include when relevant, with an as-of date and assumptions.
- Risks and next steps: material risk, mitigation, owner, and review date.
- Investor asks: a specific introduction, decision, or expertise request.
Choose metrics that match the business model. A SaaS company might report paid customer retention using a stated cohort and period; a marketplace might report completed transactions and repeat buyer rate, with the definitions stated. Keep the same definitions and sequence across updates where possible. If a definition changes, show the old and new basis or mark the break in the trend rather than implying a like-for-like comparison.
Use the update to show what changed, what remains uncertain, and what the team will do next—not to make every period look like a win.
Prepare and Map Your Data Before You Prompt
Build a small evidence pack that lets a reviewer trace each important claim to its source.
Make a metric register before drafting
Collect the previous update, approved finance summaries, product analytics, customer or pipeline notes, and the decisions leadership wants investors to know about. Put key figures in a register rather than relying on the model to find and reconcile them across unrelated files.
Example register: “Recognized revenue | $420k | September actual | finance report, approved October 3 | finance owner.” “Active accounts | 68 | September month-end | at least one production event in the last 30 days | product analytics, provisional | product owner.” “Runway | 11 months | estimate as of September 30 | assumes current hiring plan and no new financing | finance owner.” This makes actuals, provisional figures, and forecasts distinguishable before they reach a slide.
- Record the metric, value, period, definition, source, status (actual, provisional, estimate, or forecast), and owner.
- Include the prior-period or plan comparison only when the basis is comparable; identify the comparison explicitly.
- Keep a dated copy of the register each cycle so changes to definitions and prior values are visible.
Resolve gaps and sensitive information before upload
If two sources disagree, do not let AI choose between them. Ask the relevant owner to reconcile the difference, record the decision and source of truth, and mark the figure “pending” if it cannot be resolved before the update. If a metric definition changed, disclose the change and avoid presenting the series as directly comparable. Remove personal data and unnecessary customer or deal details; check your organization’s policies and the AI tool’s data-handling terms before uploading sensitive material.
Write a Prompt That Produces a Useful Investor Update Draft
Use two passes: approve the narrative outline first, then ask AI to draft slides from that outline.
Prepare the brief and request an outline
Provide a clean, period-labeled evidence pack with the current update kept separate from prior-period materials. Tell the model which files are background only, and instruct it not to combine reporting periods. When comparing AI presentation makers, check whether the workflow lets you inspect and edit the outline and output, and confirm current file, export, and data-handling options in the tool itself.
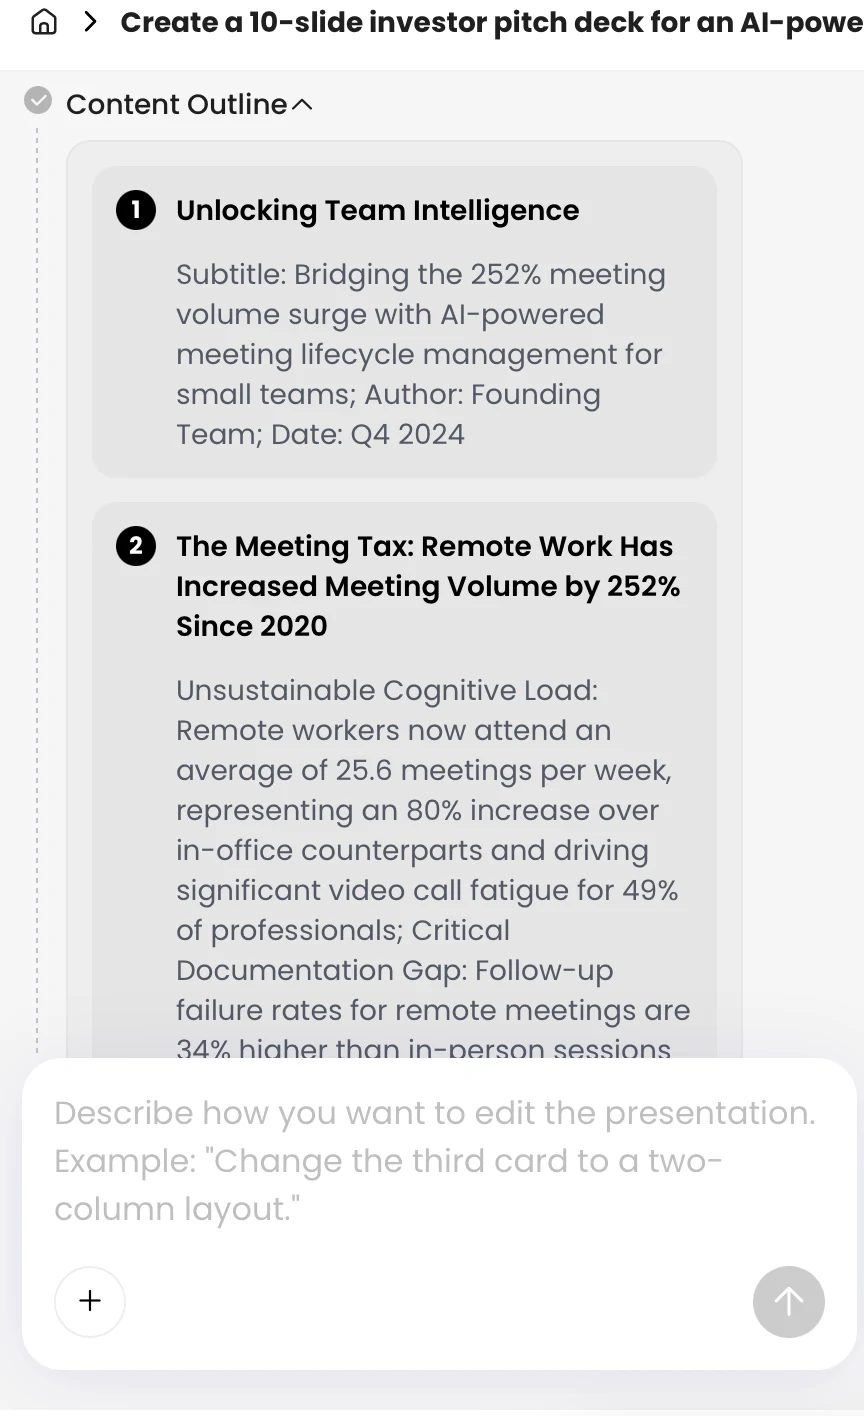
“Prepare an outline for an investor update to existing investors for [period]. Use only the approved current-period evidence pack for current results; use the prior update only to identify previous commitments. Do not merge periods. For each proposed slide, state its takeaway, supporting facts with source and period, and any missing information. Separate actuals, provisional figures, estimates, and forecasts. Do not invent numbers, causes, customers, or quotes. Mark gaps [NEEDS INPUT]. Include progress against prior commitments, relevant business metrics, risks, next-period priorities, and specific investor asks. Omit sections that do not apply. Return the outline only; do not generate slides yet.”
Correct the outline, then generate the draft
Review slide order, missing evidence, and claims that overstate what the data shows. For example, if the outline says “new onboarding caused conversion growth” but the evidence only shows that activation rose after a product change, replace it with a measured description and ask the model to keep causation out unless it is supported.
Then ask the tool to draft slides from the approved outline, retaining source labels and placeholders. If the output is generic, provide a specific correction: “Replace ‘strong momentum’ with the actual result and comparison period; keep the limitation that paid conversion was flat.” A tool such as PopAi AI Presentation can be used to turn a reviewed outline into an editable draft; verify its current input and export options before choosing it for your workflow.
Generate and Edit Slides for Clarity
Treat the generated deck as a first draft: check the claim, evidence, visual, and reading order on every slide.
Turn each slide into a claim the evidence can support
Use a conclusion-led title rather than a topic label. “Activation rose to 42%, while paid conversion remained flat” tells the reader more than “Product Metrics.” Below it, show the metric definition, period, comparison, and source in compact text. For a trend, use a line chart when the sequence over time matters; use a small table when exact values or several categories matter more than the shape of the trend.
Illustrative data-to-slide example: an early-stage subscription company’s approved pack says activation increased from 35% to 42% month over month, paid conversion stayed at 8%, and the sample contains 120 new sign-ups. A suitable title is “More new users reached activation; paid conversion was unchanged.” Show the two monthly rates in a clearly labeled chart or table, include the 120-sign-up sample size, and note that the company has not established whether the onboarding change caused the increase. Do not let the slide say “onboarding drove growth” unless the team has evidence for that causal claim.
Report a miss with a testable next step
If a milestone slipped, state what was planned, what happened, what the team learned, and the corrective action with an owner and review date. The following is illustrative wording, not a sourced quotation:
“We planned to launch self-serve billing in September; security review delayed release. The product lead is completing the remaining controls, with a revised launch target of October 18. We will report the launch status in the next update.”
Check charts against their underlying tables: dates, units, totals, labels, and axis scales. Avoid truncated axes that exaggerate small changes, and do not compare different cohorts as if they were identical. Keep slides readable when viewed in an email preview or on a phone: use one main point per slide, short labels, and a takeaway that does not depend on tiny footnotes. Ask a colleague who did not build the deck to identify the main result, biggest risk, and investor ask; if they cannot, simplify the slide.
Verify Numbers, Claims, and Confidentiality Before Sharing
Use named reviewers and a recorded sign-off, rather than relying on a final general read-through.
Run a short, owned approval pass
Assign review by data area: finance owns cash, burn, runway, and revenue; the product or analytics owner checks product metrics; the executive responsible for the update approves narrative, risks, and asks. Legal or other internal review may be appropriate for fundraising statements, forward-looking claims, or disclosures under your company’s policies. This process does not replace company-specific legal or regulatory advice.
- Each owner checks their slides against the approved source and flags unresolved discrepancies.
- The deck editor resolves flags with the owner or marks the figure as provisional; do not silently choose a convenient value.
- The responsible executive approves the final narrative and external asks.
- Record the version, approval date, and reviewers in the file name or a simple review log.
- Check the distribution list and file permissions for the actual sharing method. Share only information each recipient is entitled to receive.
Before sending, inspect the exported PPTX or PDF, including charts, page breaks, and notes. For a link, test access using the intended recipient setting; for an attachment, confirm that the correct version is attached and that hidden comments or unnecessary sensitive details are removed.
Send the Update and Improve the Next Cycle
Send the right format to the right recipients, then capture follow-ups without changing the underlying facts.
Send and track investor follow-up
Use email when the update is brief or a single ask matters; attach or link a deck when readers need to compare trends or follow several workstreams. Include the reporting period, one-sentence headline, and any time-sensitive request. For example, “Could you introduce us to two finance leaders at mid-market retailers by October 20?” is more actionable than “Please help with sales.” Confirm recipient permissions before sharing confidential material.
Keep a simple follow-up log with four fields: question or ask, investor, internal owner, and due date. For instance, assign a request for a pricing benchmark to the commercial lead with a response date, rather than leaving it in an email thread. Send the answer to the relevant recipients and avoid forwarding information more widely than intended.
Carry forward the process, not stale assumptions
After the update, note which slides prompted questions or required clarification. Keep the recurring structure and metric definitions where they remain valid, but update commitments, risks, source dates, and assumptions each cycle. If the business changes or a metric definition must change, explain the change rather than preserving a misleading comparison. This makes the next update easier to assemble without turning the template into a substitute for judgment.