A quarterly business review takes time because the hard work is reconciling KPI sources, explaining what changed, and agreeing on decisions. This guide follows one example—an internal SaaS customer-success review for Q3—so you can see how AI can help draft the deck while a human checks the evidence and owns the conclusions.
1. Define the audience and assemble trusted inputs
Set the meeting’s purpose first, then prepare a source pack the AI can use without guessing.
This example is an internal review for a SaaS company’s customer-success and revenue leaders. The goal is to understand renewal performance, review qualified pipeline, and agree on Q4 follow-up. A customer-facing QBR needs a different source pack and approval path: focus on that customer’s outcomes and shared priorities, and exclude internal forecasts, account risk commentary, and other customers’ information.
Prepare and reconcile the source pack
- Name the system of record. For each KPI, identify the report or data owner authorized to confirm it. Do not let a presentation export silently become the source of truth.
- Align periods and definitions. Confirm the quarter dates, eligible population, units, and calculation method. Here, Q3 means July 1–September 30, 2026, and QoQ means comparison with Q2 2026.
- Reconcile conflicts before prompting. If a dashboard and a finance report disagree, check refresh dates and definitions with their owners. Record which value is approved; if the conflict remains unresolved, mark it “needs confirmation” rather than choosing the more convenient number.
- Flag gaps and assign owners. Keep missing values blank—not zero—and note who can resolve each gap. Separate approved facts from estimates and hypotheses.
Use a compact metric register to make those decisions visible:
| Metric | Definition and period | Target / actual | Comparison | Source / owner |
|---|---|---|---|---|
| Renewal rate | Renewed accounts / eligible accounts, Q3 2026 | 92% / 89% | Q2: 91%; down 2 percentage points | CRM renewal report / CS Ops |
| Qualified pipeline | Sales-accepted pipeline, Q3 2026 | $1.2m / $1.1m | Q2: $1.02m; up about 7.8% (rounded to 8%) | CRM pipeline report / Sales Ops |
These figures are illustrative, not benchmarks. In this example, the renewal rate is 3 percentage points below target and 2 points below Q2; pipeline is $100,000 below target despite growing about 7.8% from Q2. That distinction gives the review a useful starting point without implying that pipeline growth has solved the renewal gap.
Privacy check: Remove personal or confidential customer information unless your organization has approved the specific tool and its data-handling terms for that material. Check access, retention, and review requirements before uploading files; use aggregated or redacted data where possible.
2. Build a decision-led QBR outline
Build the story around the meeting’s decision: what happened, what the evidence shows, and what the group should do next.
Ask AI for an outline only after the audience, purpose, and source pack are clear. Slide count is an editorial choice, not a benchmark: for a 30-minute review with one or two decisions, start with roughly 6–8 discussion slides and leave time for questions. A 60-minute review with several workstreams may need 8–12. Put detailed account lists, definitions, and reconciliations in an appendix unless the room needs them to make a decision.
For the Q3 example, a concise narrative could be:
- Opening and decisions: Q3 renewal rate missed target; agree on the Q4 recovery focus.
- Scorecard: show target, actual, and Q2 comparison for renewal rate and qualified pipeline.
- Renewal evidence: identify the accounts or segments behind the gap, using an approved breakdown.
- Pipeline context: show the growth and the remaining gap to target without treating pipeline as closed revenue.
- Risks and hypotheses: separate confirmed drivers from explanations still being tested.
- Q4 actions and decisions: assign owners, dates, and success measures; move detailed tables to the appendix.
One finding-to-decision chain might read: Metric: Q3 renewal rate was 89% against a 92% target. Evidence: the approved CRM report shows 91% in Q2. Implication: performance declined by 2 percentage points and remains 3 points below target. Decision to discuss: approve a focused review of at-risk renewals before setting a recovery target. Do not claim a specific cause until the account-level evidence supports it.
Use conclusion-style titles that state the finding and its limits. “Renewal rate fell to 89%; account-level review needed to confirm drivers” is more useful than “Renewal rate.”
3. Write a prompt that gives AI the right constraints
Give the tool a defined audience, approved inputs, and explicit rules for handling uncertainty—then revise its draft.
Include the meeting goal, period, metric definitions, comparison basis, required sections, and what the model must not infer. For the example above, a filled-in prompt could be:
“Draft an outline for a 30-minute internal Q3 2026 review for customer-success and revenue leaders. The goal is to understand renewal performance and agree on Q4 follow-up. Use only the approved metric register and source files. Q3 is July 1–September 30; compare with Q2 where supplied. Renewal rate: target 92%, actual 89%, Q2 91%; definition is renewed accounts divided by eligible accounts. Qualified pipeline: target $1.2m, actual $1.1m, Q2 $1.02m. Show the calculation basis and distinguish percentage points from percent change. State what each metric does and does not establish. Do not infer causes or invent account-level evidence. Mark unsupported explanations and missing information ‘needs confirmation.’ Suggest 6–8 discussion slides, with detailed tables in an appendix, and end with decisions and an action register.”
A plausible first-draft error would be: “Renewal performance fell because customer adoption weakened.” The source pack contains no adoption data, so that is an unsupported causal claim. Follow up with a targeted instruction: “Remove the adoption explanation. State only that renewal rate fell from 91% to 89%; label causes as unconfirmed and add a request for an approved account-level renewal analysis before the Q4 recovery plan is finalized.” Edit or reject the outline if it continues to invent a driver or blurs target, actual, and comparison periods.
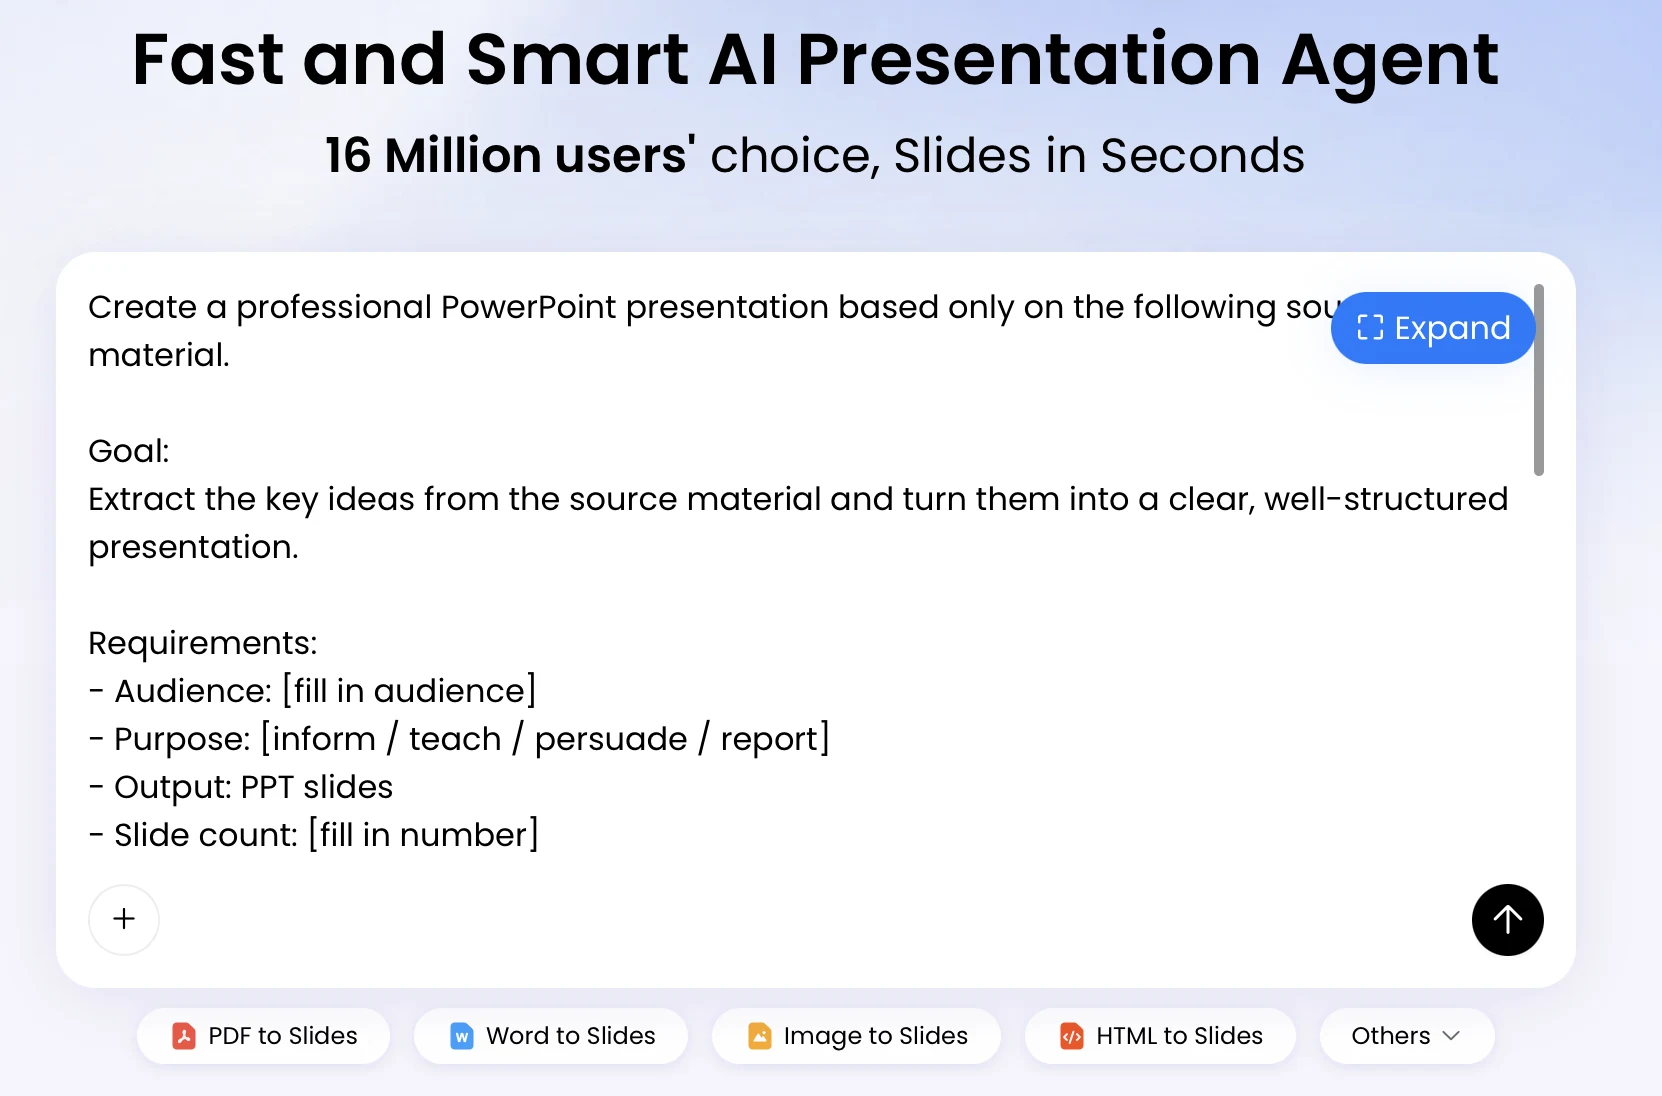
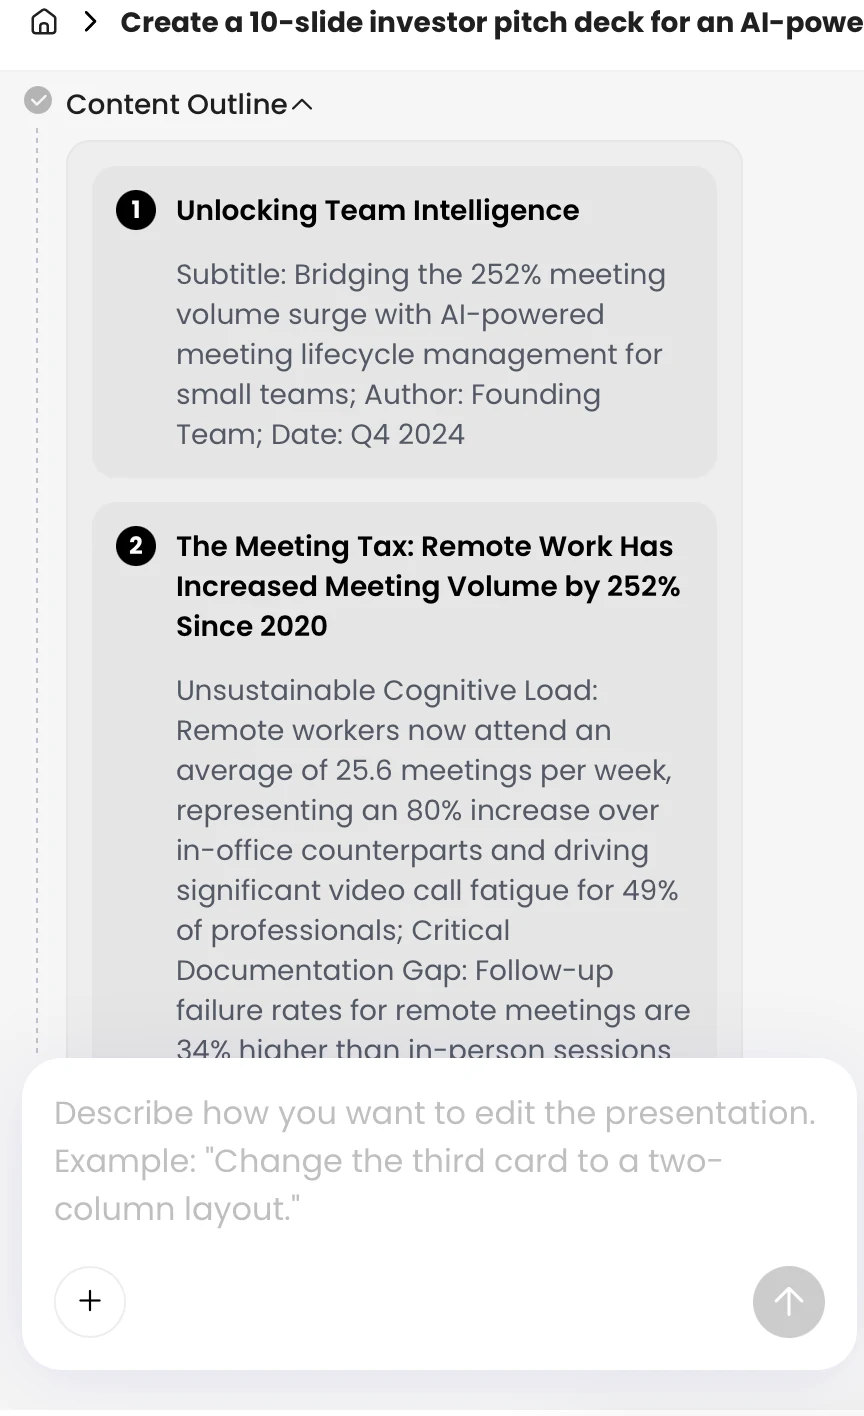
A workflow such as PopAi AI Presentation can be used to start from a prompt or from file inputs available in the current product version. Upload and conversion options can vary by format, plan, or release, and imported layout or chart context may not be preserved exactly. Keep the original source open and compare important figures and formatting rather than assuming conversion is lossless. For a broader comparison of workflow options, see AI presentation makers.
4. Generate, edit, and visualize the quarterly review slides
Generate from the reviewed outline, then take one slide from draft to checked, presentation-ready version.
Turn a draft finding into a clear slide
Suppose the generated slide is titled “Renewal Rate” and shows 89% without a target or comparison. That slide names a metric but does not help the room judge performance. First, verify the values in the metric register. Then revise the title to “Q3 renewal rate was 89%, 3 points below target and 2 points below Q2.” Show the 92% target and the Q2 91% comparison, label the period and definition, and add a note that the cause has not yet been confirmed. The resulting slide communicates the gap without overstating why it happened.
Choose a visual based on the question. A line chart is useful for a consistent time series with enough periods to reveal a pattern; two quarterly points rarely justify a trend claim. A bar chart can compare target with actual or compare segments using the same definition. Avoid pie charts when precise comparisons matter, and avoid dual axes if they could make unrelated measures appear to move together. If the point is a single gap, a clearly labeled number and target marker may be easier to read than a chart.

Product chart controls and import/export options can change by version or plan. When editing chart data, check the labels, units, category order, and whether the chart still reflects the intended comparison. If imported chart values do not match the source, replace or correct them from the approved register; do not try to fix a misleading visual by changing the narrative alone.
- Use a readable font size, direct labels where practical, and adequate contrast.
- Keep the title, chart, and annotation focused on one takeaway.
- Check that colors do not carry meaning by themselves; use labels or patterns where needed.
- Open the exported PPTX or PDF and inspect the rendered slide for clipping, shifted objects, and illegible labels.
5. Verify every number, interpretation, and sensitive detail
Use a documented validation pass for material figures, and get the relevant data owner to approve any unresolved or consequential metric.
Recalculate and record material figures
For the sample renewal rate, the change from Q2 to Q3 is 89% − 91% = −2 percentage points. The relative percent change is (89% − 91%) ÷ 91% × 100 = about −2.2%. Those describe different things; use percentage points when comparing two rates unless the audience specifically needs relative change. For pipeline, ($1.10m − $1.02m) ÷ $1.02m × 100 is about 7.8%, rounded to 8% in the register.
This example also shows why a favorable movement should not hide a shortfall: pipeline increased from Q2 but finished $100,000 below its $1.2m target. A slide should display both comparisons if both matter to the decision.
Keep a lightweight audit record for figures that drive decisions:
| Metric | Source and definition | Calculation / status | Reviewer | Approval |
|---|---|---|---|---|
| Renewal rate | CRM renewal report; renewed / eligible accounts | 89% Q3 vs. 91% Q2; −2 percentage points | CS Ops analyst | Approved for internal review |
| Qualified pipeline | CRM pipeline report; sales-accepted value | $1.10m vs. $1.02m; +7.8%, rounded | Sales Ops analyst | Confirm report refresh date |
Prioritize figures that support a decision, headline, forecast, or external commitment for owner approval. For estimates, label the method and date, identify the owner, and avoid presenting an estimate as a confirmed actual. If a source is revised after approval, note the revision date, update affected slides, and rerun the checks. When two sources remain in conflict, show neither as settled fact until the accountable owner resolves it.
“A change occurring alongside another change is not, by itself, proof that one caused the other.”
In the Q3 example, if acquisition cost rose 15% while campaign mix also shifted, report both observations but do not say the mix caused the increase without supporting analysis. Ask the analyst to compare acquisition cost by channel and period, check for spend and attribution-definition changes, and explain any limitations before using a causal claim.
- Check source, calculation, definition, period, and units for each material KPI.
- Mark estimates and hypotheses; remove unsupported claims or assign them for follow-up.
- Check audience permissions and remove customer identifiers or internal-only commentary where inappropriate.
- Confirm the exported file still displays the approved values and readable charts.
6. Tailor the deck and turn the review into follow-through
Keep the underlying facts consistent across versions, but tailor the detail and control who approves each one.
For an internal management deck, include renewal risks, forecast implications, resource constraints, and cross-functional actions. For a customer-facing QBR, use only that customer’s approved outcomes, adoption information, open issues, and shared priorities. Create separate files from a controlled source—not by casually deleting slides from the internal deck—and label them clearly, for example “Internal Q3 Review” and “Customer QBR.” Assign a named reviewer to check the external version for confidential commentary, other customers’ data, internal forecasts, and speaker notes before it is shared.
Run the meeting and track commitments
For a 30-minute example review, reserve about 5 minutes for the scorecard, 10 minutes for evidence and risks, 10 minutes for decisions, and 5 minutes to confirm owners and dates. Treat that as a starting run-of-show, not a fixed formula; shorten the presentation if discussion is the priority. Capture any changes to actions live, circulate the approved register after the meeting, and check progress before the next quarterly review.
Use actions with a named owner, due date, and observable completion measure. In this illustrative Q3 2026 review, Q4 follow-up dates are in October 2026:
| Action | Owner | Due date | Success measure |
|---|---|---|---|
| Review renewal-risk accounts and document a recovery plan | Customer Success lead | Oct. 15, 2026 | Approved plan and next step recorded for each identified at-risk account |
| Confirm qualified-pipeline report refresh and calculation | Sales Ops analyst | Oct. 20, 2026 | Source date and approved calculation documented |
At the next review, mark each commitment complete, overdue, or superseded and record the evidence—not just a status label. Useful process checks include action completion rate and whether the agreed outcome improved. Preparation time can also be tracked, but faster drafting alone does not show that the review led to better decisions.
7. Final checklist for a quarterly review presentation with AI
Use this pre-send sign-off to separate required approvals from optional polish.
- Mandatory — data owner: approve material figures, definitions, periods, calculations, and any estimates or unresolved conflicts.
- Mandatory — deck owner: confirm that claims are supported, decisions are clear, and actions have owners, dates, and measures.
- Mandatory — audience reviewer: approve privacy, confidentiality, and the correct internal or external version.
- Mandatory — presenter: inspect the exported file for incorrect values, missing context, clipping, or unreadable charts.
- Optional polish: refine visual hierarchy, shorten dense text, and move supporting detail to the appendix.
AI can help turn a reconciled source pack into a workable first draft. The review is ready only when a person has checked the evidence, approved the version for its audience, and made the next actions explicit.