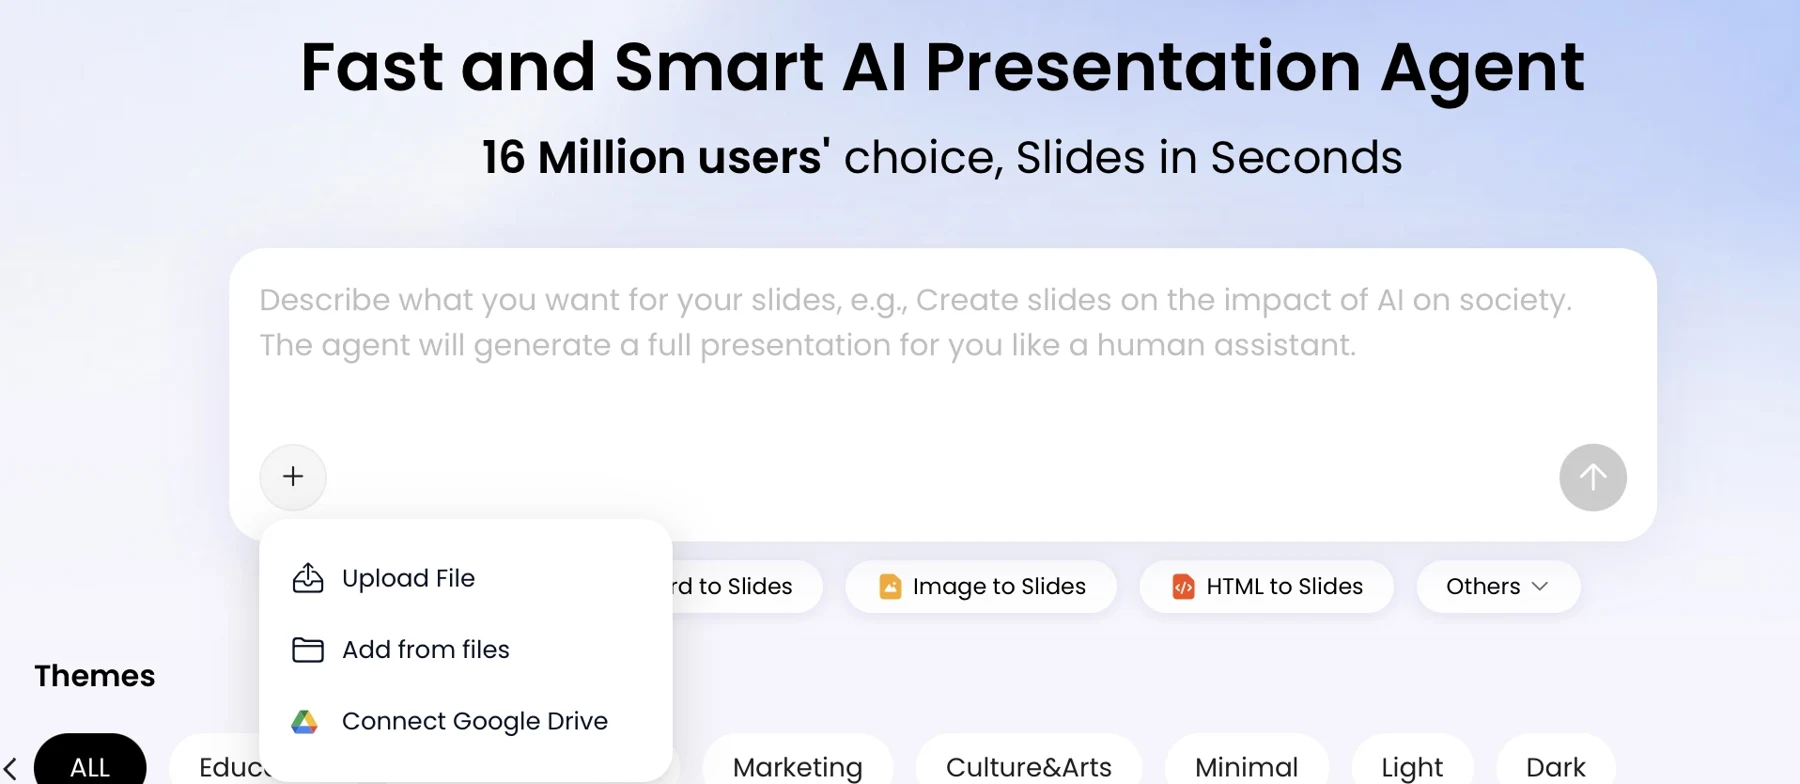
When project facts live in spreadsheets, task trackers, and meeting notes, AI can help turn them into a first draft—but it cannot decide which source is authoritative or approve the status for you.
This workflow is for project managers and team leads starting with current project records and ending with a fact-checked draft for review. You will need the reporting period, approved baseline, latest schedule and budget figures, risks and actions, and the people responsible for confirming them. The worked example below uses fictional project data to show how an input becomes an outline and a corrected slide. Allow time for source checks: an AI-generated deck is a draft, not stakeholder-approved reporting.
1. Define the audience before you make a project status presentation with AI
Choose the information and level of detail according to who can act on the update and what the meeting must decide.
Before drafting, note the meeting purpose, attendees, duration, and decision authority. A delivery team may need task-level blockers and owners; a client may need deliverable impacts and agreed actions; executives may need the forecast, material trade-offs, and decisions they are authorized to make. If audiences are mixed, lead with the shared outcome and decision, then put operational detail in an appendix or a separate team version.
| Audience | Main emphasis | Useful starting format |
|---|---|---|
| Project team | Next tasks, dependencies, blockers, and named owners | One-page update for a routine sync; a short deck if several dependencies need discussion |
| Client | Deliverables, timeline impact, open questions, and agreed actions | Brief, plain-language review aligned to the client’s reporting rules |
| Steering committee | Overall health, forecast, material risks, and decisions required | A concise core deck with supporting detail in an appendix when needed |
Use slide count as a planning aid, not a rule. A one-page update can work for a short weekly check-in; a 5–10-slide deck may suit a broader review with several decisions; a long meeting may need an appendix rather than more detail on every core slide. Confirm client or organizational templates before choosing a format.
Set the reporting period and comparison baseline too. “60% complete” is ambiguous unless the deck says whether that means tasks closed, milestones achieved, weighted progress, or a team estimate. Label the as-of date and distinguish actuals, forecasts, and targets.
Lead with the implication: “The launch forecast moved by two weeks because testing is blocked,” rather than making the audience infer the news from a task list.
2. Prepare project data and set rules for status colors
Before asking AI to summarize status, reconcile the reporting cut-off, source, and definition for each important figure.
Build a small, traceable source pack
Gather the latest approved schedule, milestone dates, budget or cost report, KPI definitions, risk and issue log, decisions, and action items. Create a compact source register rather than pasting disconnected numbers into a prompt. Keep the file name, version, reporting date, owner, and metric definition alongside each figure.
| Metric | Baseline | Current / forecast | As of | Source and owner | Status rule |
|---|---|---|---|---|---|
| UAT start | 20 May approved baseline | 3 June - unconfirmed scenario; pending schedule-owner confirmation | 16 May | Working estimate, not an approved forecast; baseline from schedule v12 | At risk / forecast pending. Apply slip thresholds only after a forecast is approved. |
| Estimate at completion | $200,000 approved budget | $208,000 forecast | 16 May | Cost report, period ending 16 May; finance lead | Amber at 3–5% over baseline; red above 5% |
Illustrative data check: The cost forecast is $8,000, or 4%, above the $200,000 baseline, so it is amber under the example rule above. These thresholds are not universal; confirm approved tolerances, scope, currency, and cut-off with the project’s governance owner. If a dashboard shows a different forecast, compare its version and refresh date with the cost report and ask the owner to reconcile them—do not silently select the more convenient number.
When measures disagree, report what each measures. For example, eight of ten milestones complete is an 80% milestone count, but it may not mean the project is 80% complete if the remaining milestones carry more work. Use the approved progress method, state its denominator, and flag missing or stale data. If no method has been approved, say so and seek agreement before using the metric as an overall progress claim.
Define RAG rules before assigning colors
Agree on tolerances before assigning red, amber, or green (RAG). A schedule with a fixed regulatory date may need tighter thresholds than a flexible internal project. Write the rule where reviewers can find it, and do not average health dimensions into a reassuring overall green. If schedule is red and budget is green, show both; use the project’s governance rule for overall status and include the trend, cause, owner, and response.
3. Write a prompt that makes the project status presentation with AI useful
Give the AI a defined audience, source boundary, approved status rules, and an instruction to surface gaps instead of filling them.
Set the prompt and source limits
If you use PopAi AI Presentation, check its current documentation and your plan for supported inputs and workflow options; features and file handling can change. The same prompt discipline applies in other AI presentation makers: provide a clean source pack, preserve source references, and review the outline before generating slides.
Use a prompt like this, replacing bracketed details with confirmed information:
“Create a [number]-slide project status presentation for [audience] for the period ending [date]. The meeting purpose is to [inform, secure a decision, or escalate]. Use only the supplied source materials. Organize the deck as: executive summary; plan versus actual; completed milestones; KPIs and budget; risks, issues, and dependencies; decisions required; next-period plan. Apply these RAG rules: [approved thresholds]. Label facts, forecasts, risks, and recommendations separately. For each risk or action, include impact, owner, next step, and due date only when supplied. Do not invent metrics, causes, dates, owners, or decisions. Flag missing or conflicting data and identify the source needed to resolve it. Add a source note for each key figure.”
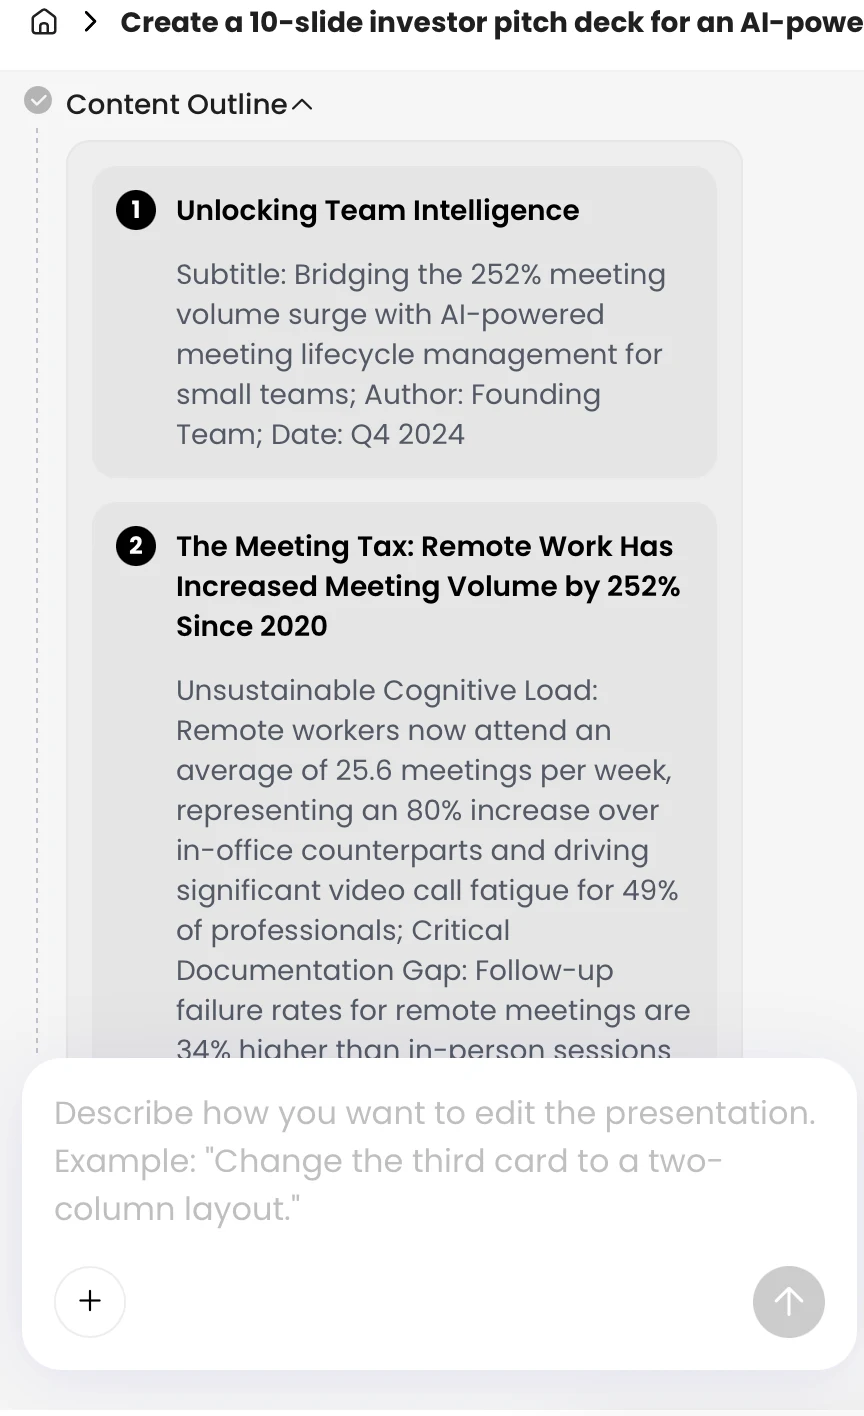
Review the outline before generating slides
For a worked example, suppose a fictional CRM launch has an approved schedule showing UAT on 20 May, while the latest issue log says the test environment is unavailable and the vendor has not confirmed a recovery date. The prompt should produce an outline item such as: “Schedule: UAT forecast at risk; confirm the current forecast with the schedule owner. Source conflict: dashboard date not aligned with approved schedule.” It should not state that the vendor caused a two-week delay unless a source confirms both the cause and the forecast.
If the tool presents a confident but unsupported cause, ask it to revise: “Remove any cause or date not explicitly stated in the sources. Show the conflict, name the source documents and dates, and mark the item ‘owner confirmation required.’” If the output does not preserve citations reliably, add source IDs to your source pack and manually map each claim to its file and row or section before drafting the final deck.
Adjust slide count to the meeting. Review the proposed outline first, combine duplicate topics, and move supporting detail to an appendix. This is usually easier than correcting a fully generated deck whose structure already gives low-priority details too much space.
4. Generate the slides, then shape the story around decisions
Turn the reviewed outline into a decision-focused draft, then check that each slide’s wording and visual match the evidence.
Build the narrative around the meeting
A practical sequence is executive summary and overall health; progress against the baseline; completed milestones; KPIs or budget; top risks and blockers; decisions requested; and next-period actions. Keep a detailed risk register, task list, and calculation notes in an appendix or source file. When using a presentation tool, confirm its current input, editing, and export options rather than assuming every format or feature is available on your plan.
Work one slide from source to verified wording
Fictional CRM launch example: The approved schedule (v12, 16 May) lists UAT start as 20 May. The issue log (16 May) records that the test environment is unavailable and says the vendor recovery date is pending. An older dashboard, last refreshed 9 May, lists 27 May. The latest approved schedule and issue log do not establish a new UAT date, so the dashboard should be flagged as stale rather than blended into the forecast.
An AI draft might say, "Vendor delay pushes UAT to 3 June." That statement overreaches. As of 16 May, the approved baseline is 20 May, the test environment is unavailable and the vendor recovery date is pending. A safe slide says: "UAT is at risk; the approved forecast is pending. 3 June is only an unconfirmed scenario from a working estimate, not the approved schedule. Schedule owner: review the estimate by 17 May." The 17 May date is a requested review date, not a confirmation that has already happened. No vendor-caused two-week delay is established.
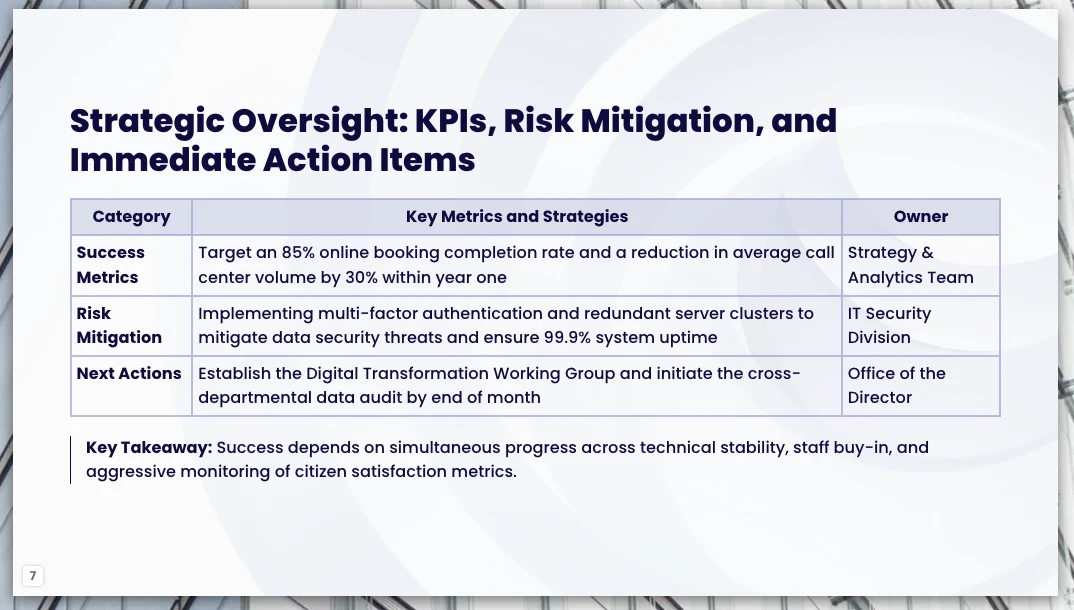
Choose a visual that answers the slide’s question. Use a baseline-versus-forecast timeline for date movement, a trend chart when several reporting periods matter, and a compact risk table when owners and mitigations are the focus. Show the baseline and forecast distinctly, label the as-of date, and avoid a dramatic red treatment for a small variance unless the approved threshold makes it red. After changing chart data, recheck values, labels, units, and scale.
Make the decision request explicit
When a project is red or amber, state the known impact and response without converting an estimate into an approved forecast. In this example: "The test environment is unavailable. UAT is at risk and the approved forecast is pending. The schedule owner is asked to review the working estimate by 17 May." Keep the 20 May baseline and 16 May as-of date visible. Do not promise a revised launch date before the recovery option and schedule have been approved.
5. Verify figures, sources, and confidentiality before sharing
Use a claim-by-claim review log so a second reviewer can trace important statements back to evidence.
AI can misread a table, blend reporting periods, or turn a tentative forecast into a firm commitment. Keep the source pack beside the deck and record what was checked, by whom, and when. For claims that cannot be independently recalculated, document the source owner’s confirmation rather than treating the model’s summary as evidence.
- Trace: give each key slide claim a source file, version or reporting date, and a page, row, or section reference.
- Recalculate: confirm variance, completion, burn rate, and forecast formulas against the approved baseline; record the formula and inputs if another reviewer cannot reproduce the calculation from the slide.
- Reconcile: compare conflicting sources by authority and freshness, then ask the accountable owner to resolve the difference. Mark unresolved items as unconfirmed.
- Check definitions and dates: verify KPI names, units, scope, RAG tolerances, and a common reporting cut-off.
- Confirm actions: validate each risk, decision request, owner, and due date with the responsible lead.
- Protect information: before uploading anything, check organizational AI-use rules and the tool’s current data-handling terms, including retention, access, and reuse. Do not upload confidential, personal, client, or commercially sensitive files unless the service and your organization explicitly permit it. Redact or replace sensitive details, use approved access controls, and share only the minimum material needed.
Measurement check: A slide that says “milestones are 80% complete” should identify the denominator—for example, eight of ten approved milestones completed as of 16 May—and whether the count is weighted. If milestone sizes differ, use the approved weighted method or label the figure as a simple count, not overall project completion.
6. Present, export, and reuse the update next time
Prepare for questions and preserve version history so the next update starts from current evidence, not last cycle’s assumptions.
Before the meeting, rehearse a short summary: current status, what changed, the largest risk, and the decision needed. For each red or amber item, prepare the source, impact, response, and next checkpoint. Anticipate questions such as “What changed in the forecast?” and “Who confirmed that date?” If an answer is unknown, say so and identify who will follow up. If someone disputes a status live, separate the agreed fact from the disputed interpretation, record the question, and confirm the source after the meeting rather than changing a figure without checking it.
When the content is approved, check the presentation tool’s current export and sharing options for your plan and workflow. Review the exported file—not just the editor—for chart labels, page breaks, fonts, and layout changes. Confirm file permissions, recipient access, and organizational sharing requirements before distribution; do not assume a shared link is private, public, permanent, or restricted in the way you intend.
For the next cycle, duplicate the approved structure but refresh every source and reporting date. Save each approved deck with a clear period and version, retain the prior version for comparison, and record authorized baseline or scope changes separately. Recheck assumptions and open actions rather than carrying them forward automatically. A reusable template should save formatting time, not bypass verification.