Best Event Recap Templates for AI Tools
Published on August 25, 2026
If you just finished a 500-person product launch, a sponsor-heavy conference, or a leadership offsite, the recap deadline usually arrives before the source files are clean. Registration exports live in one folder, survey comments in another, sales feedback in Slack, sponsor proof in screenshots, and photos in a shared drive. The best event recap presentation templates for AI tools solve that operational mess by giving the AI a repeatable structure: what to summarize, what to quantify, what to verify, and what decision the deck should support.
This guide is built for event marketers, field marketing managers, HR program leads, sales enablement teams, nonprofit fundraisers, and operations leaders who need more than a pretty highlight reel. You will get use-case templates, slide-by-slide outlines, prompt examples, KPI formulas, QA checks, and a practical comparison workflow for choosing an AI presentation tool. The examples reference PopAi because this site publishes PopAi content, but the template logic applies equally to PowerPoint Copilot, Canva, Gamma, Tome, Beautiful.ai, Google Slides/Gemini, Pitch, Plus AI, and other deck-generation tools.
Fast path: If you already have a survey report, agenda, event brief, photos, or an old recap deck, start by asking your AI tool to create a recap outline before generating slides. In PopAi, that means uploading the source files, choosing a business-style template, and reviewing the proposed structure before you accept the full deck.
What Makes the Best Event Recap Templates for AI Work?
A recap template is useful only when it turns raw event evidence into a decision-ready story.
A weak recap slide says, “The keynote was well attended,” with a full-bleed photo and no context. A stronger AI-ready slide says, “The keynote created the highest buying-intent signal of the day,” then shows attendance versus capacity, average session rating, number of demo requests, and two verbatim attendee comments. The difference is not design polish; it is the connection between claim, evidence, and next action.
Think of an event recap deck as a decision record: it should tell stakeholders what was promised, what happened, what changed, and what the team should do differently next time.
When using AI, structure matters because a vague prompt such as “make an event recap” often produces the same generic sequence: agenda, highlights, photos, thank-you page. A strong template gives the AI the business logic. For example: slide three must compare target versus actual attendance, slide six must summarize audience feedback by theme, slide eight must separate sourced pipeline from influenced pipeline, and the final slide must ask for a decision about budget, follow-up, or renewal.
Score a recap template before you use it
- Audience fit: Does it answer the stakeholder’s question? Executives want decisions and tradeoffs; sponsors want proof of value; internal teams want owners and next steps.
- Evidence zones: Does it reserve space for attendance, engagement, satisfaction, cost, conversion, and qualitative feedback?
- Chart readiness: Does it suggest bar charts, funnel charts, scorecards, tables, or timelines instead of leaving the AI to invent visuals?
- Source traceability: Can you trace each number or quote back to a CSV, survey report, CRM export, or sponsor proof file?
- Actionability: Does the final section include recommendations, owners, dates, and decisions needed?
Balance story, proof, and decisions
- Story slides: event goals, narrative arc, attendee experience, speaker moments, testimonials, audience themes.
- Proof slides: registration target versus actual, show-up rate, session ratings, NPS, sponsor impressions, leads, pipeline, cost per attendee.
- Decision slides: lessons learned, risks, makegoods, budget implications, next event recommendations, follow-up owners.
For an executive recap, a practical mix is roughly 25% narrative, 55% evidence, and 20% decisions. For a sponsor recap, shift toward proof of deliverables and audience quality. For an internal offsite recap, reduce performance charts and expand the decision log, open questions, and accountability tracker.
Data analysis: A leadership-facing benchmark slide should include at least four comparisons: registration target versus actual registrations, confirmed RSVPs versus checked-in attendees, average session rating versus the previous event, and cost per attendee versus budget target. Use a grouped bar chart for target/actual comparisons, a funnel for registration-to-attendance conversion, and a small notes column explaining variance. Example: “Attendance was 8% below target, but director-level attendance was 17% above target, which increased lead quality.”
Best Event Recap Templates for AI by Use Case
For a broader view of available tools, compare the latest AI presentation makers before choosing the workflow that best fits your team.
Before you choose a workflow, compare the latest AI presentation makers against your recap requirements: source-file ingestion, editable charts, brand control, privacy, and PowerPoint handoff.
The best event recap templates for AI are not one-size-fits-all. A webinar recap needs funnel and engagement signals; a trade show recap needs lead quality and booth follow-up; a sponsor recap needs proof-of-placement; a company offsite recap needs decisions, owners, and safe handling of sensitive employee feedback.
1. Executive Event Recap Template
Best for: C-suite, finance, department heads, board pre-reads. Recommended length: 8–10 slides.
Slide sequence: snapshot, executive summary, goals vs. results, KPI dashboard, budget/ROI, risks, lessons learned, decision ask.
Use charts: KPI scorecard, target-vs-actual bars, budget waterfall, risk table. Sample title: “Product Launch Delivered Pipeline Quality, but Attendance Mix Requires Channel Adjustment.”
Prompt: “Create an executive recap for [event name]. Do not invent metrics. Use [KPI table], [survey export], and [CRM export]. Separate confirmed results from estimates. End with three decisions needed from leadership.”
2. Marketing Campaign Recap Template
Best for: demand generation, brand, content, lifecycle marketing. Recommended length: 10–12 slides.
Slide sequence: campaign objective, audience acquisition, channel mix, registration funnel, engagement, content performance, MQL/SQL conversion, pipeline, reuse plan, learnings.
Use charts: funnel chart, source-channel bar chart, content engagement table, conversion waterfall. Distinguish sourced pipeline from influenced pipeline and label the attribution window.
Prompt: “Build a marketing recap for [event name]. Segment results by acquisition channel, live attendees, no-shows, and replay viewers. Flag missing UTM or CRM fields instead of filling gaps.”
3. Webinar Recap Template
Best for: virtual events, product education, thought leadership, partner webinars. Recommended length: 7–9 slides.
Slide sequence: webinar objective, registration funnel, attendance and watch time, poll results, Q&A themes, replay engagement, lead routing, nurture recommendations.
Use charts: registration-to-attendance funnel, watch-time distribution, poll response bars, Q&A theme matrix. Include live attendees, no-shows, and on-demand viewers separately.
Prompt: “Create a webinar recap using [platform export] and [chat transcript]. Summarize Q&A into five buying-intent themes and recommend one nurture action for each segment.”
4. Trade Show or Conference Recap Template
Best for: field marketing, sales leadership, partner teams. Recommended length: 10–14 slides.
Slide sequence: event objective, booth traffic, meetings booked, lead-grade distribution, top accounts engaged, sales follow-up status, competitor observations, budget review, next-year recommendation.
Use charts: lead quality stack, meeting-status table, territory follow-up heatmap, competitor insight matrix. Separate badge scans from qualified conversations.
Prompt: “Build a trade show recap. Use [badge scan export], [meeting list], and [sales notes]. Classify leads as A/B/C based on title, company fit, buying timeline, and requested follow-up.”
5. Sponsor Value Recap Template
Best for: sponsors, partners, nonprofit funders, event revenue teams. Recommended length: 8–12 slides.
Slide sequence: sponsor objectives, audience profile, promised vs. delivered assets, proof-of-placement, engagement metrics, lead or exposure summary, testimonials, makegoods or renewal recommendation.
Use charts: sponsor scorecard, deliverables table, impression trend, proof screenshot gallery. Be conservative with media value calculations and explain assumptions.
Prompt: “Create a sponsor recap for [sponsor name]. Compare contracted deliverables with actual delivery using [sponsor log]. Include proof links, screenshots, and any underdelivery with proposed remedies.”
6. Internal Offsite Recap Template
Best for: HR, people teams, operations, leadership alignment. Recommended length: 8–11 slides.
Slide sequence: offsite purpose, agenda themes, participation, workshop outputs, decisions made, open questions, employee feedback themes, action register, follow-up cadence.
Use charts: decision log, action-owner table, sentiment theme map, timeline. Anonymize sensitive comments and avoid naming employees unless consent is explicit.
Prompt: “Create an internal offsite recap. Use [facilitator notes] and [anonymous survey]. Summarize sensitive feedback neutrally, remove personal identifiers, and create an action tracker with owners and due dates.”
Quick recommendation: use the executive template when the recap will drive budget approval; use the marketing template when attribution and campaign optimization matter; use the webinar template when engagement and nurture are the core questions; use the trade show template when sales follow-up quality is the risk; use the sponsor template when renewal or makegoods are on the table; use the offsite template when the recap must become an accountability document.
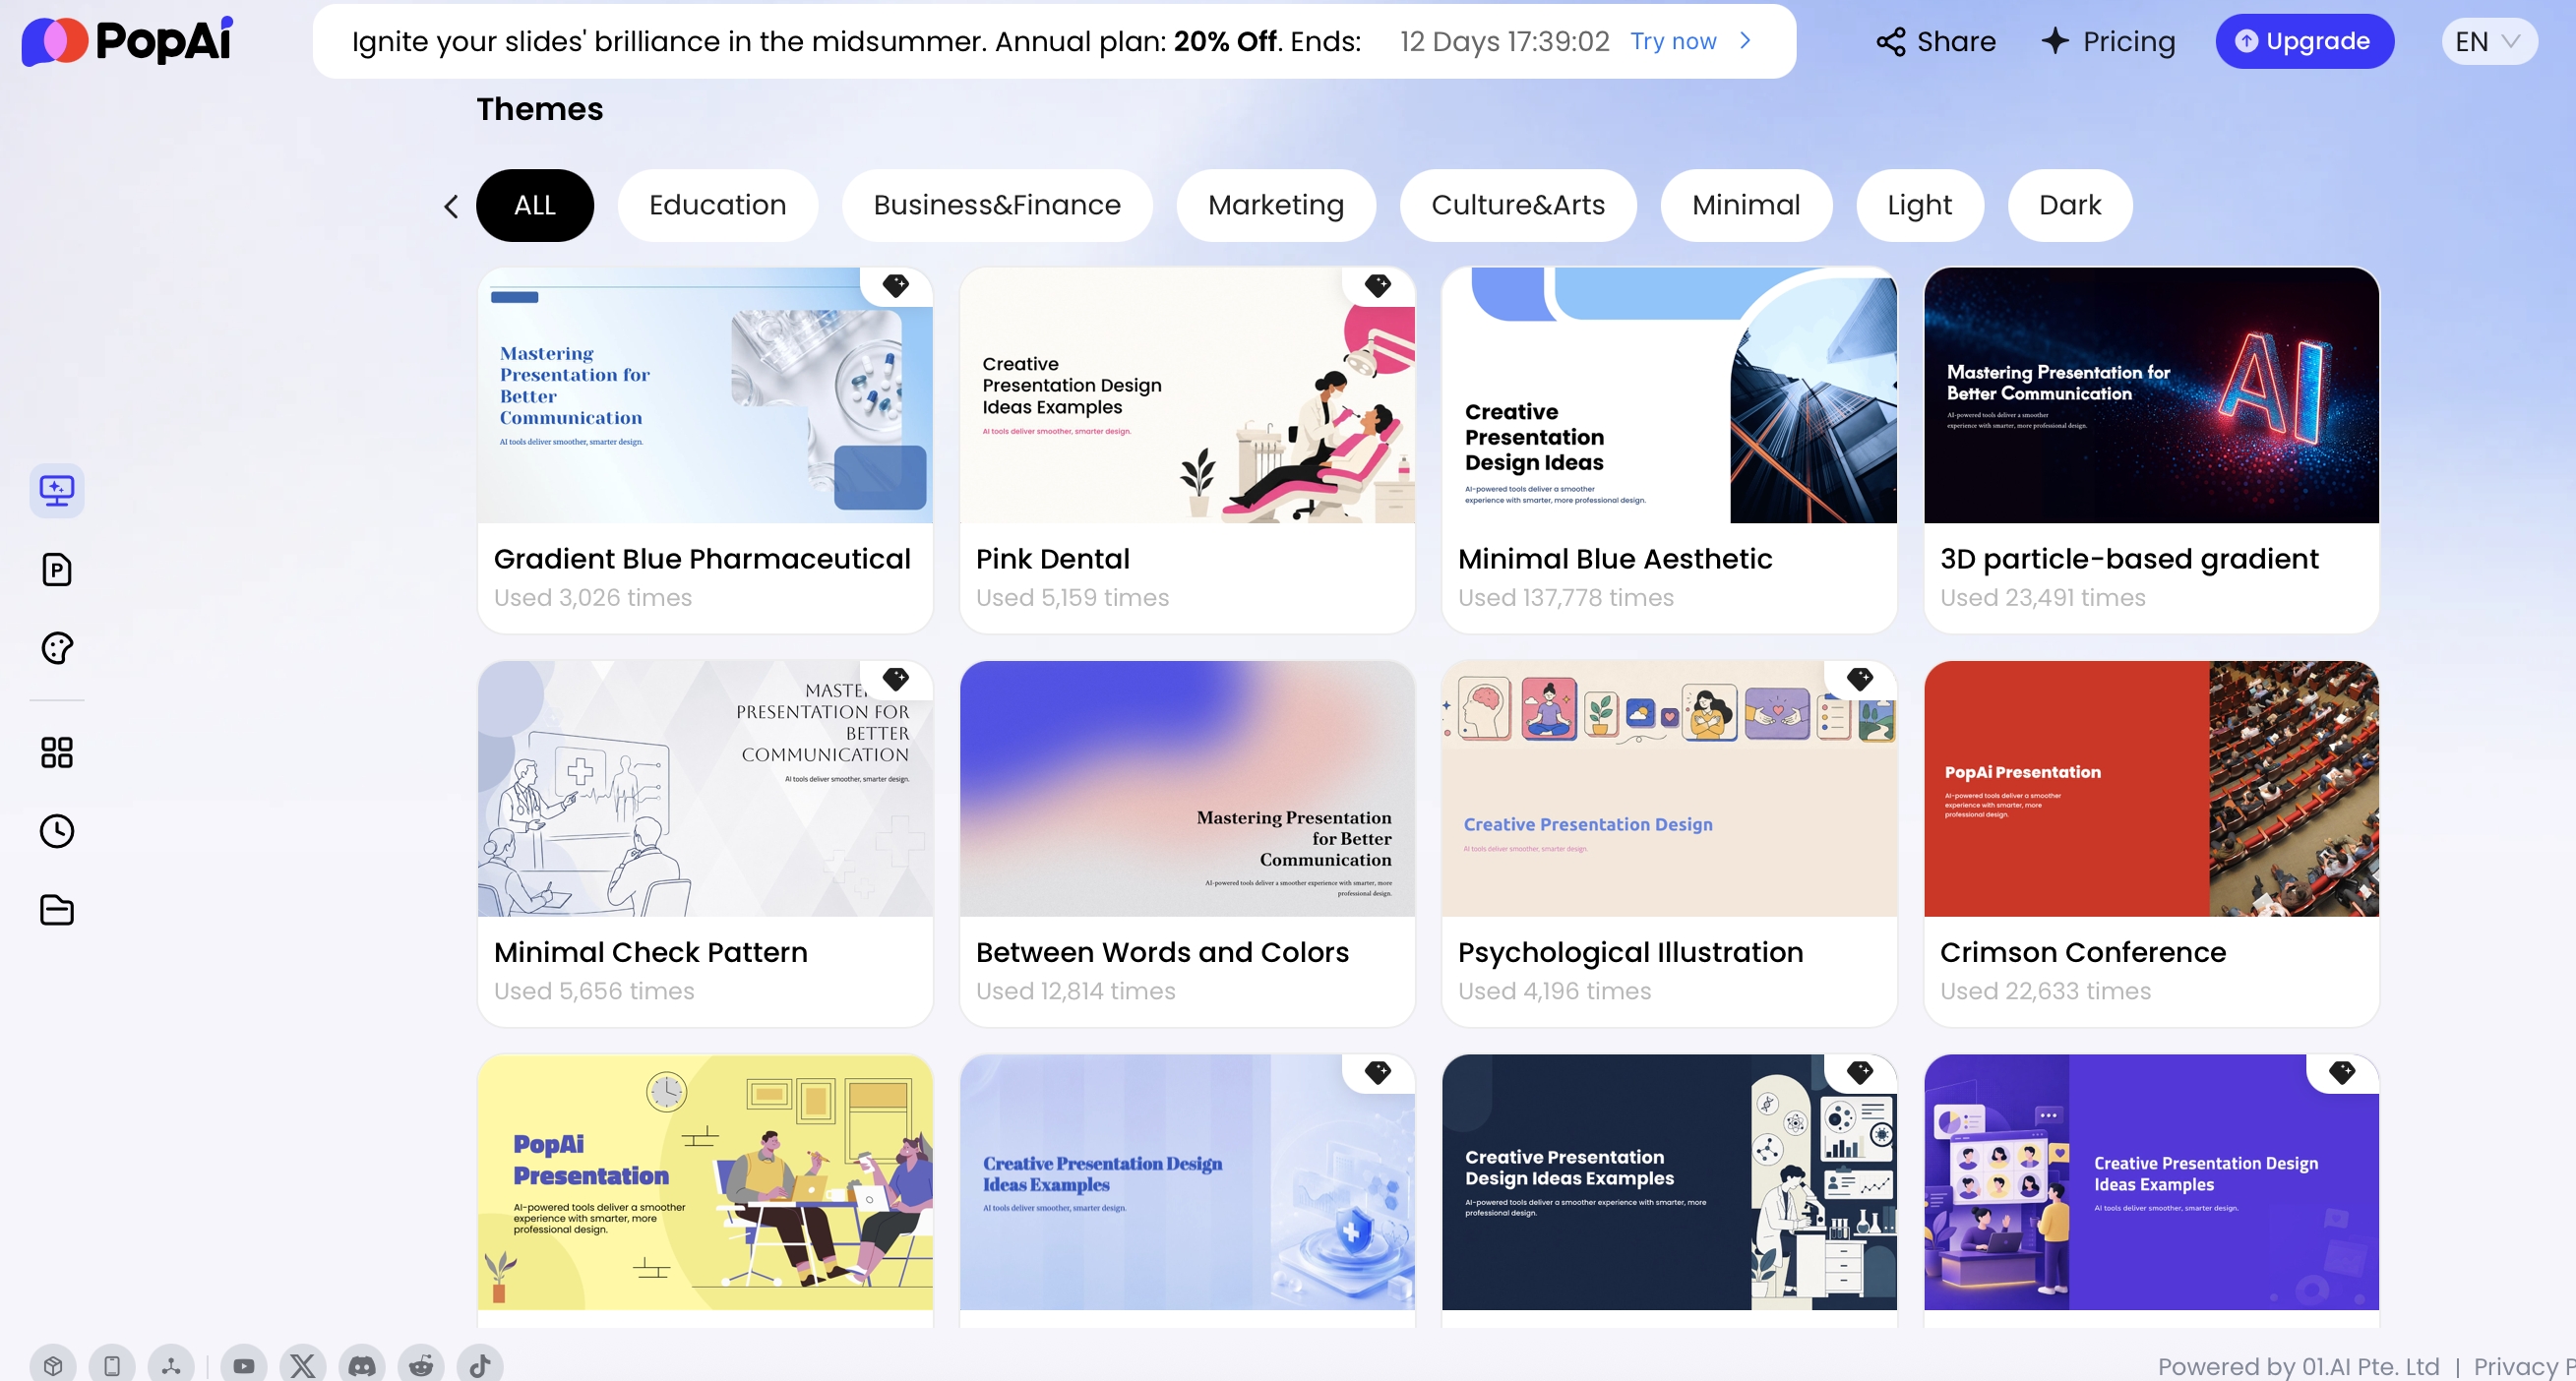
Template handling matters when a recap has to look like an internal board deck or a sponsor report. In PopAi AI Presentation, you can start from official templates, personal templates, or an uploaded PPTX template; in other tools, the equivalent may be a brand kit, theme, master slide, or imported deck. A practical use case: upload last year’s sponsor recap as the design reference, then ask the AI to update the structure with this year’s deliverable log, audience metrics, and proof screenshots. Always check whether fonts, chart styles, and section dividers survive export before sending the file to a sponsor or executive reviewer.
Slide-by-Slide Event Recap Template for AI
Use this structure when you need a reliable deck that can work for executives, marketing teams, sponsors, or cross-functional stakeholders.
8-slide fast recap for a same-week update
- Title and event snapshot: event name, date, location, audience, host, recap purpose. Layout: hero image plus four metric tiles.
- Executive summary: three outcomes, one key insight, one recommended action. Example title: “Event Met Pipeline Goal but Needs Stronger Executive Attendance.”
- Goals versus results: registration target, actual attendance, engagement, satisfaction, revenue or pipeline. Chart: target-vs-actual scorecard.
- Agenda and session highlights: top sessions, speaker themes, content that resonated. Watchout: do not let AI rank sessions without ratings or attendance data.
- Audience insights: attendee segments, feedback themes, NPS, testimonials. Chart: segment bar chart plus quote panel.
- Business impact: leads, opportunities, sponsor value, cost per attendee, ROI estimate. Split this slide if you need separate revenue, sponsor, and budget views.
- Lessons learned: what worked, what did not, operational improvements. Layout: continue / stop / change table.
- Next steps: follow-up campaigns, owner list, deadlines, next-year recommendations. Layout: action tracker with owner, due date, expected impact.
15-slide board-ready recap with appendix discipline
- Cover and decision context: name the decision the board or leadership team is being asked to make.
- One-page executive summary: outcome, evidence, risk, recommendation.
- Event objectives and success criteria: what was approved before the event.
- Audience and attendance performance: registration, attendance, segment quality, no-show rate.
- Engagement and content performance: session ratings, participation, replay or content usage.
- Customer, sponsor, or employee feedback themes: positive signals and recurring concerns.
- Commercial impact: leads, meetings, opportunities, donations, renewals, or pipeline influence.
- Budget and cost review: planned versus actual spend, cost per attendee, variance drivers.
- Sponsor or partner deliverables: promised versus delivered, proof, makegoods if needed.
- Operational review: staffing, logistics, vendor performance, production risks.
- Risk and mitigation: what could affect follow-up, renewals, compliance, or next-year planning.
- Recommendations: continue, change, stop, invest, or approve.
- Decision slide: budget, date, format, audience, sponsor package, or follow-up plan to approve.
- Action register: owner, due date, dependency, expected impact.
- Appendix: detailed session ratings, raw survey tables, CRM definitions, full budget, source notes.
A good AI recap prompt should name the audience, decision goal, slide count, required metrics, source files, and tone. Without those constraints, the output can look polished while missing the stakeholder’s real question.
Prompt example: “Create a 10-slide executive event recap for [event name], a B2B product launch. Audience: CMO, sales VP, finance lead. Use [registration.csv], [survey-summary.pdf], [crm-export.xlsx], and [event-brief.docx]. Do not invent missing metrics. Include attendance target versus actual, engagement rate, top three session insights, audience feedback themes, lead quality, pipeline estimate, cost per attendee, lessons learned, and three recommendations. Label all estimates and flag any source conflicts.”
Prompt variations by recap type
- Executive: “Summarize only decision-relevant findings. Put detailed comments and raw tables in the appendix. End with a budget or strategy recommendation.”
- Webinar: “Separate registrants, live attendees, no-shows, and replay viewers. Interpret watch time and Q&A themes as engagement signals, not proof of purchase intent.”
- Trade show: “Separate badge scans from qualified meetings. Build a follow-up tracker by account owner and due date.”
- Sponsor: “Create a promised-versus-delivered scorecard. Include proof requirements and makegood recommendations for any underdelivered asset.”
- Internal offsite: “Anonymize employee feedback. Convert workshop outputs into decisions, open questions, and owner-based action items.”
How to Turn Event Data into AI Recap Slides
The most valuable recap decks begin before slide design. Start by collecting the inputs your AI tool needs, cleaning the data, and deciding which numbers are safe to present.
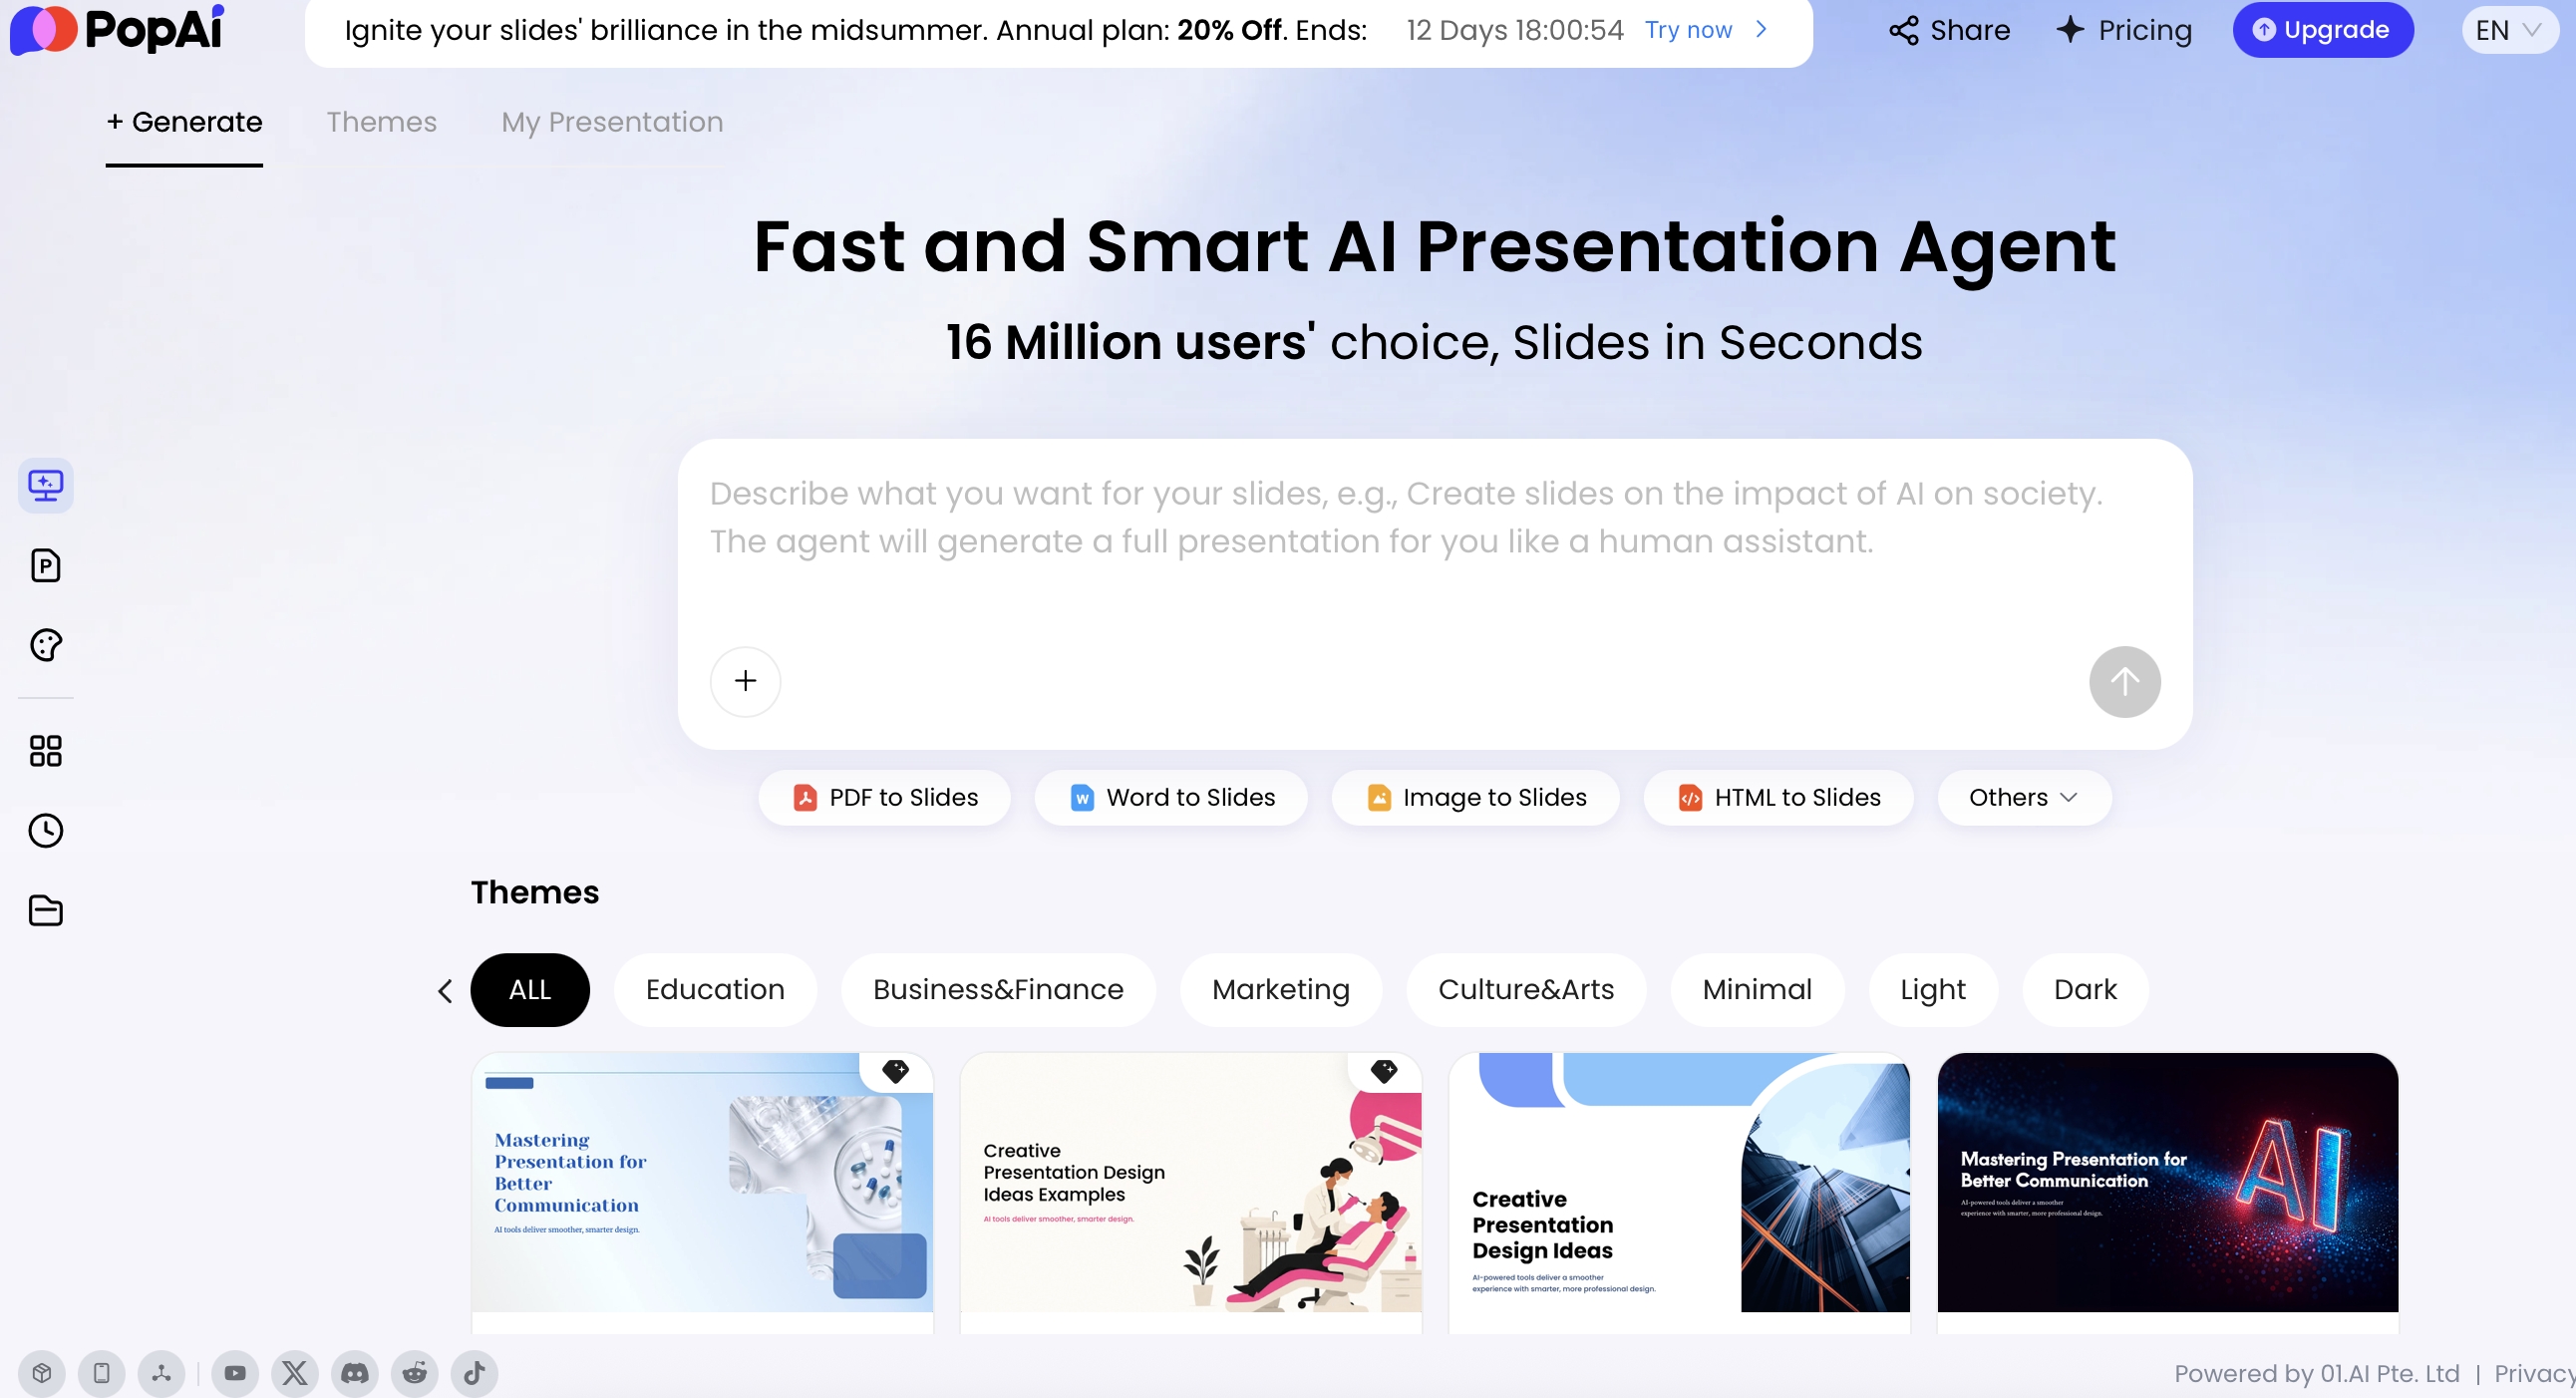
For PopAi, you can start from a topic or prompt, or you can upload source material such as PDF, Word, image, HTML, text, or PPTX files. The product also supports local upload, drag-and-drop, existing file selection, and Google Drive connection. For multimedia-heavy recaps, supported inputs include common image, audio, and video formats, plus YouTube video URLs. The practical point is not the file list itself; it is that event evidence often lives across analytics exports, CRM reports, survey tools, sponsor logs, video recordings, and notes from the sales or facilitation team.
Prepare a clean input bundle before prompting
- Event brief: objectives, audience, date, format, agenda, sponsor commitments, approved budget, target KPIs.
- Registration export: registrant count, attendee count, company, job title, segment, source channel, RSVP status, check-in status.
- Survey export: rating, NPS, session attended, respondent segment, comment, permission-to-quote flag.
- CRM export: lead status, account name if approved, owner, meeting date, opportunity amount, stage, next step, attribution label.
- Sponsor log: deliverable, promised quantity, actual quantity, proof link, screenshot, variance, makegood recommendation.
- Qualitative notes: speaker feedback, sales notes, chat themes, recurring objections, attendee questions.
- Visual proof: approved photos, booth images, screenshots, social posts, stage images, chart exports.
Use a 10-step AI recap workflow
- Collect source files and name them clearly: 2026-launch-registration.csv, survey-summary.pdf, sponsor-proof-log.xlsx.
- Remove unnecessary personal data before upload, especially emails, phone numbers, free-text HR feedback, and confidential account notes.
- Normalize metrics so “attended,” “checked in,” “viewed replay,” and “met with sales” are not treated as the same thing.
- Create a KPI table with target, actual, variance, source file, and notes.
- Tag qualitative feedback into themes such as content quality, logistics, buying intent, product concerns, sponsor fit, and employee sentiment.
- Upload files and ask for an outline first, not a final deck.
- Review the outline for missing KPIs, invented claims, wrong audience framing, or overcrowded slides.
- Generate the deck only after the outline reflects the recap objective.
- Validate charts and quotes against the original files.
- Add recommendations with owner, deadline, decision needed, and expected impact.
Data analysis: Use consistent formulas and label uncertainty. Attendance rate = actual attendees ÷ registrants. In-person check-in rate = checked-in attendees ÷ confirmed RSVPs. Cost per attendee = total event cost ÷ actual attendees. Pipeline sourced means the opportunity was created from the event; pipeline influenced means the event touched an existing opportunity. ROI is safest when presented as a range: “Estimated event ROI is 1.4x–2.1x based on $180K sourced pipeline, $90K influenced pipeline, 25% close-rate assumption, and $42K event cost.”
Worked example: A field marketing team recapping a 320-person regional conference uploaded a registration CSV, session survey PDF, CRM follow-up export, and sponsor deliverables spreadsheet. The first AI outline overemphasized photos and listed “620 leads” because it treated every badge scan as qualified. After adding a lead-grade rule—A = target account plus buying timeline, B = fit but no timeline, C = low-fit or student—the final deck reported 620 scans, 146 qualified conversations, 38 sales meetings, and $410K influenced pipeline. That correction changed the recommendation from “repeat the same booth package” to “keep the event, reduce swag spend, and pre-book more executive meetings.”
After generation, review the AI’s content plan before finalizing slides. Look for five failure modes: a missing KPI, an invented claim, the wrong audience, a weak recommendation, or a slide trying to carry too many metrics. A useful edit prompt is: “Rewrite this deck for the CFO. Reduce photos, add budget variance, label all estimates, and move full survey comments to the appendix.”
Event Recap Data-to-Slides Workflow
The AI connection becomes stronger when the template shows exactly how event inputs become recap slides.
| Event input | Clean-up step before AI | Best recap slide | Human review |
|---|---|---|---|
| Agenda, session list, speaker notes. | Remove draft agenda items that did not happen. | Event story arc and key moments. | Confirm session names, speaker titles, and timing. |
| Attendance and registration data. | Separate registrations, attendees, no-shows, and repeat attendees. | Attendance summary or funnel. | Do not combine metrics with different definitions. |
| Photos and screenshots. | Select approved, high-quality, consent-safe visuals. | Photo mosaic, highlight reel, or proof-of-experience slide. | Check usage rights and remove sensitive faces or badges if needed. |
| Survey and feedback comments. | Group themes and remove personally identifiable comments. | Feedback themes and improvement plan. | Do not overstate sentiment from a small response sample. |
| Social posts and press mentions. | Capture links, handles, dates, and context. | Reach and community response slide. | Distinguish organic comments from paid or owned content. |
Example event recap deck
For a customer summit, prepare one source packet with the final agenda, attendance export, approved photos, survey summary, top questions, sales follow-ups, and sponsor notes. Ask PopAi to draft slides for executive summary, audience profile, session highlights, attendee feedback, content performance, follow-up opportunities, lessons learned, and next event recommendations.
How to Compare AI Tools for Event Recap Templates
The right AI tool depends on whether your priority is source-file ingestion, design polish, editable charts, PowerPoint handoff, brand control, privacy, or team collaboration.
Many AI presentation products can draft a deck quickly, but speed does not guarantee a credible recap. Run the same test across tools: upload or paste the same event brief, KPI table, survey summary, and stakeholder goal; request the same 10-slide recap; export the result; then score the outline, chart accuracy, editability, and brand fidelity. This is more useful than comparing marketing claims.
Practical tool comparison for recap decks
| Tool | Best fit | Watch carefully |
|---|---|---|
| PopAi | Mixed-source recap drafts, file-to-slides workflows, branded PPTX-style outputs, editable chart-heavy business decks. | Validate every metric after generation and review export fidelity for complex layouts. |
| Canva | Highly visual highlight recaps, social-friendly summaries, sponsor or community decks with strong design polish. | Data-heavy KPI dashboards may need manual chart work or simplified tables. |
| Gamma | Fast narrative recaps, web-style decks, internal updates, and clean one-pass storytelling. | PowerPoint handoff and detailed brand-template control may be less central than web presentation flow. |
| Tome | Story-led recaps, qualitative summaries, event narratives, and investor-style updates. | Check whether tables, charts, and export formats meet stakeholder expectations. |
| Beautiful.ai | Polished business layouts, consistent slide design, executive-friendly visual structure. | Source-data ingestion and complex recap-specific prompting may require more preparation. |
| PowerPoint Copilot | Teams already standardized on Microsoft 365, confidential internal decks, and native PowerPoint review workflows. | Output quality depends heavily on the quality and organization of Microsoft files and tenant settings. |
| Google Slides/Gemini | Teams working inside Google Workspace with shared docs, comments, and collaborative review. | Advanced template control, chart editability, and file ingestion vary by workspace setup. |
| Pitch or Plus AI | Collaborative business decks, startup updates, sales or marketing team recaps. | Test PPTX export, brand governance, and chart workflow before committing. |
Use a weighted evaluation rubric
- Content quality — 30%: Does the AI create an argument from the data, or simply restate the agenda?
- Data handling — 25%: Are attendance, engagement, ROI, lead category, and sponsor charts accurate and editable?
- Brand control — 15%: Can you apply official templates, saved themes, or uploaded PPTX layouts?
- Export workflow — 15%: Can the deck be exported as PPTX or PDF without breaking fonts, tables, charts, or slide hierarchy?
- Collaboration and privacy — 15%: Does the workflow fit your company’s policy for attendee data, customer names, sponsor terms, and internal feedback?
Case-study test script: Give each tool a fictional event brief with 1,000 registrants, 612 attendees, 47% average watch time, 128 MQLs, 31 SQLs, $240K sourced pipeline, $70K event cost, and 42 survey comments. A strong output should calculate attendance rate correctly, avoid calling all MQLs “opportunities,” group comments into useful themes, and produce a recommendation such as “increase post-event sales follow-up capacity within 48 hours.” A weak output will usually celebrate engagement, invent a revenue number, or bury the decision ask on the final thank-you slide.
PopAi is a practical option when your recap starts from mixed materials and needs a connected workflow: input prompt or files, organize the structure, choose a theme or template, generate the deck, revise with AI writing and manual editing, then export or share. Treat it like any other business-reporting tool: use it to accelerate the first draft, but keep human review responsible for numbers, privacy, interpretation, and final recommendations.
Avoid These Event Recap Template Mistakes
AI can accelerate recap creation, but it can also make weak evidence look more confident than it should. Use these guardrails before sharing the deck.
1. Do not let highlights replace outcomes
Photos, quotes, and memorable sessions belong in the deck, but they should support a business point. Pair “standing-room-only keynote” with session rating and follow-up requests. Pair “busy sponsor booth” with scanned leads, qualified meetings, and proof photos. Pair “high workshop engagement” with decisions made and action plans completed. If a highlight cannot be tied to an outcome, keep it in a gallery or appendix.
2. Verify every number and quote
AI may summarize correctly but still mislabel a chart, round a figure, or overstate causality. A common failure is turning “registered” into “attended,” treating badge scans as qualified leads, or attributing pipeline to the event without CRM confirmation. Before distribution, compare every chart with the original CSV, check date ranges, confirm rounding rules, verify quote permission, and mark estimated metrics clearly. For high-stakes decks, add a small source note under key charts or keep a data appendix.
3. Plan for export and collaboration
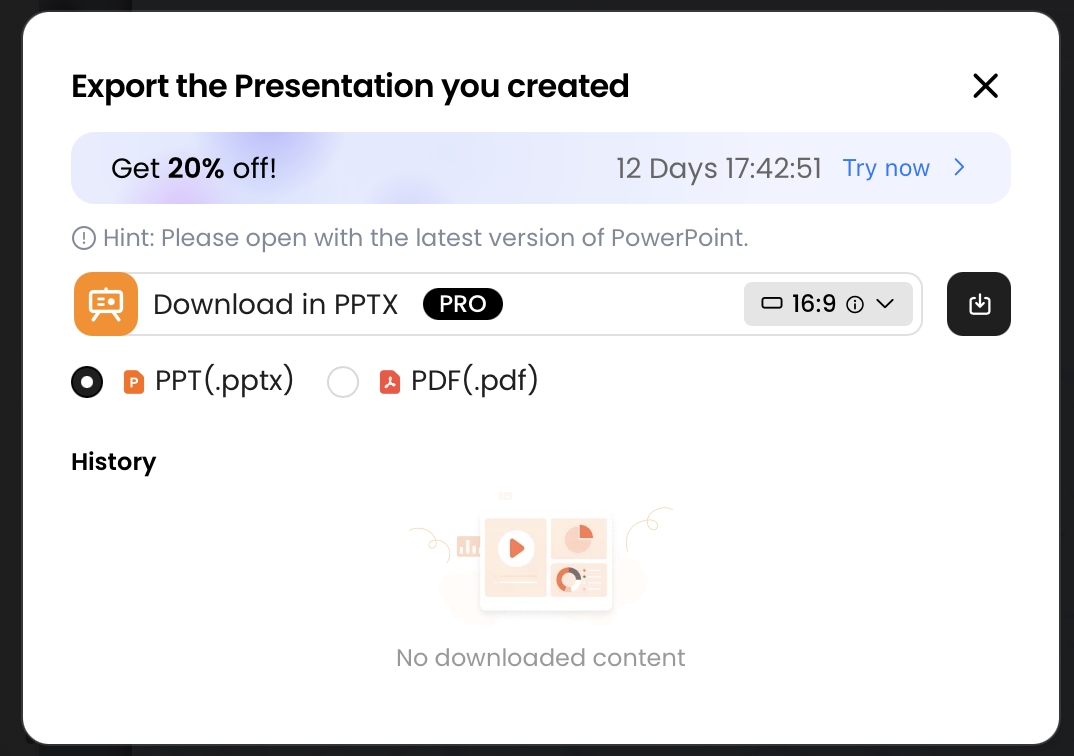
Some teams still need a PPTX handoff for leadership review, agency editing, or archive storage. PopAi supports export to PPTX and PDF, and exported PPTX files can be opened in Microsoft PowerPoint with editable text objects. As with any AI-generated deck, review fonts, spacing, chart editability, master-slide behavior, image compression, speaker notes, accessibility tags, and complex layouts after export rather than assuming perfect fidelity. If reviewers work in Google Slides, test the PPTX import before the deadline.
4. Protect attendee and customer data
Before uploading source files to any AI tool, remove unnecessary personal data, confidential customer names, unreleased financial results, and sensitive sponsor terms. Use aggregated data when possible: job level instead of full name, account segment instead of customer list, theme summary instead of raw employee comments. Check GDPR, CCPA, internal data classification rules, photo consent, quote permission, and sponsor confidentiality clauses. A recap deck should be persuasive, but it should also be safe to circulate beyond the event team.
5. End with recommendations, not just thanks
The final slide should not be only a closing message. Use a recommendation format that stakeholders can act on: recommendation, evidence, owner, deadline, expected impact, and decision needed. Example: “Approve a 20% higher executive-meeting budget for next year; evidence: A-grade meetings converted to SQLs at 3.4x the rate of booth scans; owner: field marketing; deadline: Q2 planning; expected impact: higher pipeline quality.” That is where a recap becomes operational value.
FAQ: Event Recap Templates for AI
What should an event recap presentation template include?
A strong event recap template includes an executive summary, goals, attendance and engagement metrics, session highlights, speaker or sponsor value, audience feedback, ROI analysis, lessons learned, and next steps.
Can AI turn event notes, photos, and survey data into slides?
Yes. AI tools can summarize notes, group highlights, suggest slide titles, create charts from structured data, and draft speaker notes. Always review numbers, names, quotes, and permissions before sharing the final deck.
Which recap template is best for executives?
Use an executive recap template with a one-slide summary, KPI dashboard, ROI or pipeline slide, key risks, and three recommended decisions. Keep photos and session details as supporting evidence, not the main story.
How do I show sponsor value in an event recap deck?
Show sponsor value with impressions, booth traffic, lead volume, session attendance, social reach, content downloads, audience fit, and qualitative quotes. Compare promised deliverables with actual outcomes.
Create your presentation with one click now
Upload your event brief, survey summary, KPI report, or old recap deck and turn it into a structured presentation for executives, sponsors, or campaign teams.
Create with PopAi