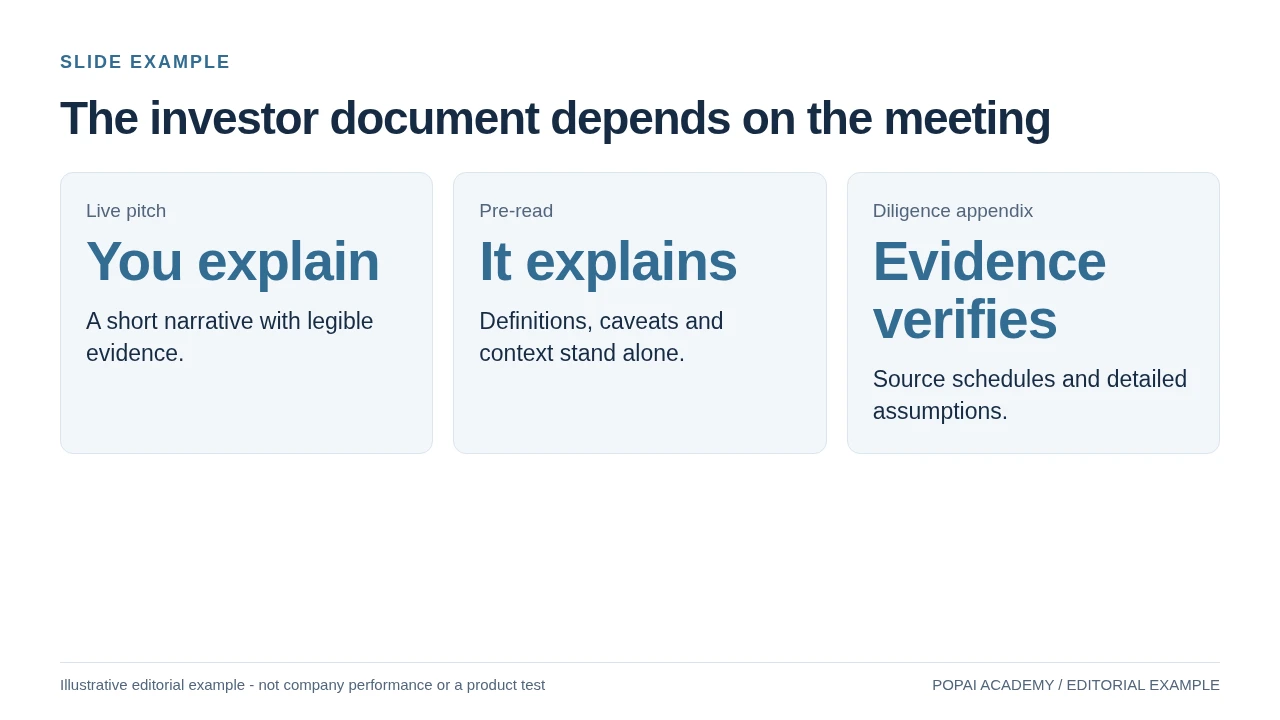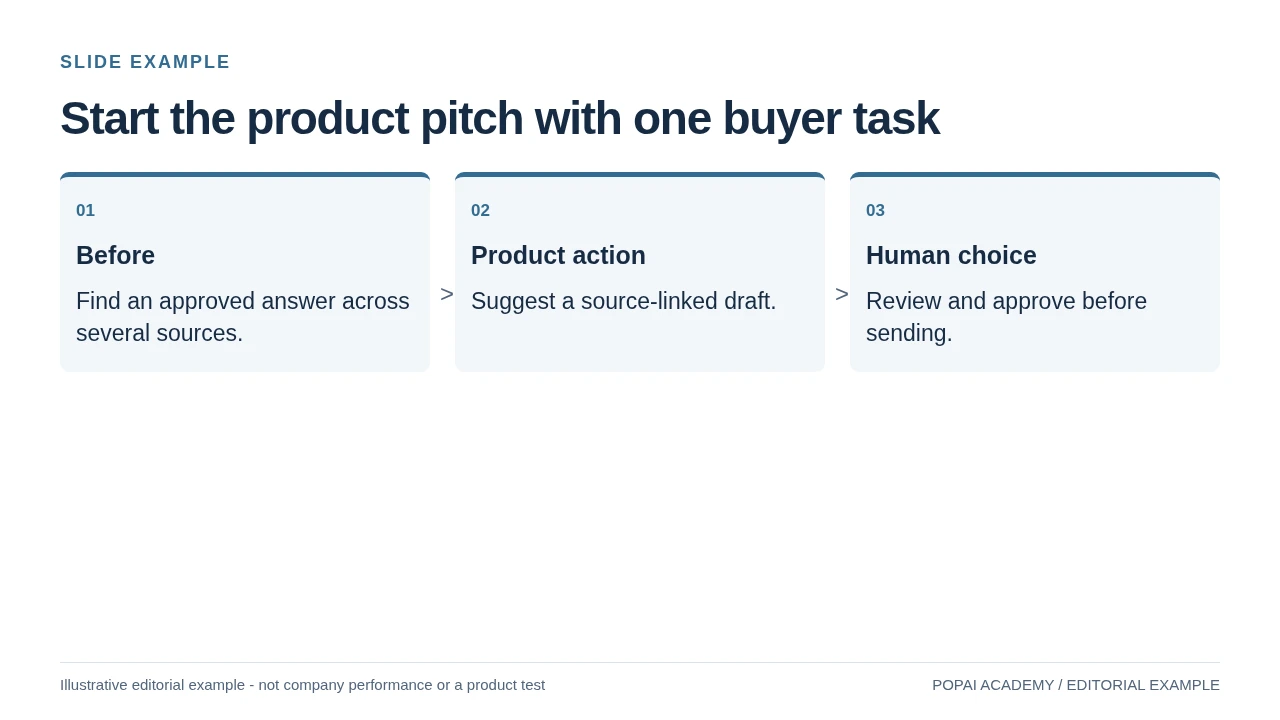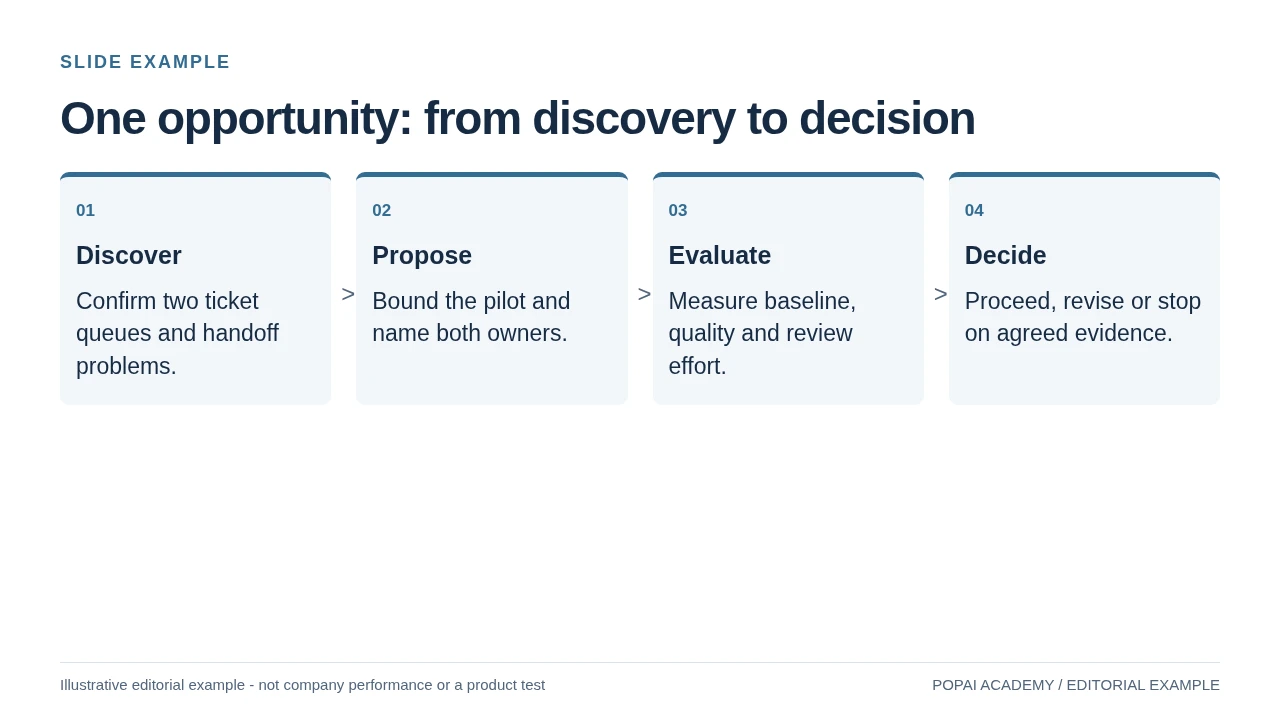
There are three common SaaS presentation jobs: explain the investment case, help a buyer evaluate a product or help a board make an operating decision. The same product can appear in all three, but the evidence and slide order should change. Do not recycle an ARR chart into a buyer demo simply because it looks impressive.
Choose the SaaS Deck Before Choosing a Template
| Deck | Primary audience | Lead with | Avoid |
|---|---|---|---|
| Investor | Potential capital provider | Recurring revenue, retention and the business model | Unreconciled growth figures or unproven market claims |
| Sales / buyer | Product users and buying committee | Task, demo, adoption cost, evidence and risk | Company ARR in place of buyer value |
| Board / operating review | Existing company leadership and directors | Cohorts, forecasts, cash implications and a decision | A promotional pitch that hides bad news |
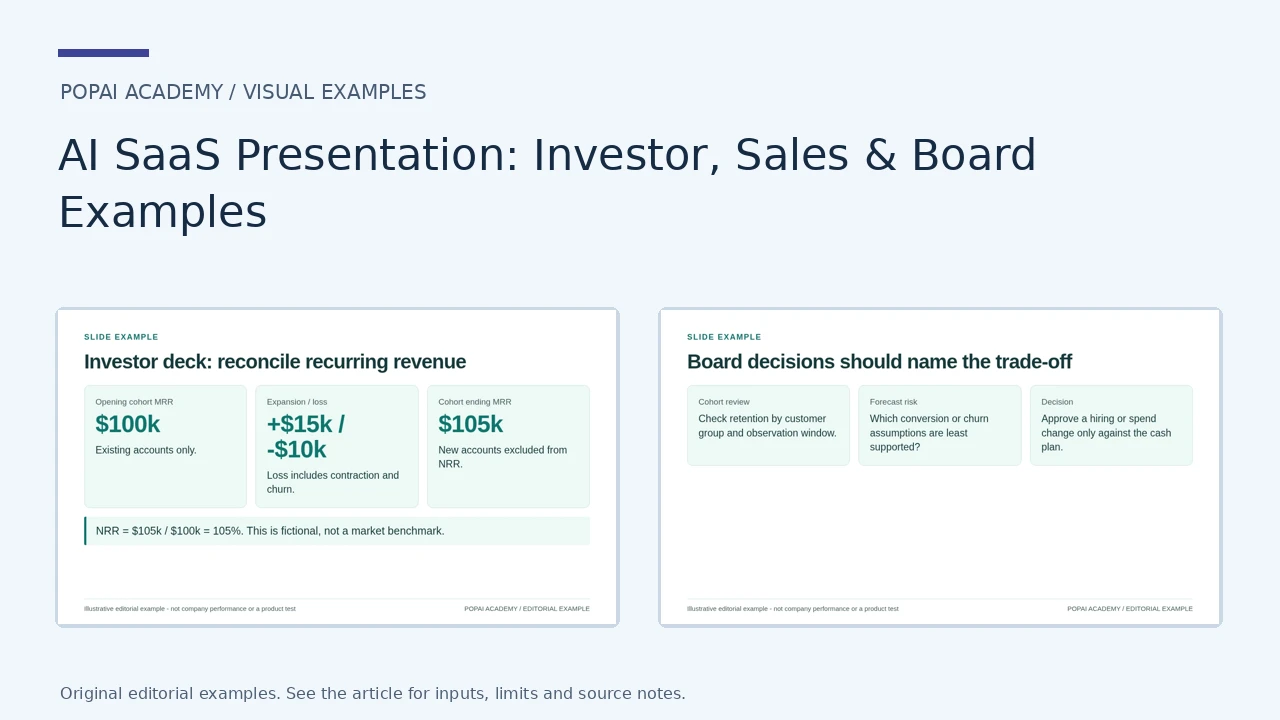
Three SaaS Decks, Three Different Jobs
The investor pages focus on recurring revenue and retention; the buyer pages on a task, adoption cost and risk; the board pages on a forecast and an operating decision. Their synthetic figures are not company benchmarks.
Open full-size examples and editable HTML layoutsInvestor SaaS deck
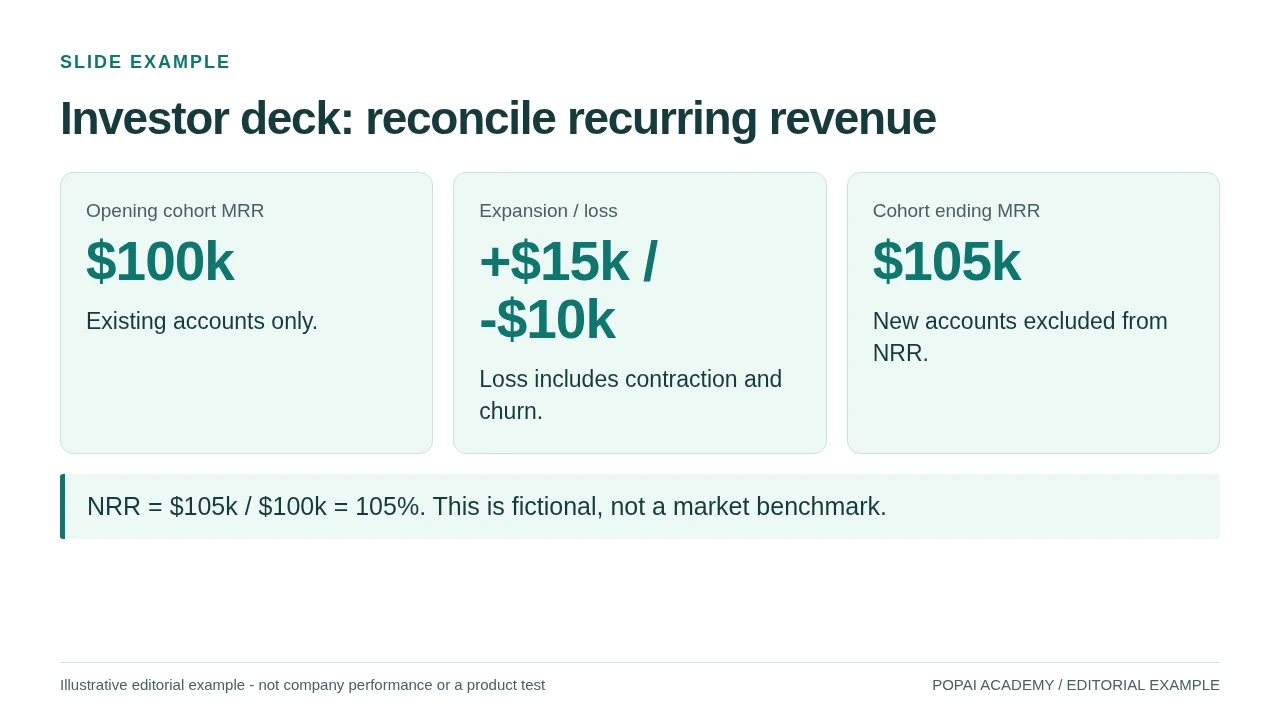
Investor SaaS page: same-cohort revenue bridge with a defined period.
Read or copy the slide content
Opening cohort MRR
$100k
Existing accounts only.
Expansion / loss
+$15k / -$10k
Loss includes contraction and churn.
Cohort ending MRR
$105k
New accounts excluded from NRR.
NRR = $105k / $100k = 105%. This is fictional, not a market benchmark.
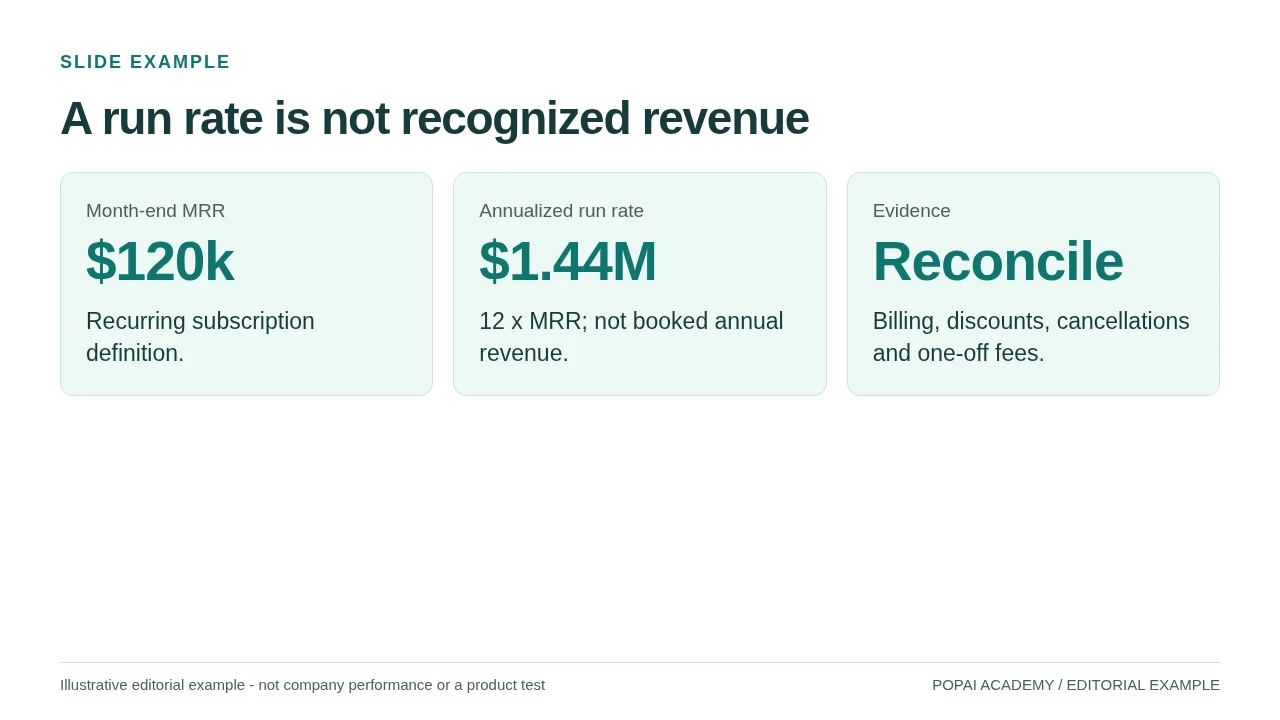
Investor SaaS page: use the original example convention consistently.
Read or copy the slide content
Month-end MRR
$120k
Recurring subscription definition.
Annualized run rate
$1.44M
12 x MRR; not booked annual revenue.
Evidence
Reconcile
Billing, discounts, cancellations and one-off fees.
Prompt for Investor SaaS deck
Create a slide with the purpose "A run rate is not recognized revenue". Use these approved source fields or replace the illustrative inputs before use: Month-end MRR $120k Recurring subscription definition. Annualized run rate $1.44M 12 x MRR; not booked annual revenue. Evidence Reconcile Billing, discounts, cancellations and one-off fees.. Preserve labels, units, source notes and any uncertainty. Do not add results, claims, customers or capabilities. Suggest a readable layout and keep the output editable in the chosen tool.
Buyer / sales SaaS deck
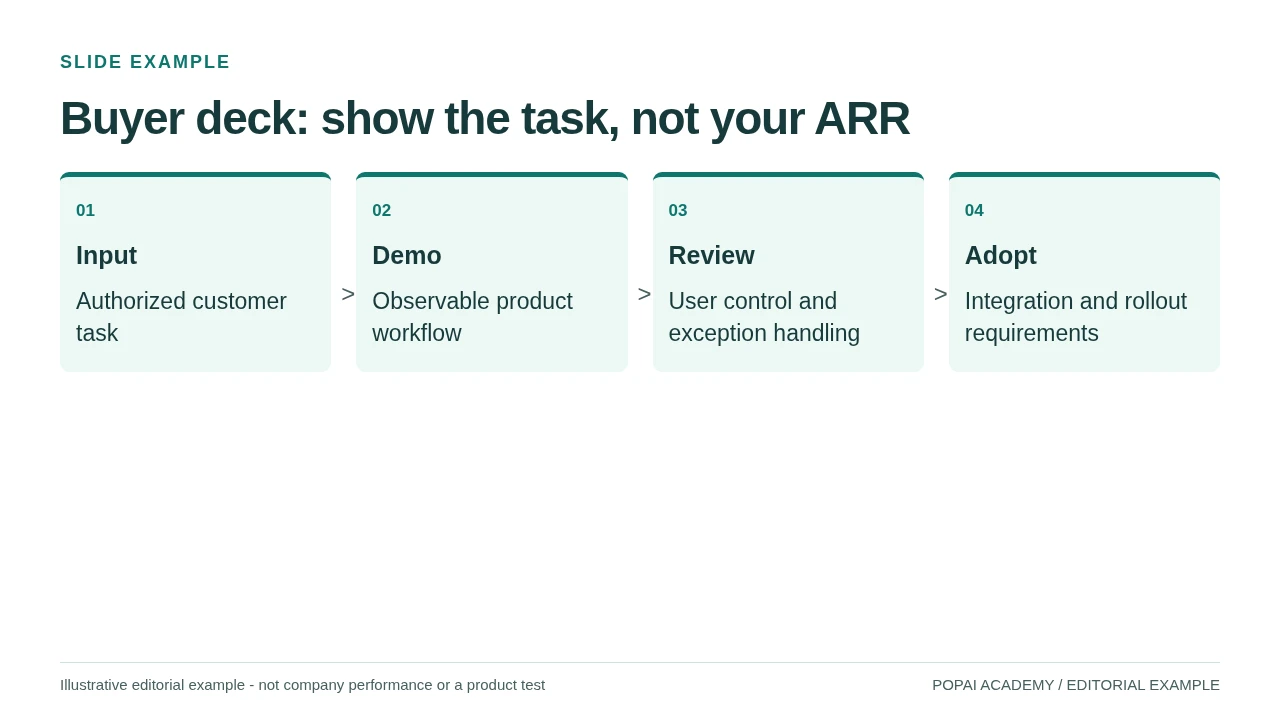
SaaS sales page: a demo sequence distinct from fundraising.
Read or copy the slide content
01
Input
Authorized customer task
02
Demo
Observable product workflow
03
Review
User control and exception handling
04
Adopt
Integration and rollout requirements
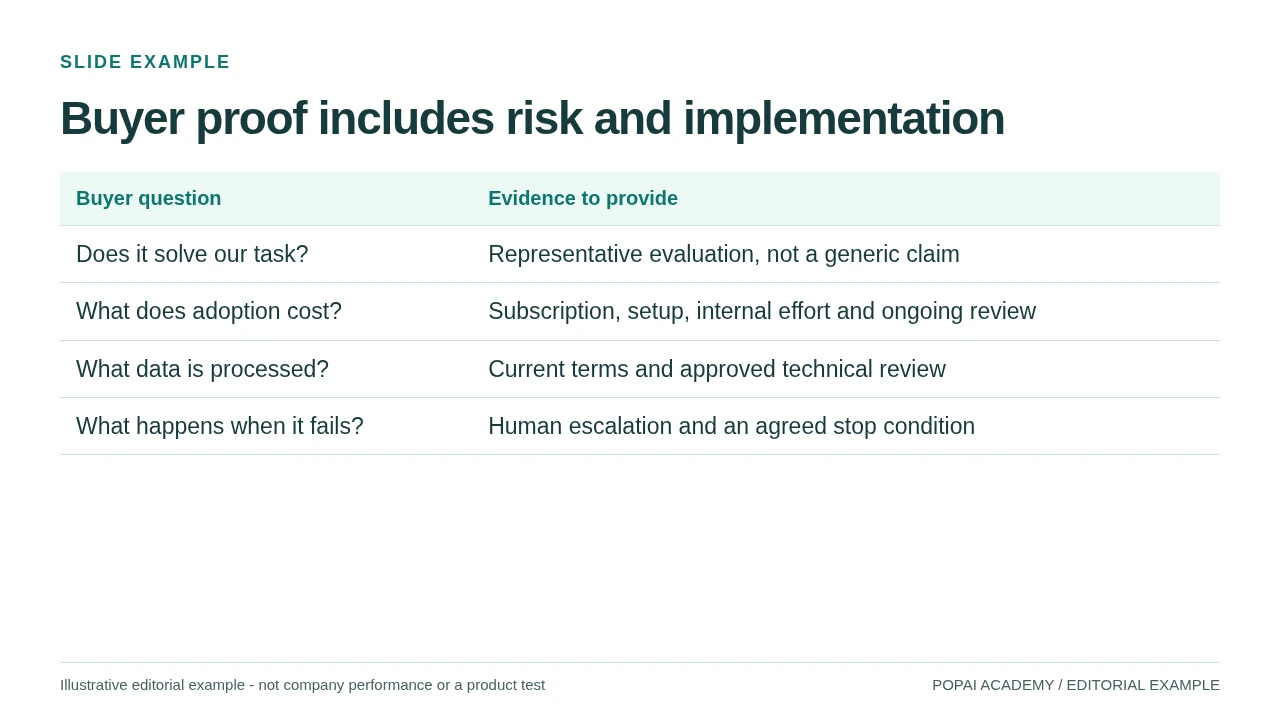
SaaS buyer page: controls are questions until verified, not product promises.
Read or copy the slide content
Buyer question
Evidence to provide
Does it solve our task?
Representative evaluation, not a generic claim
What does adoption cost?
Subscription, setup, internal effort and ongoing review
What data is processed?
Current terms and approved technical review
What happens when it fails?
Human escalation and an agreed stop condition
Prompt for Buyer / sales SaaS deck
Create a slide with the purpose "Buyer proof includes risk and implementation". Use these approved source fields or replace the illustrative inputs before use: Buyer question Evidence to provide Does it solve our task? Representative evaluation, not a generic claim What does adoption cost? Subscription, setup, internal effort and ongoing review What data is processed? Current terms and approved technical review What happens when it fails? Human escalation and an agreed stop condition. Preserve labels, units, source notes and any uncertainty. Do not add results, claims, customers or capabilities. Suggest a readable layout and keep the output editable in the chosen tool.
Board / operating SaaS deck
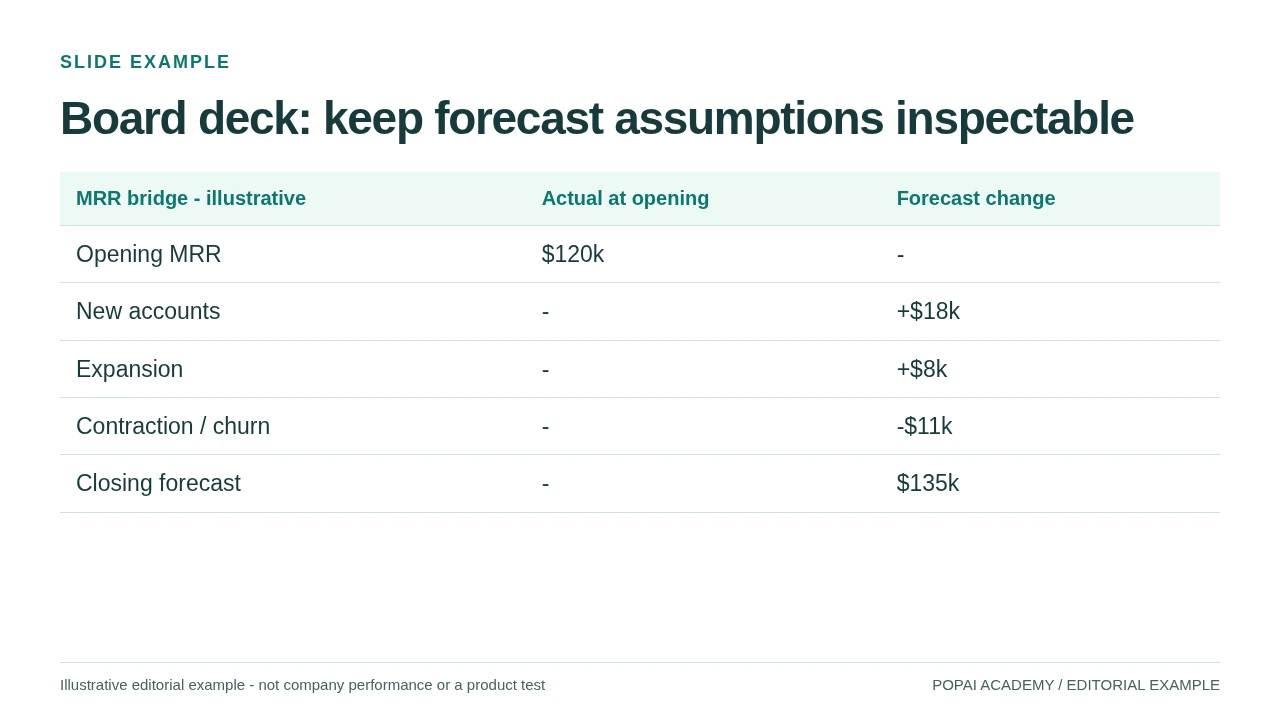
Board SaaS page: forecast is not achieved revenue; all changes must use the same month.
Read or copy the slide content
MRR bridge - illustrative
Actual at opening
Forecast change
Opening MRR
$120k
-
New accounts
-
+$18k
Expansion
-
+$8k
Contraction / churn
-
-$11k
Closing forecast
-
$135k
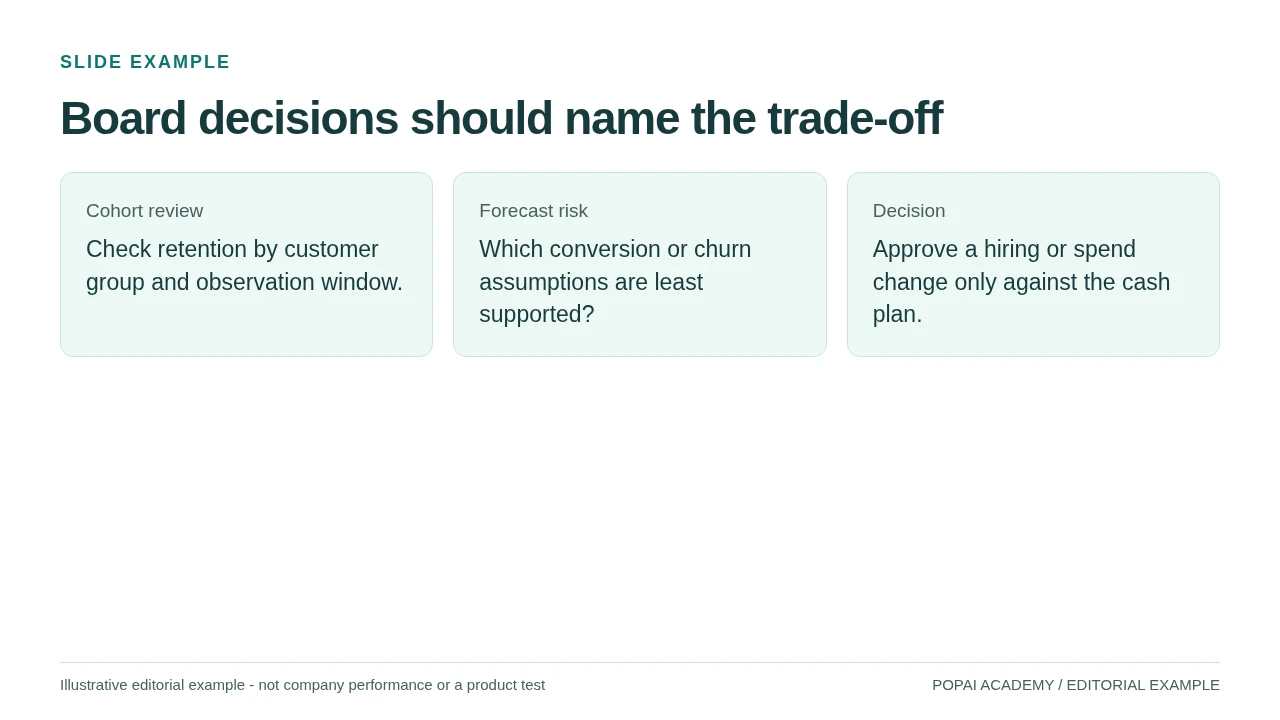
Board SaaS page: an operating review, not another generic investor pitch.
Read or copy the slide content
Cohort review
Check retention by customer group and observation window.
Forecast risk
Which conversion or churn assumptions are least supported?
Decision
Approve a hiring or spend change only against the cash plan.
Prompt for Board / operating SaaS deck
Create a slide with the purpose "Board decisions should name the trade-off". Use these approved source fields or replace the illustrative inputs before use: Cohort review Check retention by customer group and observation window. Forecast risk Which conversion or churn assumptions are least supported? Decision Approve a hiring or spend change only against the cash plan.. Preserve labels, units, source notes and any uncertainty. Do not add results, claims, customers or capabilities. Suggest a readable layout and keep the output editable in the chosen tool.
Investor SaaS Deck: ARR, Retention and Revenue Quality
A compact investor version might contain the customer workflow, recurring-revenue definition, retention bridge, acquisition evidence, cost model and financing link. Do not repeat a generic twelve-page investor outline here; use the general investor guide when you need that wider structure.
The fictional retention example begins with $100,000 of monthly recurring revenue from an existing customer cohort. Expansion adds $15,000; contraction and churn remove $10,000. The same cohort ends at $105,000, giving NRR of 105%. New accounts are excluded. State the period, currency convention, treatment of discounts and recurring-revenue definition with the chart.
A separate example uses month-end MRR of $120,000. Multiplying by twelve produces a $1.44 million annualized run rate under that definition, not recognized annual revenue or guaranteed future billings. Reconcile billing and contract status; separate one-off fees and nonrecurring services.
Sales SaaS Deck: Demo, ROI and Deployment Requirements
A buyer version should show the task, the actual workflow, evidence and adoption requirements. Put the observable demo before broad company metrics. If the offer includes unverified integrations, state them as requirements to resolve rather than completed capabilities.
A cost page should separate subscription, setup, internal effort and ongoing review. An ROI model needs a buyer-approved baseline and a clear distinction between productive capacity and cash saving. Use the sales pitch tutorial for the opportunity-level business case; use the product pitch guide for the demo sequence.
Security and privacy belong in an evidence or requirements table, not a decorative badge row. Reference the actual product documentation and contract scope; a general SaaS template does not establish any compliance status.
Board SaaS Deck: Cohorts, Forecasts and Decisions
An operating version asks what changed and what leadership should do. In the synthetic forecast, opening MRR of $120,000 plus $18,000 from new accounts plus $8,000 expansion minus $11,000 contraction and churn produces a $135,000 closing forecast. The bridge is an assumption schedule, not achieved performance.
Show actuals and forecasts in different, explicitly labeled columns. Keep cohorts on equal observation windows and explain changes in definition. A funding, hiring or pricing decision should reference its cash implications and the uncertainty in the operating forecast.
Three Prompts, Not One Generic SaaS Pitch
Investor version: organize the approved SaaS evidence around recurring revenue, same-cohort retention, acquisition and unit costs. State definitions, dates and exclusions. Do not add unsupported revenue, customer counts or forecasts. Link the financing ask to the separate round plan.
Buyer version: create a task-led demo and evaluation deck using verified shipped features. Cover input, workflow, output, review, adoption requirements and approved commercial scope. Leave ARR, fundraising and investor returns out unless the buyer explicitly requests company background.
Board version: summarize actuals versus forecast, equal-window cohorts, churn drivers supported by evidence, cash implications and one decision. Reconcile the recurring-revenue bridge. Keep causes, forecasts and measured results distinct.
A Shared Metric Register Keeps the Three Versions Honest
Keep a single register for each metric: name, definition, period, cohort, source and owner. Change the emphasis for the audience, not the underlying facts. If one version includes trials and another excludes them, name those measures differently instead of presenting both as customers.
The examples are content-and-layout templates with editable HTML and copyable text, not proof of a native SaaS integration or a downloadable PowerPoint template. Use your actual editor to recreate the layout and check the final file.