AI Quarterly Business Review (QBR) Deck: KPI-first
Published on April 21, 2026 • By Jordan Miller
For many managers and customer success leads, the end of the quarter brings a familiar sense of dread: the creation of the Quarterly Business Review (QBR). Traditionally, this involves hours of manual data extraction from CRM tools, wrestling with Excel charts, and trying to format a PowerPoint deck that looks professional enough for the executive suite. The primary challenge isn't just gathering the data—it's transforming that data into a narrative that proves value and outlines a clear path forward.
By leveraging an AI Quarterly Business Review (QBR) Deck, teams can shift their focus from the tedious mechanics of slide creation to high-level strategic analysis. A KPI-first approach ensures that every slide serves a purpose, directly linking performance metrics to business objectives. In this guide, we explore how to automate this process and deliver reviews that actually drive decision-making.
Why a KPI-First Approach Matters in QBRs
A "KPI-first" strategy means starting with the most critical business outcomes and building the narrative around them. Executives don't want to see a list of every activity your team performed over the last 90 days; they want to see how those activities moved the needle on revenue, retention, and growth. When you lead with Key Performance Indicators, you establish immediate credibility and keep the conversation focused on ROI.
Using AI to structure this approach allows for real-time data integration. Instead of static screenshots of dashboards, an AI-powered deck can synthesize trends across different departments, highlighting correlations that might be missed in a manual report. This transforms the QBR from a "look back" session into a proactive planning meeting.
Pro Tip: Focus on the "So What?"
Every time you present a metric, ask yourself "So what?". If the AI shows a 10% increase in user engagement, the slide should explain how that leads to higher renewal rates. You can use the PopAi presentation maker to automatically generate these insights based on your uploaded data.
Automating Data Visualization for Your AI Quarterly Business Review (QBR) Deck
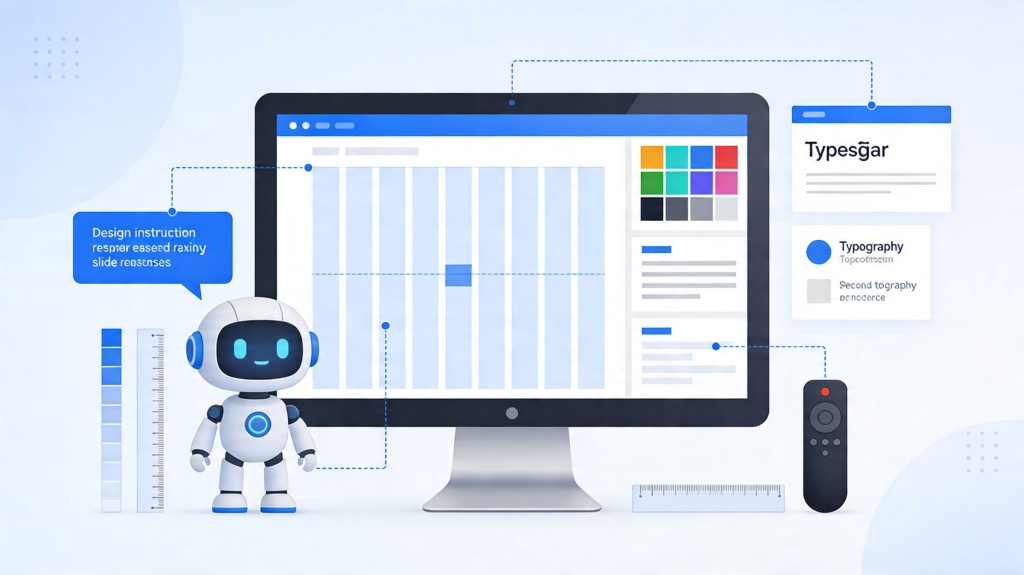
One of the biggest pain points in reporting is visual consistency. One team member might use a bar chart for sales, while another uses a pie chart for churn, leading to a disjointed presentation. AI tools solve this by applying a unified design language across all data visualizations. When you input your raw CSV or API data, the AI selects the most effective chart type for the specific data set.
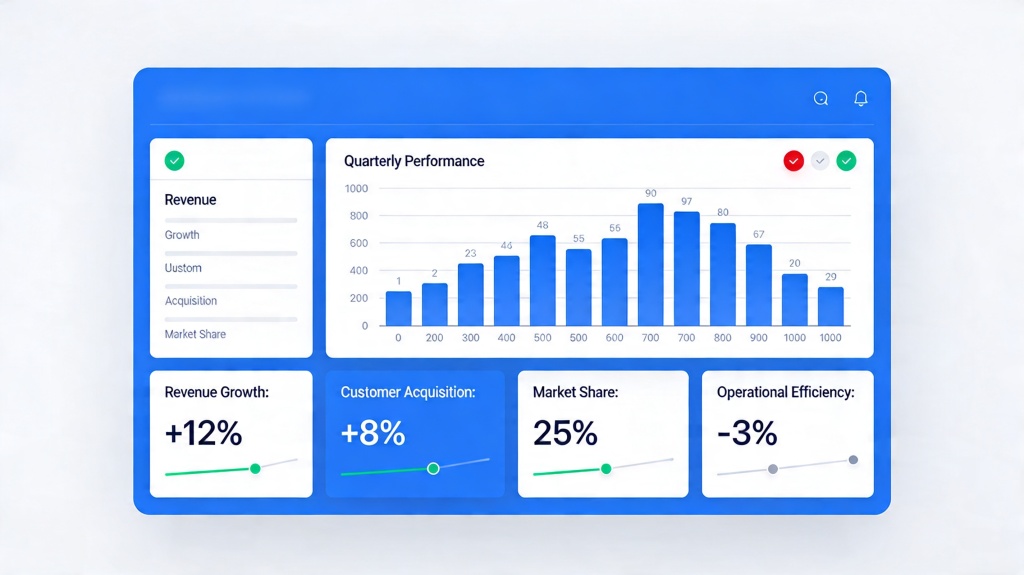
Furthermore, automation reduces human error. Copy-pasting numbers from a CRM into a slide deck is a recipe for mistakes. An AI Quarterly Business Review (QBR) Deck connects directly to your data sources, ensuring that the numbers on the screen are the single source of truth. This accuracy is vital when presenting to stakeholders who may question the validity of the data if they spot inconsistencies.
Structuring Your Deck: From Raw Metrics to Executive Insights
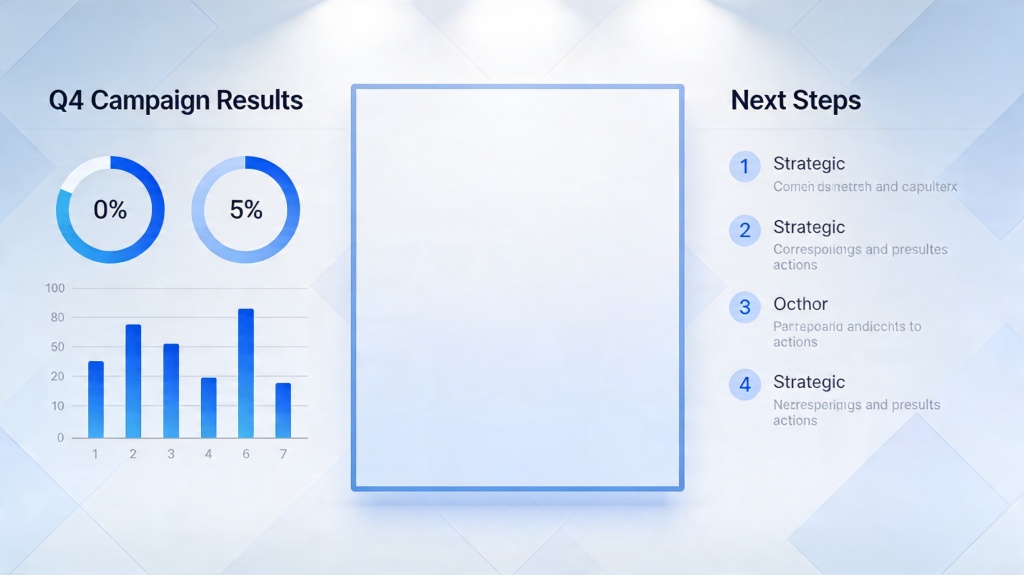
A successful QBR deck should follow a logical flow that respects the audience's time. A standard AI-optimized structure includes:
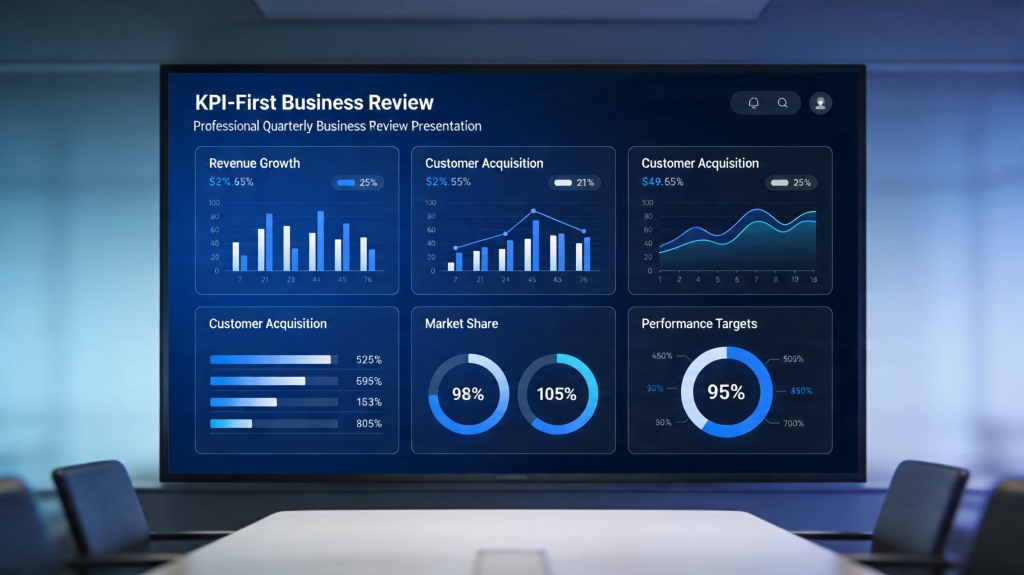
- Executive Summary: The top 3 wins and top 3 challenges of the quarter.
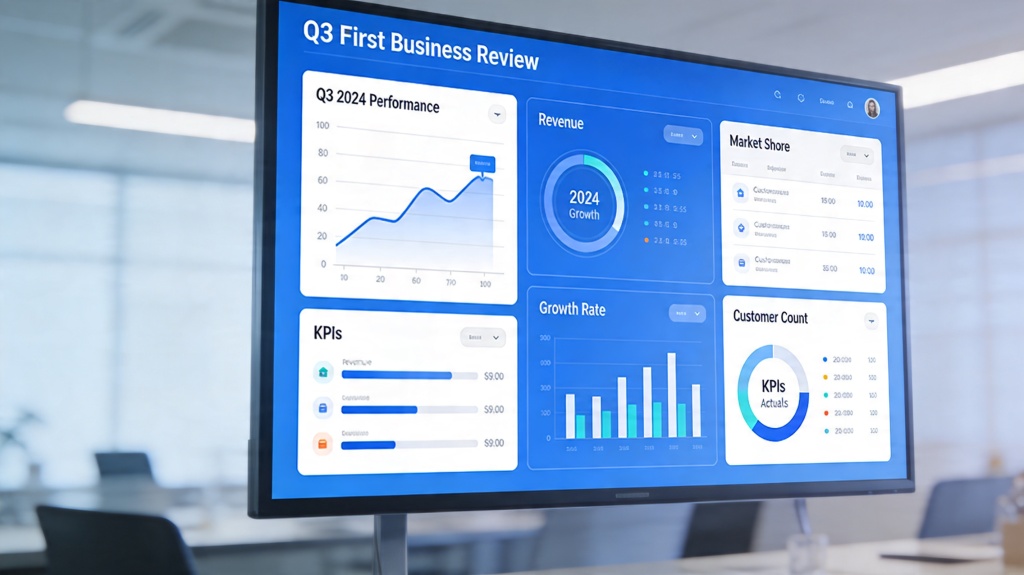
- The KPI Dashboard: A high-level view of core metrics (MRR, Churn, NPS, etc.).
- Deep Dive into Wins: What worked? Use AI to attribute success to specific initiatives.
- Gap Analysis: Where did we miss the mark? Focus on the "why" and the proposed fix.
- The Roadmap: Looking ahead to the next quarter with predictive milestones.
By following this structure, you ensure that you don't spend too much time on the past. The goal of a QBR is to spend 20% of the time on what happened and 80% on what is going to happen next.
Using AI to Identify Growth Trends and Performance Gaps
The true power of an AI Quarterly Business Review (QBR) Deck lies in its ability to perform "pattern recognition." While a human might see three months of declining usage in a specific feature, an AI can cross-reference that with support tickets, churn data, and market trends to provide a comprehensive explanation.
This predictive capability allows managers to go into QBRs with solutions rather than just problems. Instead of saying "sales were down in October," you can say "sales were down in October due to a shift in competitor pricing, but our AI-driven pilot program in November shows a 15% recovery rate." This level of insight is what separates a standard manager from a strategic leader.
Best Practices for Presenting AI-Generated Business Reviews
Even with the best AI tools, the delivery of the presentation matters. Here are three best practices for a KPI-first review:
- Keep Slides Minimal: Let the AI generate the complex charts, but keep the text on the slide to one main takeaway. The audience should listen to you, not read the slide.
- Validate AI Insights: Always do a quick "sanity check" on AI-generated summaries. While AI is great at spotting patterns, it may lack the specific cultural or internal context that you possess.
- Interactive Elements: If presenting digitally, use interactive charts that allow you to hover over data points. This shows a level of technical sophistication and transparency that builds trust.
Common Pitfalls to Avoid in Quarterly Reviews
Avoid the "Data Dump." One of the most common mistakes is including every chart the AI can generate just because you can. This leads to "analysis paralysis" where the executive team loses sight of the primary goals. Another pitfall is ignoring the "Human Element." While KPIs are the star of the show, don't forget to mention team achievements or customer testimonials that provide qualitative context to the quantitative data.
Finally, ensure your deck has a clear CTA. Every QBR should end with a request for resources, a confirmation of the next quarter's goals, or an approval of a new strategy. Without a clear "next step," the review is just a status update rather than a strategic lever.
FAQ: Optimizing Your QBR Process
How often should I update my AI Quarterly Business Review (QBR) Deck?
While the presentation happens quarterly, using an AI-driven tool allows you to sync data monthly or even weekly, ensuring your final deck is always ready without a last-minute rush.
What are the most important KPIs to include in a QBR?
The most critical metrics usually include Net Revenue Retention (NRR), Customer Acquisition Cost (CAC) efficiency, pipeline growth, and product adoption rates, depending on your specific business model.
Can AI help with the narrative of the QBR, not just the data?
Yes, advanced AI presentation tools can analyze data trends and suggest bullet points that explain the 'why' behind the numbers, helping you craft a compelling story for executives.
Create your presentation with one click now
Stop spending your weekends in PowerPoint. Use PopAi to turn your data into a stunning, KPI-first business review deck in minutes.
Get Started for Free