Use this guide when a startup pitch already exists and needs a visual revision. The before-and-after examples keep the underlying problem, activation figures and funding questions visible while changing the hierarchy and layout. For the substance of an early-stage pitch, use the pre-seed and seed pitch guide.
Redesign Three Startup Slides Without Changing the Facts
The activation example retains the worked example's 20 of 50 accounts, or 40%. Styling does not turn a setup action into revenue, retention or verified product-market fit.
Open full-size examples and editable HTML layoutsRedesign the problem, not the business
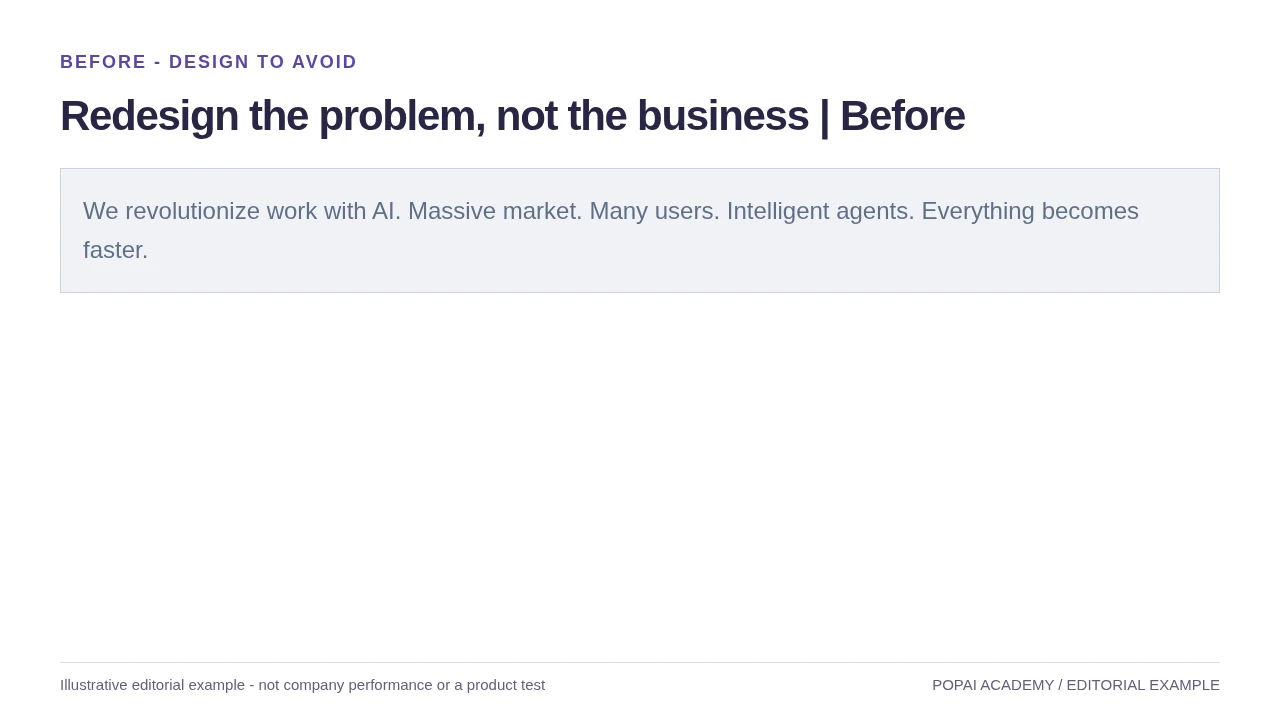
Before: Remove broad claims; use a clear user/task visual without inventing validation.
Read or copy the slide content
We revolutionize work with AI. Massive market. Many users. Intelligent agents. Everything becomes faster.
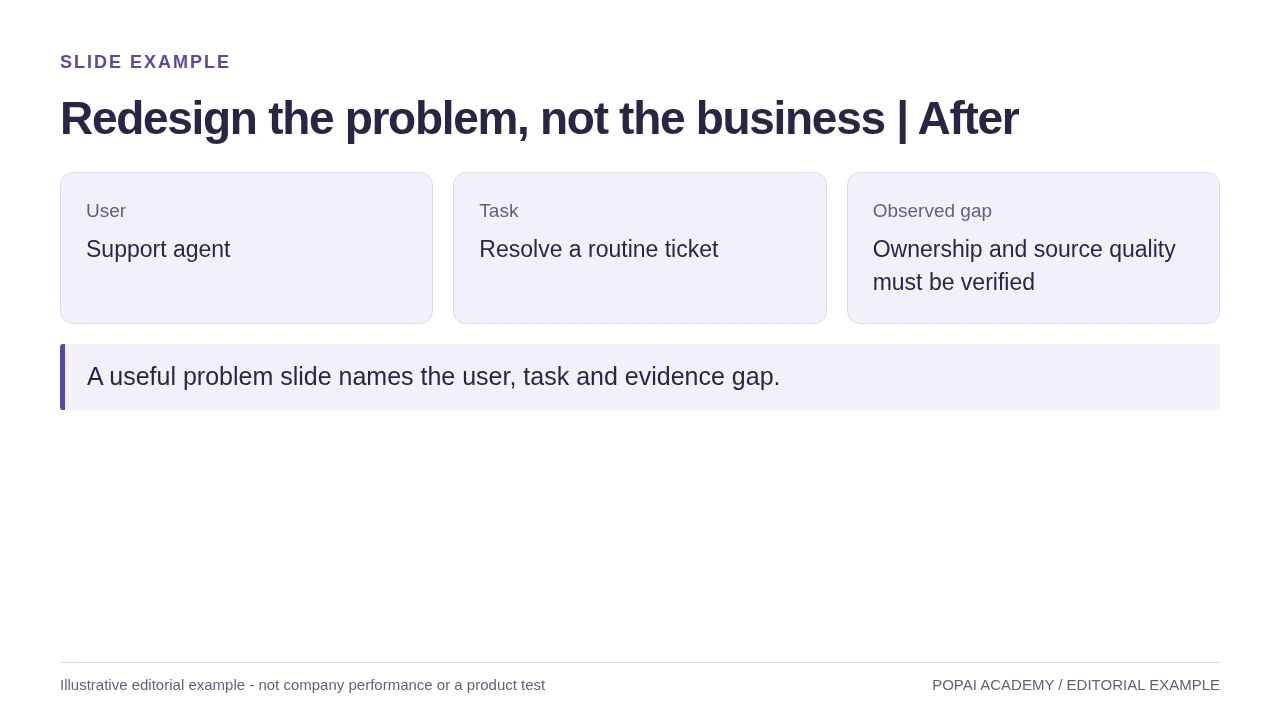
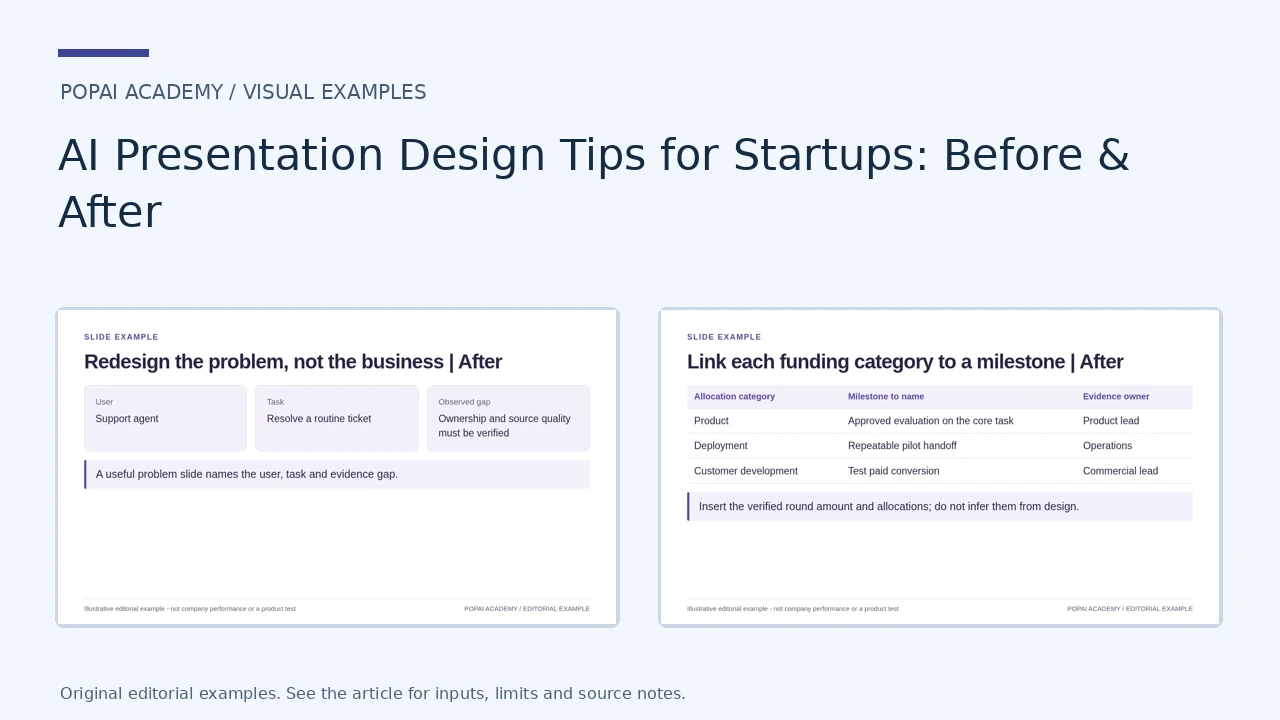
After: Remove broad claims; use a clear user/task visual without inventing validation.
Read or copy the slide content
User
Support agent
Task
Resolve a routine ticket
Observed gap
Ownership and source quality must be verified
A useful problem slide names the user, task and evidence gap.
Prompt for Redesign the problem, not the business
Create a slide with the purpose "Redesign the problem, not the business | After". Use these approved source fields or replace the illustrative inputs before use: User Support agent Task Resolve a routine ticket Observed gap Ownership and source quality must be verified A useful problem slide names the user, task and evidence gap.. Preserve labels, units, source notes and any uncertainty. Do not add results, claims, customers or capabilities. Suggest a readable layout and keep the output editable in the chosen tool.
Show the denominator behind activation
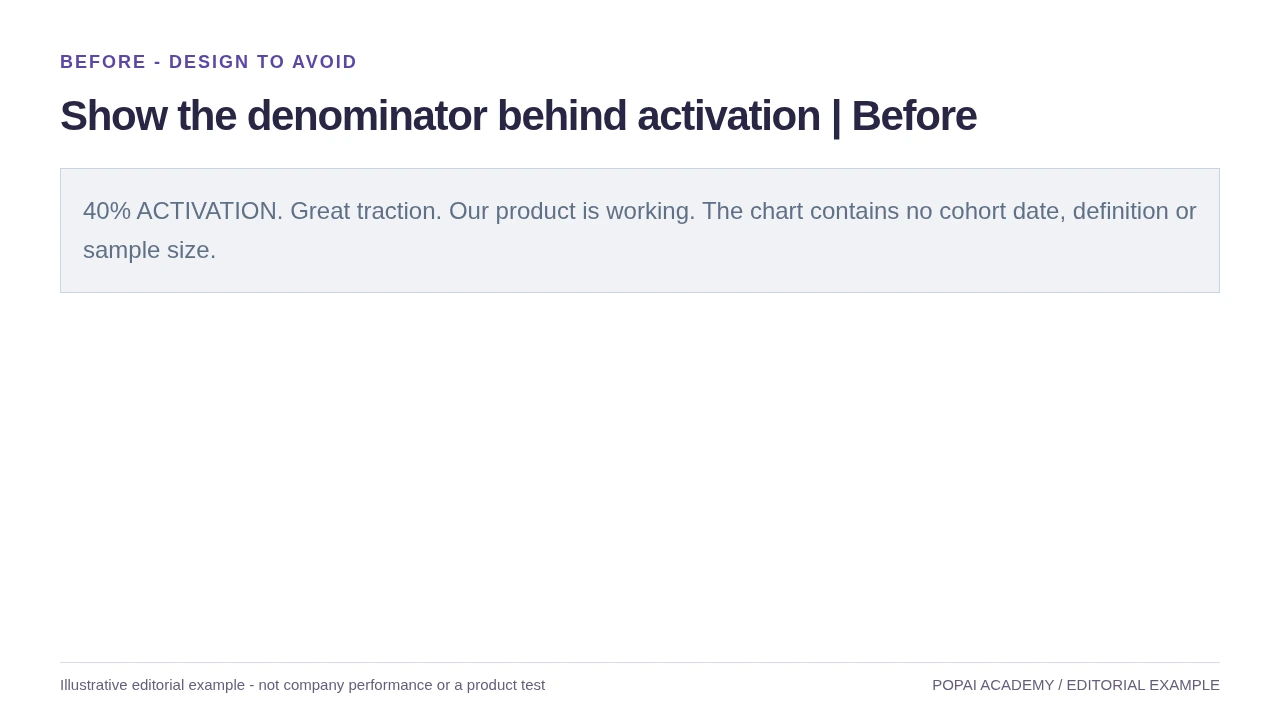
Before: Same underlying example as the worked example, redesigned rather than inflated.
Read or copy the slide content
40% ACTIVATION. Great traction. Our product is working. The chart contains no cohort date, definition or sample size.
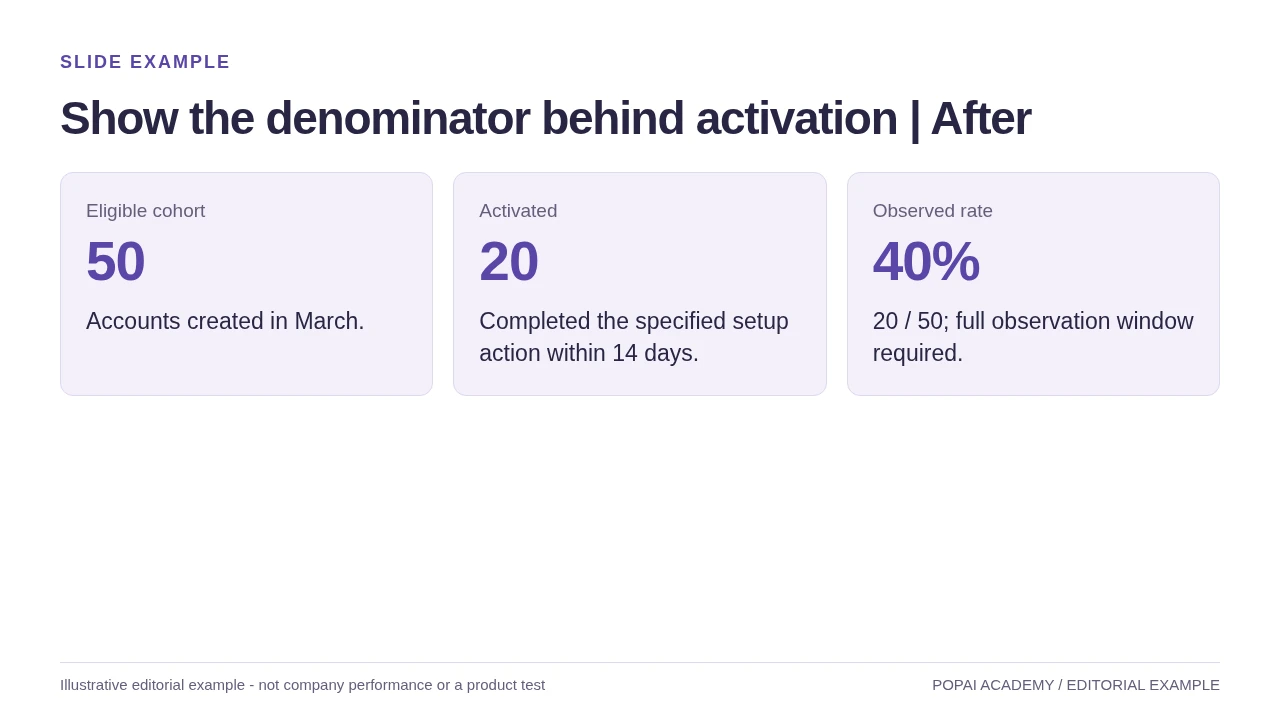
After: Same underlying example as the worked example, redesigned rather than inflated.
Read or copy the slide content
Eligible cohort
50
Accounts created in March.
Activated
20
Completed the specified setup action within 14 days.
Observed rate
40%
20 / 50; full observation window required.
Prompt for Show the denominator behind activation
Create a slide with the purpose "Show the denominator behind activation | After". Use these approved source fields or replace the illustrative inputs before use: Eligible cohort 50 Accounts created in March. Activated 20 Completed the specified setup action within 14 days. Observed rate 40% 20 / 50; full observation window required.. Preserve labels, units, source notes and any uncertainty. Do not add results, claims, customers or capabilities. Suggest a readable layout and keep the output editable in the chosen tool.
Link each funding category to a milestone
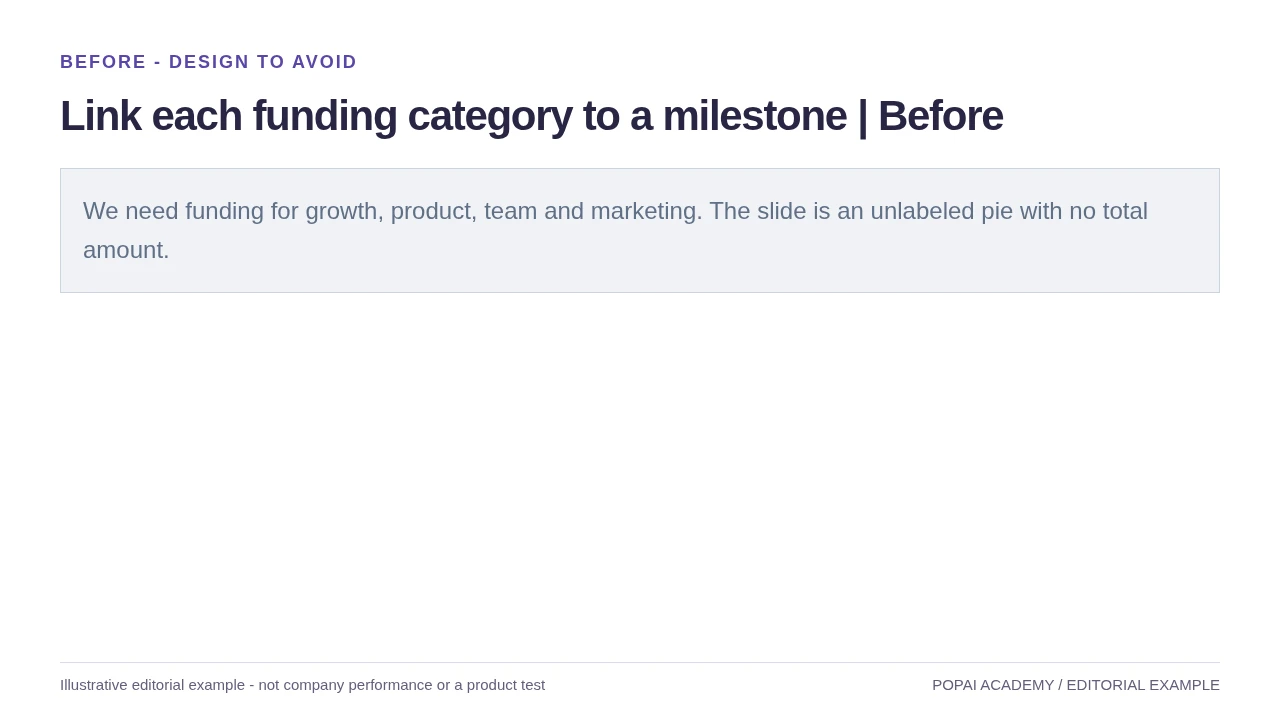
Before: The ask slide is a visual map; funding strategy belongs in the fundraising guide.
Read or copy the slide content
We need funding for growth, product, team and marketing. The slide is an unlabeled pie with no total amount.
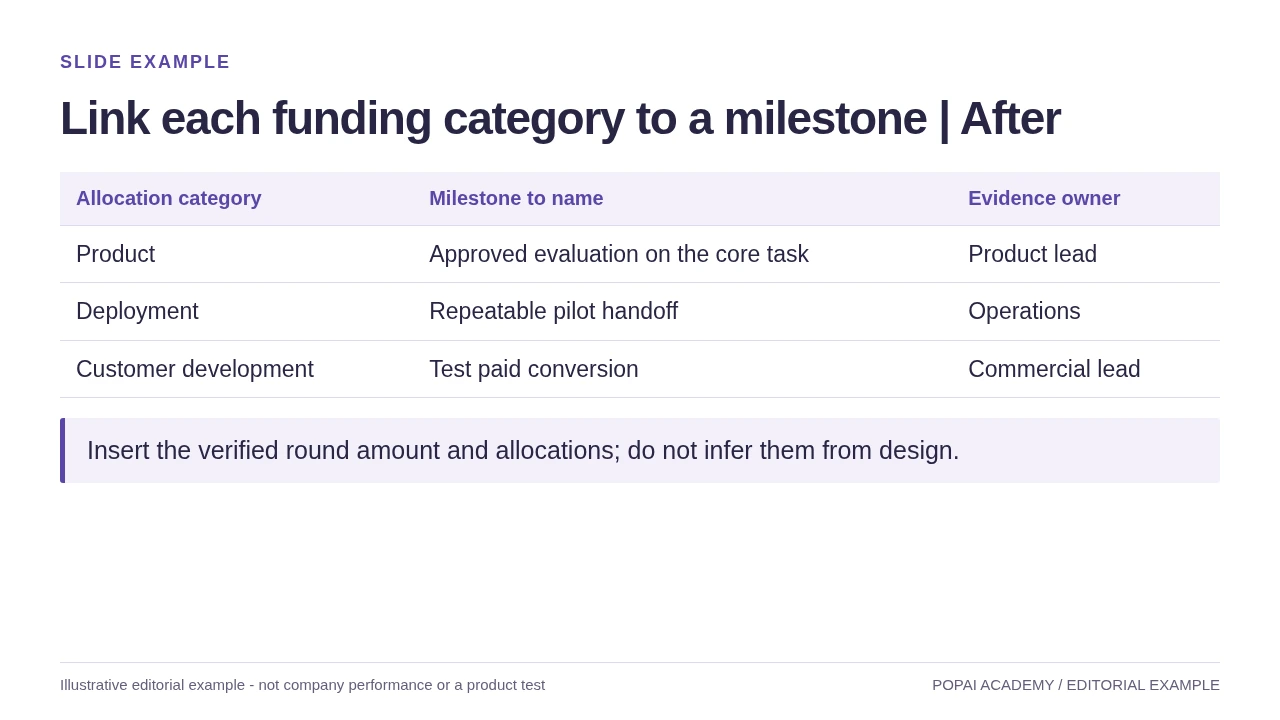
After: The ask slide is a visual map; funding strategy belongs in the fundraising guide.
Read or copy the slide content
Allocation category
Milestone to name
Evidence owner
Product
Approved evaluation on the core task
Product lead
Deployment
Repeatable pilot handoff
Operations
Customer development
Test paid conversion
Commercial lead
Insert the verified round amount and allocations; do not infer them from design.
Prompt for Link each funding category to a milestone
Create a slide with the purpose "Link each funding category to a milestone | After". Use these approved source fields or replace the illustrative inputs before use: Allocation category Milestone to name Evidence owner Product Approved evaluation on the core task Product lead Deployment Repeatable pilot handoff Operations Customer development Test paid conversion Commercial lead Insert the verified round amount and allocations; do not infer them from design.. Preserve labels, units, source notes and any uncertainty. Do not add results, claims, customers or capabilities. Suggest a readable layout and keep the output editable in the chosen tool.
Make layouts, colors, and fonts consistent
A small set of repeatable visual rules makes a deck easier to scan and keeps AI-generated layouts from feeling like unrelated slides.
Use a clear type hierarchy: a prominent takeaway headline, a smaller supporting label, and body text that remains readable from the back of the room. As a starting point for a widescreen deck, many teams use headlines around 28–36 pt and body text around 18–24 pt; these are practical ranges, not guarantees. If a slide only works when projected at full size, check it on a laptop and phone as well. Use two typefaces at most unless your brand system specifies otherwise.
Choose a primary brand color, a supporting color, and neutrals; reserve a contrasting accent for the one item viewers should notice. Check contrast in grayscale and do not rely on color alone to distinguish chart series—add direct labels, markers, or patterns where useful. Align text and objects to a consistent grid, keep margins generous, and use the same position for recurring elements such as page numbers and section labels.
Use a takeaway headline and one visual proof point
For a problem slide, replace a generic title like “The Problem” with a claim such as “Facilities teams find energy waste too late.” Pair it with one specific customer example or a simple workflow diagram; keep context and source information nearby. For a traction slide, use a headline that states what changed, a chart with a visible time period and denominator, and a short note on the metric definition. This gives the audience a reading order: takeaway, evidence, qualification.
Use product screenshots when the interface itself is evidence: crop to the relevant screen, enlarge the important area, and remove distracting browser chrome or personal data. Use a diagram to explain a process or system, not as decoration. Avoid generic AI-generated images that suggest customers, facilities, or product capabilities you cannot substantiate.
When a tool offers multiple themes or layouts, treat them as drafts. In any AI-assisted workflow, compare slides side by side for headline placement, margins, chart styles, and image treatment; regenerate or manually align pages that drift. You can explore PopAi AI Presentation as one option for creating and refining a deck, but confirm the available editing and export features in the product before relying on them for a deadline. The design checks above apply regardless of tool.
Turn startup metrics into trustworthy charts
Make the comparison, denominator, and time period visible so a technically accurate metric does not create a misleading impression.
Choose a chart for the question: a line chart for change over time, bars for category comparisons, or a metric card for one result with its definition and period. For a business with a small number of customers, show the count alongside a percentage; “retention improved 50%” can sound substantial while describing a change from two retained accounts to three. Avoid smoothing or truncating axes in ways that exaggerate a change.
Illustrative metric example: Suppose a startup reports 40% “activation” among 50 new accounts in March. A responsible slide defines activation as completing a specified setup action within 14 days, identifies the cohort as accounts created in March, and shows the count (20 of 50). If the latest cohort has had less than 14 days to activate, compare only cohorts with the same observation window or mark the newer result as preliminary.
Metric definitions vary by business model. A marketplace may need to distinguish gross transaction value from net revenue; a SaaS company may need to define active accounts and churn; a hardware company may report units shipped separately from units installed. State which measure you use and keep the definition consistent across slides.
- Put the period, unit, denominator, and relevant segment near the chart.
- Label actual results separately from targets, forecasts, and scenario assumptions.
- For projections, state the key assumptions and avoid presenting a scenario as a guaranteed outcome.
- For market sizing, cite the source and explain the calculation rather than displaying an unsupported headline number.
- Check that each chart matches the source spreadsheet or reporting dashboard.
Small samples and long sales cycles need extra context: show the count and observation window, and avoid implying that an early signal is a stable trend. If a metric changed because its definition changed, annotate the break rather than plotting the values as if they were directly comparable.
Review, refine, and export the presentation
Review in separate passes so a visual polish pass does not distract from a factual problem.
A useful sequence is: approve the story, verify claims, standardize the design, check accessibility, then test the exported deck in presentation conditions. Assign the checks according to the team: the founder or metric owner verifies business claims; a cofounder or colleague reads for narrative gaps; and the person presenting tests the final file and rehearsal timing.
Run four quality-control passes
- Content and claims: Check names, dates, customer permissions, metric definitions, sources, and the status of every result. Resolve conflicts between documents by identifying the current source of truth; do not let the AI choose which figure is correct.
- Visual consistency: Compare slides side by side for type hierarchy, alignment, spacing, chart styles, and image treatment. Remove repeated points and split any slide that asks the audience to read several competing messages.
- Accessibility and legibility: Check contrast, readable labels, descriptive chart titles, and meaning that does not depend on color alone. Zoom out to a slide-sorter view, then test key pages on the screen or projector you will use.
- Delivery and export: Open the exported file, compare it with the source deck page by page, and check fonts, line breaks, images, charts, notes, and transitions. Rehearse aloud with a timer and confirm that the deck still works if a transition or animation fails.
Before uploading source files, check whether they contain customer names, unreleased financials, personal data, or material covered by an NDA. Follow company policy and the tool’s current privacy terms; when in doubt, redact identifiers or use approved, aggregated figures. For a live product demo, keep a screenshot or short recorded walkthrough as a backup in case connectivity or the product environment fails.
Check the chosen tool’s current export options and test the file in the software you will present from; editable elements and layout fidelity can vary by format and application. A clean-looking preview is not proof that the exported PPTX or PDF will render identically.
Final decision check: Can the audience state the main point, see what evidence supports it, and identify the next step? If not, revise the story before adding more decoration.