This page focuses on redesigning an existing listing or comparative market analysis (CMA) deck. It covers proportional cropping, verified feature annotations, comparable-sale matrices and price-range graphics. It does not choose a property's asking price, generate a valuation or replace a listing-template library.
Four Listing and CMA Design Comparisons
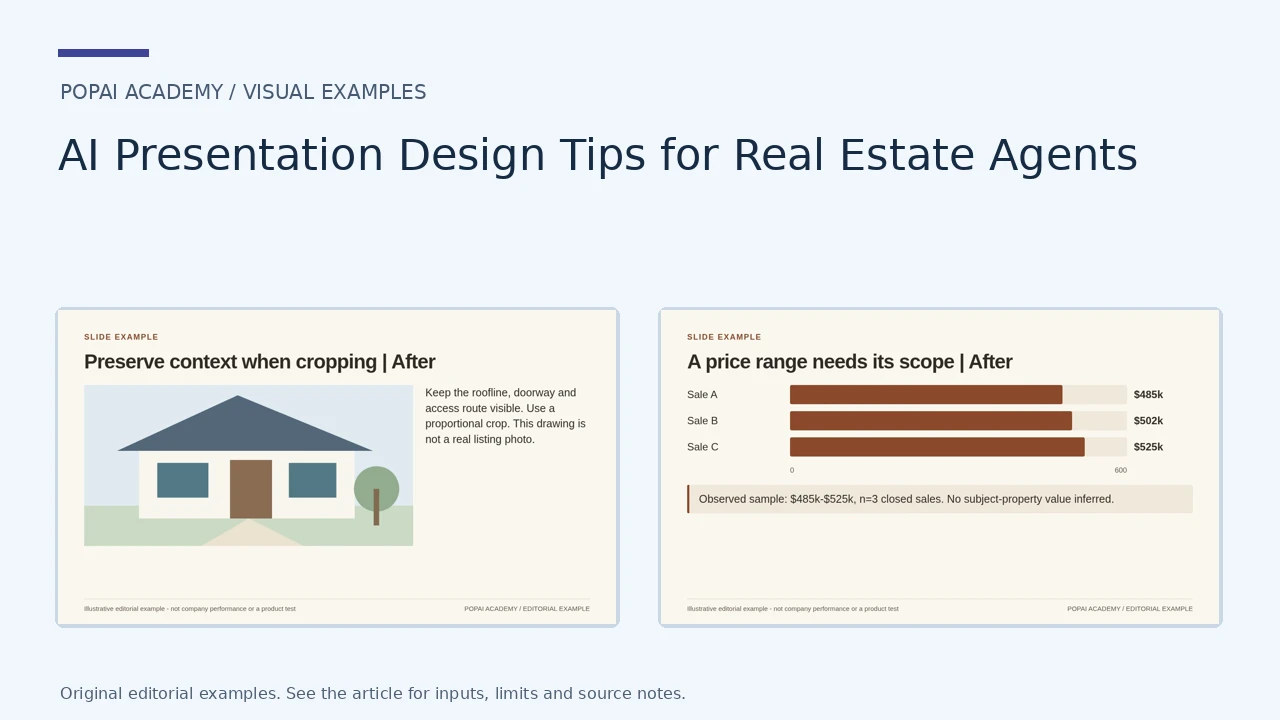
The first comparison uses an original architectural illustration to explain cropping, not a real listing photograph. The other examples use fictional closed-sale figures. Keep real photos, property attributes and pricing evidence unchanged during design edits.
Open full-size examples and editable HTML layoutsPreserve context when cropping
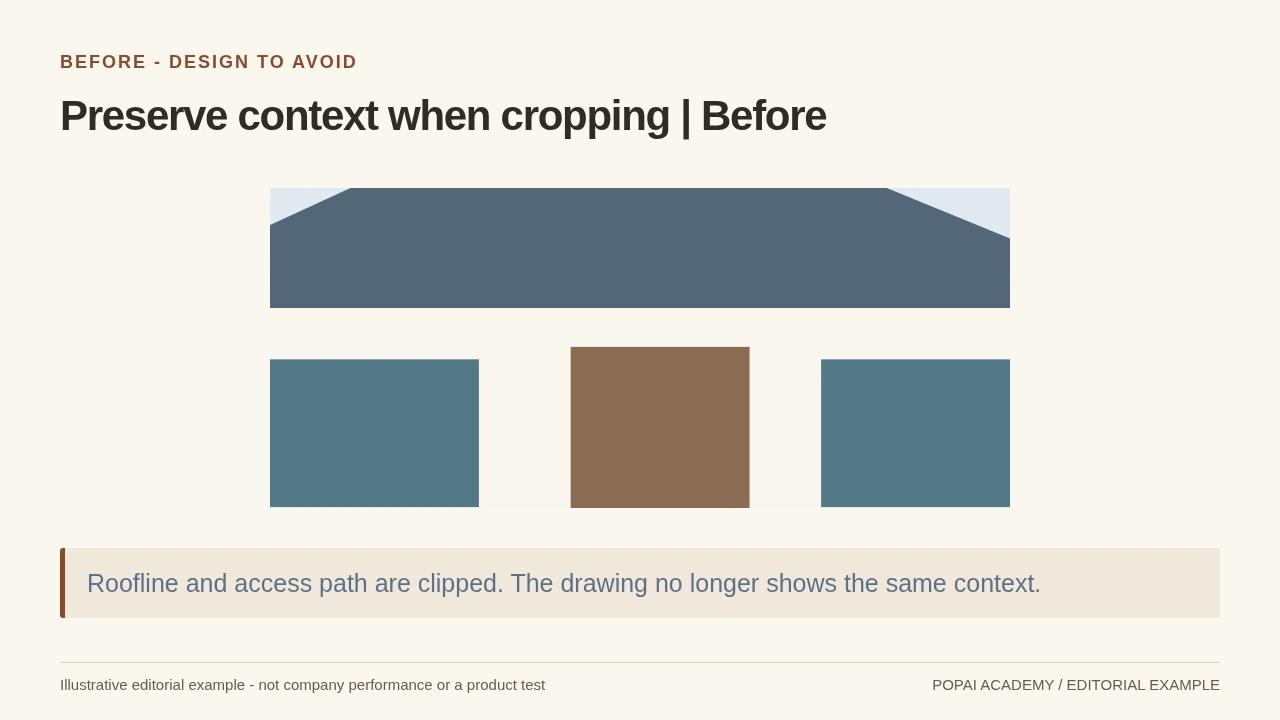
Before: an overly tight crop of the same architectural illustration removes context. It is not a real property photograph.
Read or copy the slide content
Roofline and access path are clipped. The drawing no longer shows the same context.
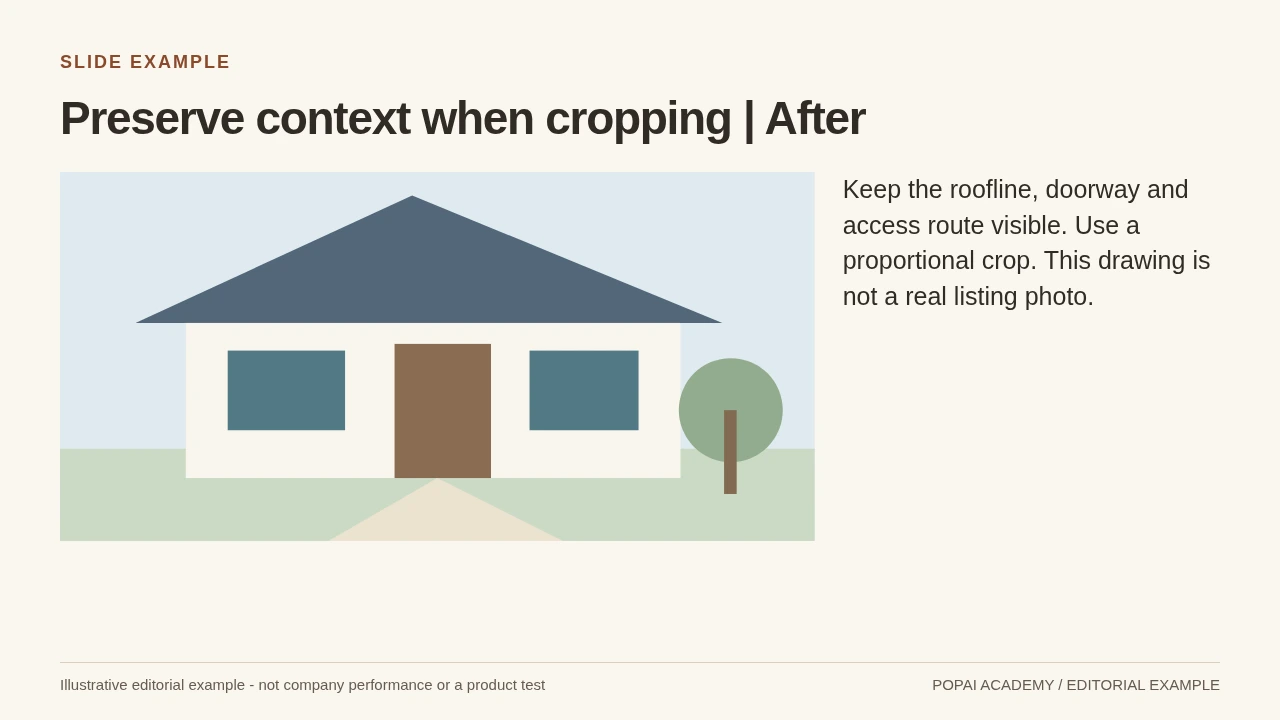
After: Schematic crop example: preserve physical context; never alter a real property feature.
Read or copy the slide content
Keep the roofline, doorway and access route visible. Use a proportional crop. This drawing is not a real listing photo.
Prompt for Preserve context when cropping
Create a slide with the purpose "Preserve context when cropping | After". Use these approved source fields or replace the illustrative inputs before use: Keep the roofline, doorway and access route visible. Use a proportional crop. This drawing is not a real listing photo.. Preserve labels, units, source notes and any uncertainty. Do not add results, claims, customers or capabilities. Suggest a readable layout and keep the output editable in the chosen tool.
Annotate verified features only
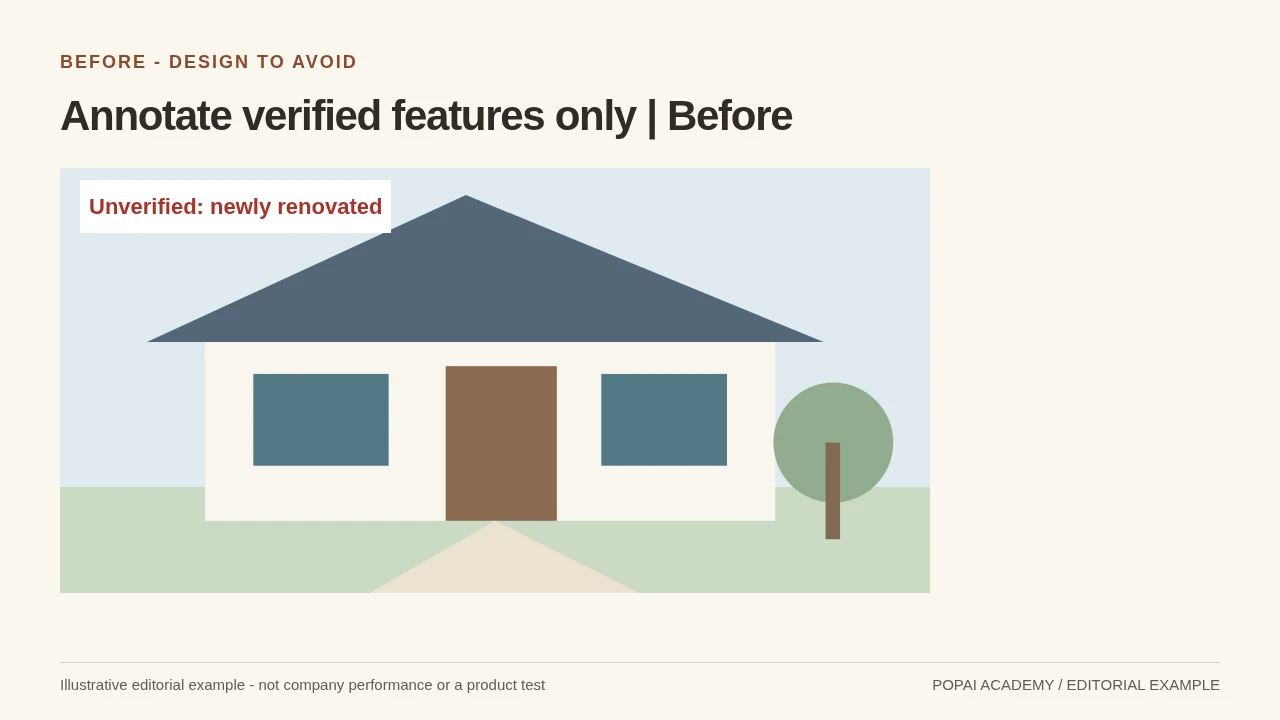
Before: a marketing label asserts an upgrade not established by the illustration or any property record.
Read or copy the slide content
Unverified: newly renovated
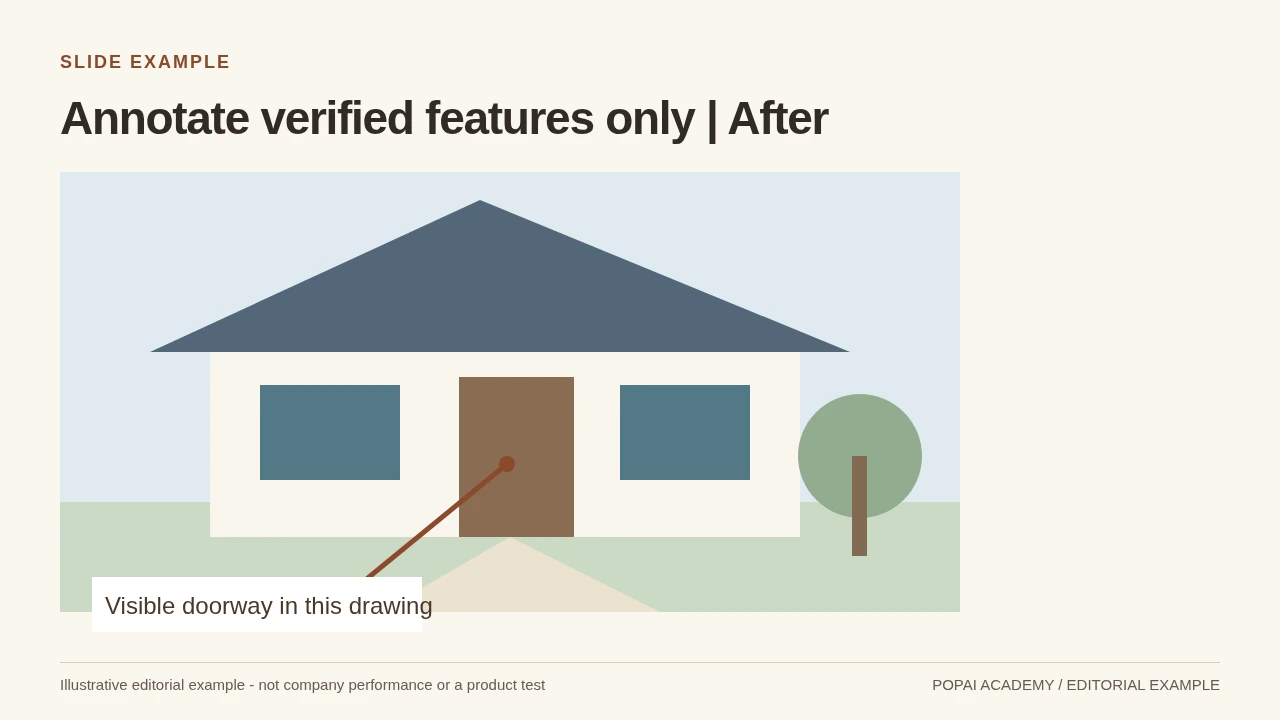
After: a restrained annotation points to the visible feature. Actual property descriptions still require approved source records.
Read or copy the slide content
Visible doorway in this drawing
Prompt for Annotate verified features only
Create a slide with the purpose "Annotate verified features only | After". Use these approved source fields or replace the illustrative inputs before use: Visible doorway in this drawing. Preserve labels, units, source notes and any uncertainty. Do not add results, claims, customers or capabilities. Suggest a readable layout and keep the output editable in the chosen tool.
Comparable sales are not interchangeable
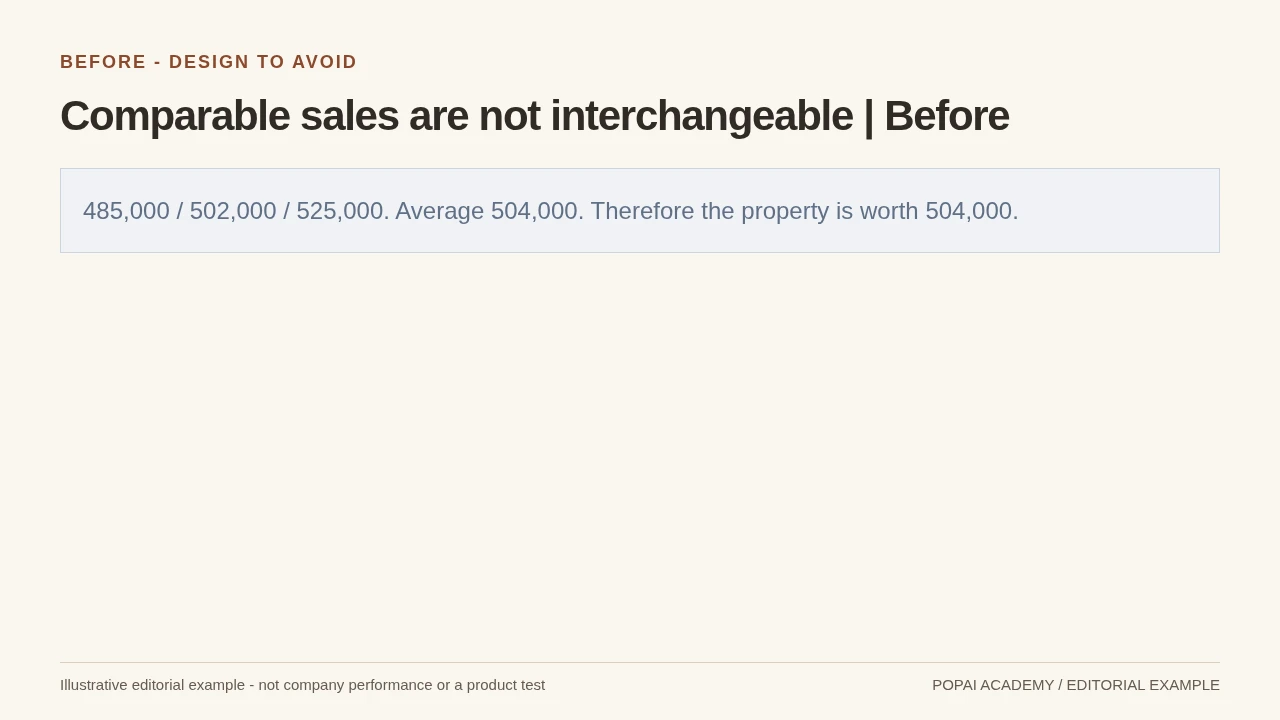
Before: Add status, period and relevant differences; preserve the worked example's price range.
Read or copy the slide content
485,000 / 502,000 / 525,000. Average 504,000. Therefore the property is worth 504,000.
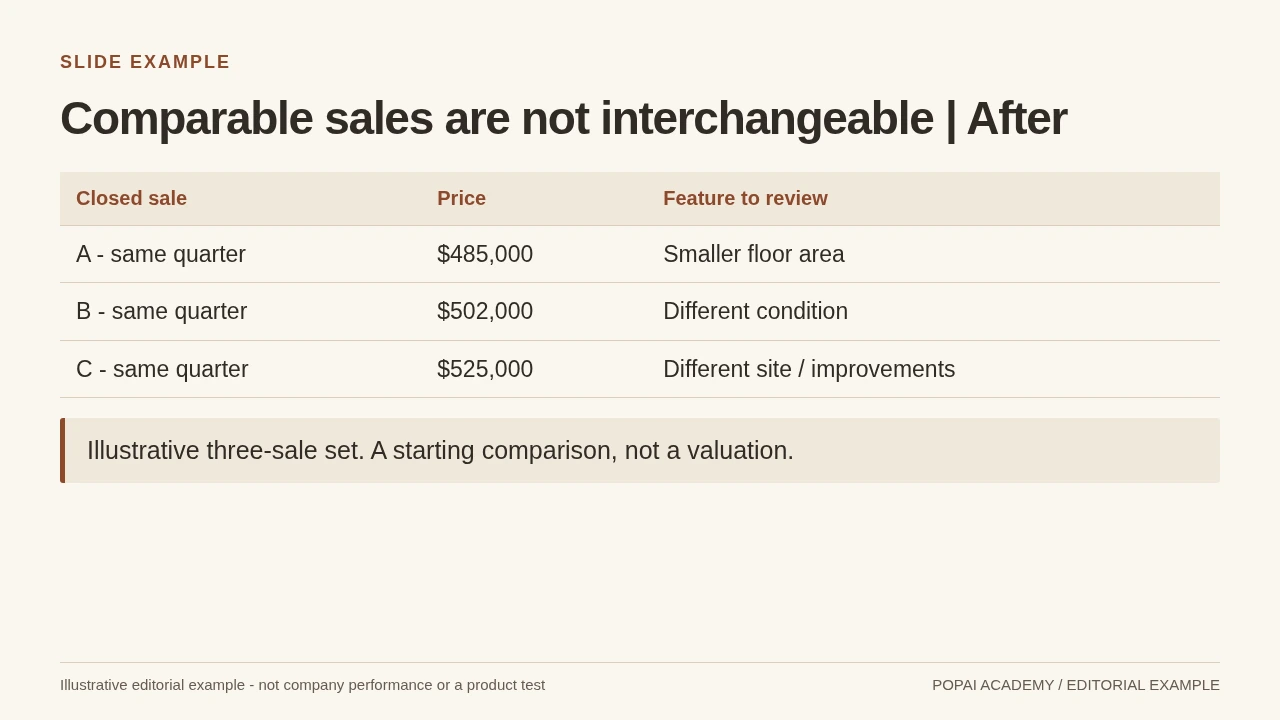
After: Add status, period and relevant differences; preserve the worked example's price range.
Read or copy the slide content
Closed sale
Price
Feature to review
A - same quarter
$485,000
Smaller floor area
B - same quarter
$502,000
Different condition
C - same quarter
$525,000
Different site / improvements
Illustrative three-sale set. A starting comparison, not a valuation.
Prompt for Comparable sales are not interchangeable
Create a slide with the purpose "Comparable sales are not interchangeable | After". Use these approved source fields or replace the illustrative inputs before use: Closed sale Price Feature to review A - same quarter $485,000 Smaller floor area B - same quarter $502,000 Different condition C - same quarter $525,000 Different site / improvements Illustrative three-sale set. A starting comparison, not a valuation.. Preserve labels, units, source notes and any uncertainty. Do not add results, claims, customers or capabilities. Suggest a readable layout and keep the output editable in the chosen tool.
A price range needs its scope
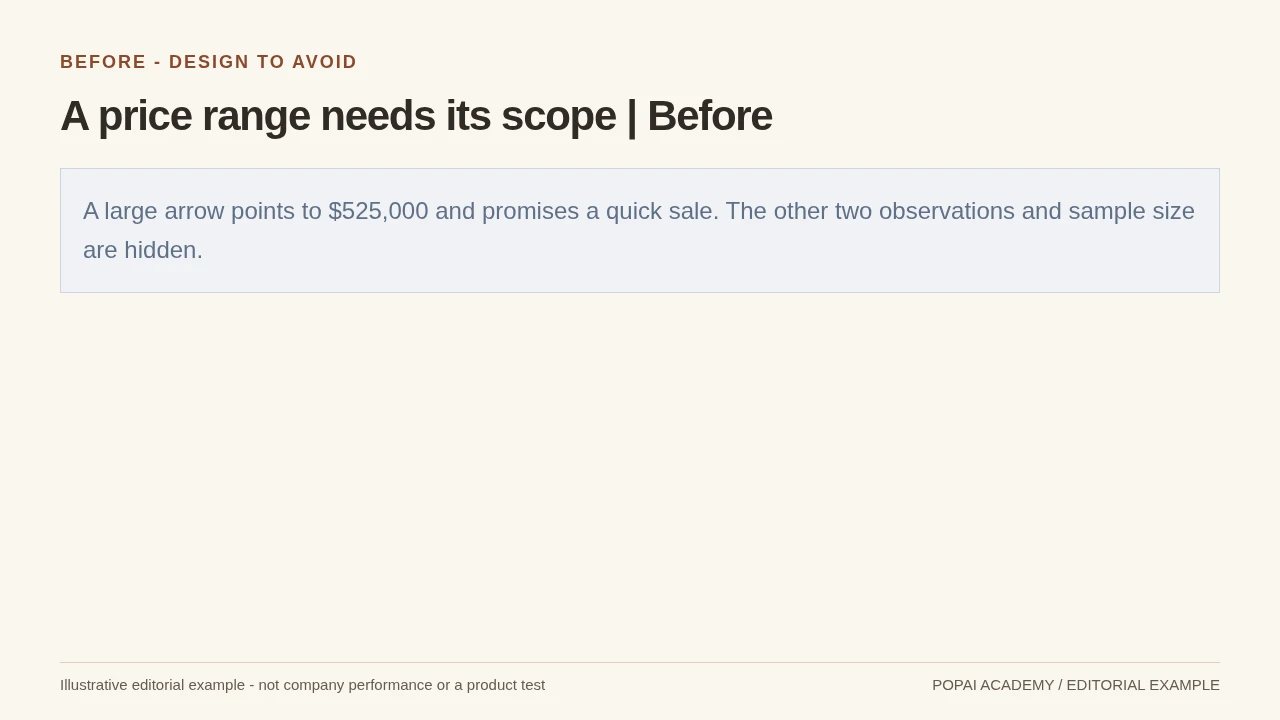
Before: Use a labeled sample range; avoid guaranteed pricing or a misleading valuation cue.
Read or copy the slide content
A large arrow points to $525,000 and promises a quick sale. The other two observations and sample size are hidden.
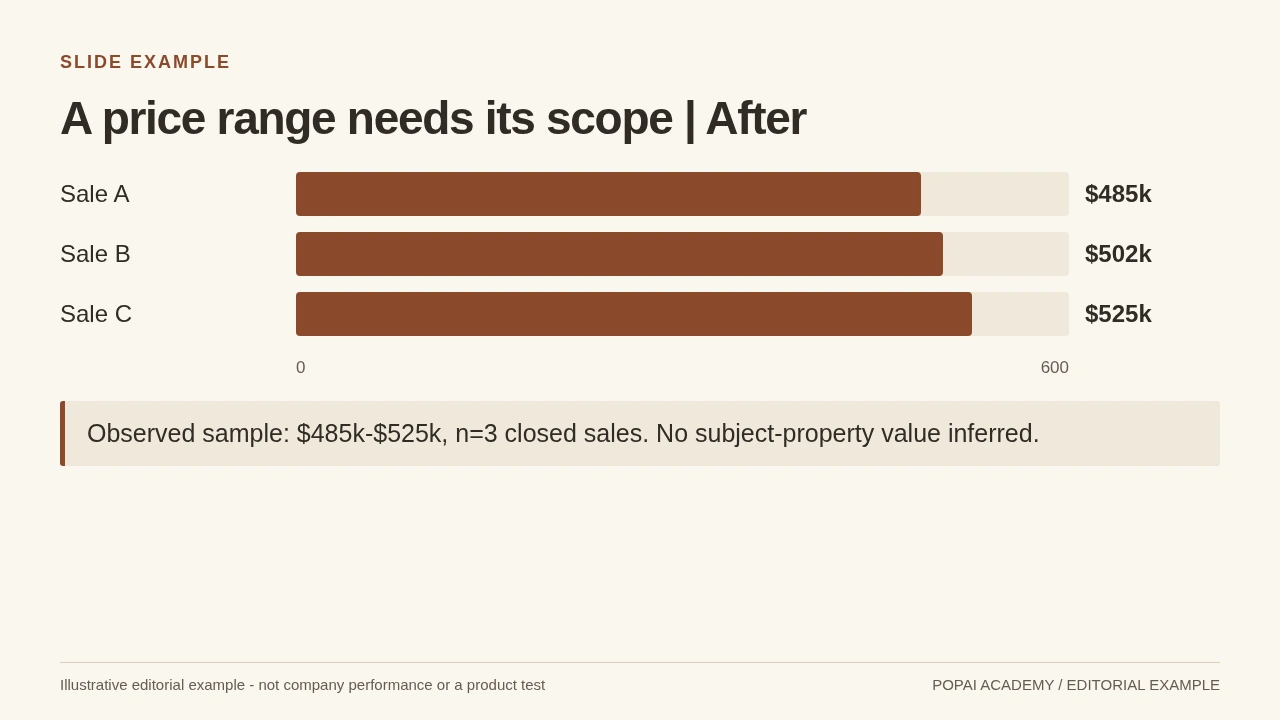
After: Use a labeled sample range; avoid guaranteed pricing or a misleading valuation cue.
Read or copy the slide content
Sale A
$485k
Sale B
$502k
Sale C
$525k
0
600
Observed sample: $485k-$525k, n=3 closed sales. No subject-property value inferred.
Prompt for A price range needs its scope
Create a slide with the purpose "A price range needs its scope | After". Use these approved source fields or replace the illustrative inputs before use: Sale A $485k Sale B $502k Sale C $525k 0 600 Observed sample: $485k-$525k, n=3 closed sales. No subject-property value inferred.. Preserve labels, units, source notes and any uncertainty. Do not add results, claims, customers or capabilities. Suggest a readable layout and keep the output editable in the chosen tool.
Build a Visual Story Clients Can Follow
Move from the client’s priorities to the property, then to evidence and a concrete plan.
Choose a visual for the job: use a property photo to introduce the home, a simple chart to show a market pattern, a map for a location question, and a short list for next steps. A photo is not a substitute for pricing evidence, and a chart is not automatically clearer than a table.
Make the takeaway visible at a glance
- Use a headline that states the point, such as “Three nearby sales frame a pricing discussion,” rather than a generic title like “Market Data.”
- Give the headline the strongest type hierarchy; keep supporting copy brief and readable from across a meeting room.
- Use one main visual per slide. Crop property photos consistently, avoid placing text over busy areas, and do not use imagery that implies an unverified feature.
- Keep chart labels, units, and legends large enough to read when projected or viewed on a phone. If a label must be tiny to fit, simplify the visual or split the slide.
- Use the same color for the same category throughout the deck, and do not rely on color alone to distinguish data.
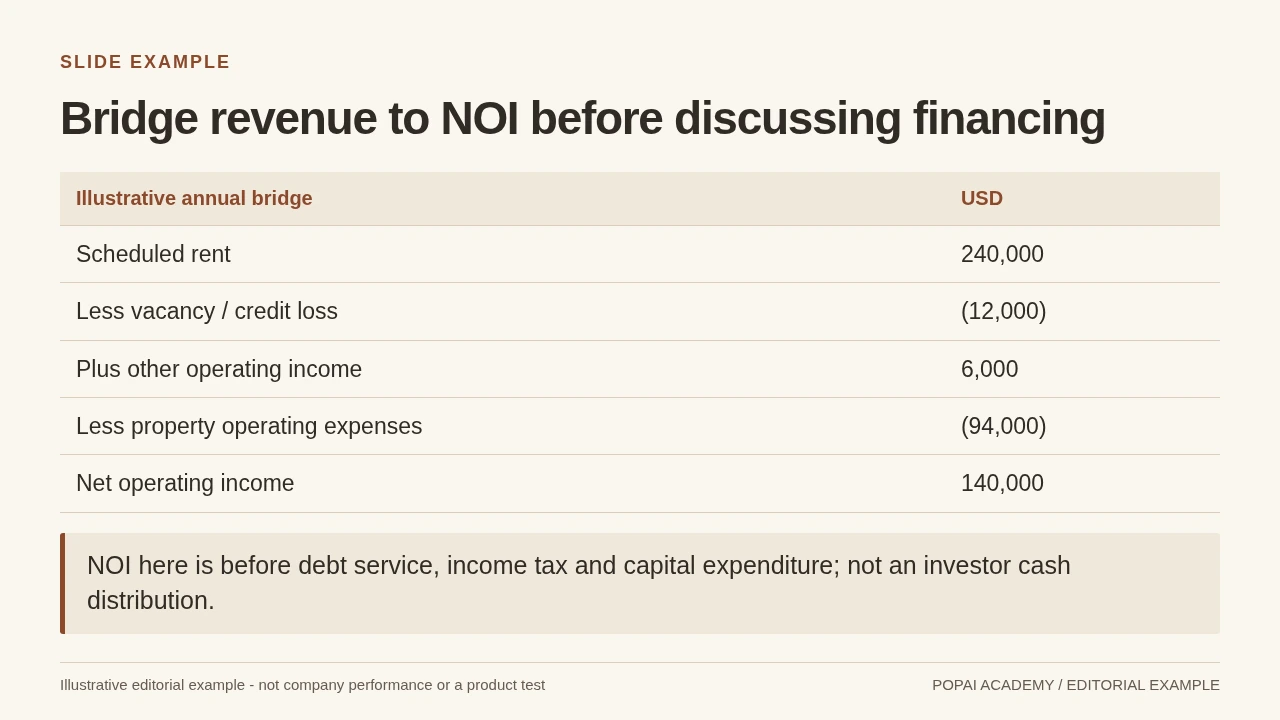
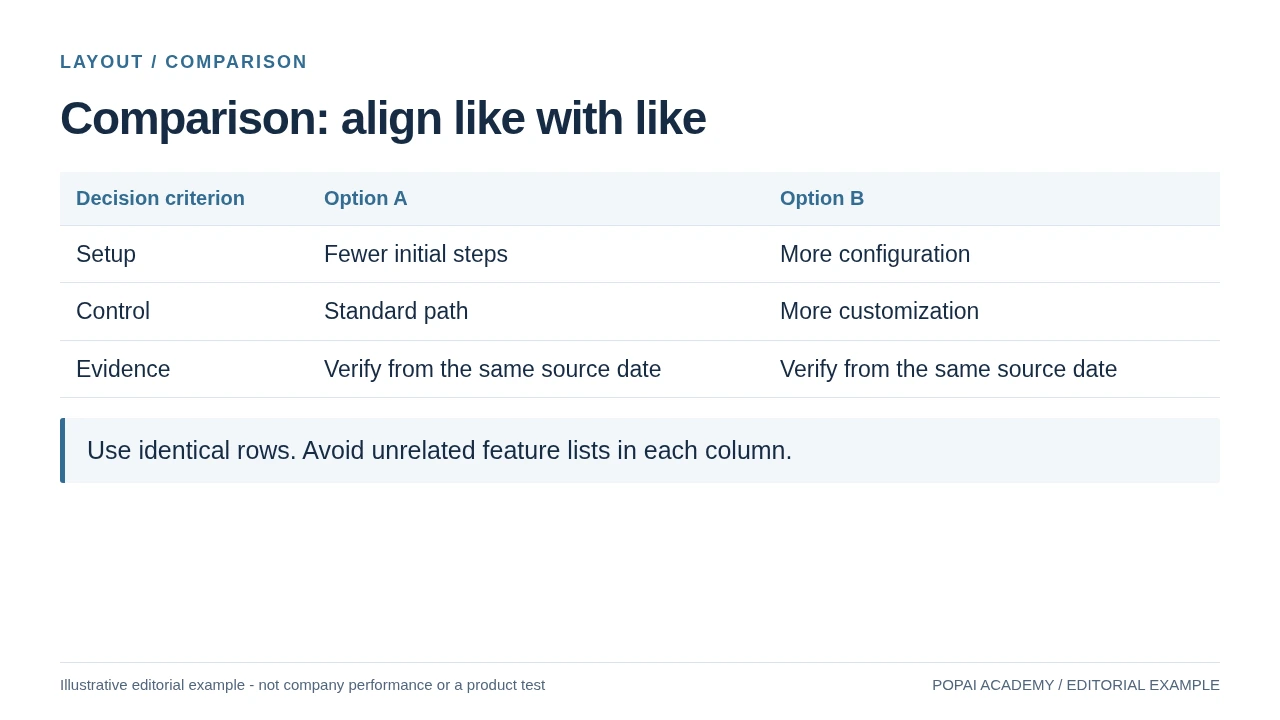
Worked CMA slide (illustrative figures): Imagine three nearby closed sales from the same quarter at $485,000, $502,000, and $525,000. A slide titled “Recent nearby sales range from $485,000 to $525,000” could use a simple three-row table rather than a bar chart if the homes differ in condition, size, or features. Show each sale’s status, closing month, and relevant distinguishing feature; add the search area, date range, source, and sample size below the table. The client-facing takeaway might be: “These sales provide a starting range; differences in condition and features need individual consideration.” Do not present the range as a valuation or imply the three properties are interchangeable.
Keep essential context visible on the slide: a caveat hidden in speaker notes will not help a client interpreting a screenshot or printed copy. Use notes for your fuller explanation—for example, why a sale was included or excluded—and an appendix for detailed calculations. A table is often more honest than a chart when the sample is small or the comparables are meaningfully different.
A visual can clarify a pattern, but it cannot make a small or uneven sample conclusive. Show what the data covers and explain what it cannot establish.
Set a Consistent Visual System and Make Charts Auditable
A restrained design system makes the slides feel cohesive without competing with the property or the evidence.
Build a visual system clients can read
Choose one display font for headings and a highly legible body font. Use a compact palette—such as a dark neutral, a light background, and one accent—and reserve the accent for key findings or actions. Check text and chart contrast on a laptop and in a projected or printed view. Keep margins, logo placement, heading styles, and photo treatment consistent; avoid decorative effects that make a professional deck harder to scan.
Show the basis and limits of every market chart
For a CMA chart, make the geography, date range, metric, sample size, and property status clear. Identify whether the figures represent closed sales, active listings, or pending properties, and include the source and retrieval date. Explain adjustments separately from raw figures; do not make non-comparable properties look directly interchangeable through a tidy average.
Chart check: Match every value to the source spreadsheet or report, confirm the time period and units, and inspect the axis for visual exaggeration. If the data set is small, mixed, or uneven, use a labeled table and explain the differences instead of aggregating it into a single trend line. If a chart is edited in presentation software, verify both the displayed values and any underlying data table; editing features and export behavior vary by product and version.
Review the Draft, Then Test the Export
Use a staged review to catch different problems before they reach the client.
Check facts and the strength of each claim
Separate verifiable facts, sourced market evidence, and professional judgment. For example, replace “This is the best time to sell” with a dated, sourced observation about current market conditions and explain how it informs your recommendation. Describe a pricing scenario as an estimate or discussion option, not a promise. Remove any claim you cannot support.
- Match property details, dates, calculations, comparable selections, and chart labels to the source records.
- Check that the source, search area, period, and sample size are visible wherever market evidence appears.
- Confirm that the slide’s headline does not claim more than the evidence shows; keep necessary limitations visible to the client.
Review privacy, imagery, and client-facing language
- Remove unnecessary personal or confidential information from the deck and any shared links.
- Check that photographs represent the property accurately. Follow applicable MLS and brokerage rules for virtual staging, retouching, and image disclosures.
- Review neighborhood and school references for relevance, accuracy, and neutral wording. Use sourced facts where appropriate; avoid subjective quality claims or language that could steer clients. Follow brokerage policy and applicable fair-housing and local guidance, and ask a qualified broker or compliance contact about uncertain wording.
- Replace generic claims such as “highly desirable area” with a verified, relevant fact—or remove the phrase.
Inspect the file you will actually present
Read the slides aloud, remove repeated points, and rehearse the transitions between evidence and recommendation. Export to the format you plan to use, then check it on the presentation device and, if clients will receive it, on a phone. Inspect font substitutions, image crops, chart labels, hyperlinks, page breaks, and offline access. Confirm that text, chart labels, and underlying chart data are editable in the chosen file; an editable text box does not necessarily mean an editable chart. Product behavior can vary by application and version, so test the actual export rather than assuming it will match the editor.
Avoid Design and Compliance Pitfalls That Erode Trust
Use this final red-flag check to catch risks that a visual polish pass can miss.
- Pricing claim: Red flag—“This home will sell for $600,000.” Safer approach—show the evidence and a clearly labeled estimate or scenario, explain limitations, and state that the result is not guaranteed.
- Property description: Red flag—an AI-generated claim about an upgrade or amenity not present in the source records. Safer approach—use only confirmed details and ask for verification when information is missing.
- Generated imagery: Red flag—a staged or altered image that could be mistaken for an accurate depiction. Safer approach—use accurate listing images and follow applicable rules for labeling or disclosure of edits.
- Neighborhood or school claim: Red flag—subjective wording such as “the perfect family neighborhood” or an unsupported school-quality claim. Safer approach—use relevant, neutral, sourced information and follow brokerage and local guidance.
- Market comparison: Red flag—a chart that combines unlike properties or hides its search period. Safer approach—show the sample and date range, explain differences, and use a table when aggregation would imply false precision.
Before sharing, ask whether a client can identify the main takeaway, its evidence, and its limits without relying on you to explain away an unclear slide. If not, simplify the design or make the source and caveat more visible.