AI Case Study Presentation Template for Structure and Evidence
Published on April 21, 2026
An AI case study presentation should prove that an AI project solved a real problem, not simply describe a model or tool. The deck needs a clear audience, a before-and-after baseline, evidence that the solution worked, and a practical takeaway the viewer can act on.
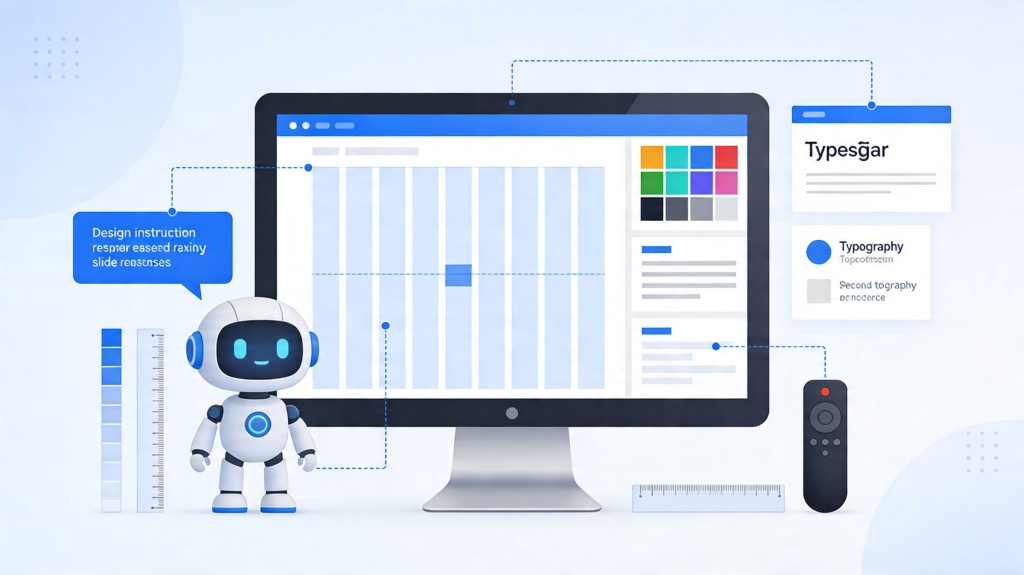
This guide is a scenario and template page for marketing teams, sales teams, founders, consultants, product managers, and AI teams who need to present a customer success story, internal AI rollout, pilot result, or technical proof of value. For the broader deck creation workflow, connect this long-tail page to the AI for presentations core guide, then use PopAi AI Presentation when you are ready to generate and edit the deck.
AI Case Study Presentation: Target Users and Use Cases
Start by deciding who the deck is for. A case study for a sales prospect needs different proof than an internal leadership update or a technical postmortem.
Sales or customer success team
Use the deck to show a prospect how a similar customer moved from problem to outcome. The key slides should focus on the pain point, implementation path, measurable result, and customer quote.
Founder or consultant pitching credibility
Use the deck to show repeatable expertise. The structure should make the before state, intervention, proof, and next-step recommendation obvious without exposing private client details.
AI or product team reporting an internal pilot
Use the deck to explain what was tested, what evidence was collected, what improved, what failed, and whether the project should scale.
Recommended Case Study Deck Structure
A useful case study deck is usually 8 to 12 slides. It should tell a complete story while keeping the evidence easy to verify.
| Slide | Purpose | What to Include |
|---|---|---|
| 1. Title and audience | Set context | Customer type, project name, industry, date, and intended audience. |
| 2. Executive summary | State the result | One-sentence problem, one-sentence solution, and 2 to 3 headline outcomes. |
| 3. Customer or business problem | Show why it mattered | Baseline pain, constraints, stakes, and who was affected. |
| 4. Before evidence | Establish the baseline | Time, cost, error rate, conversion, backlog, satisfaction, or other starting metrics. |
| 5. AI solution | Explain what changed | Workflow, model role, human review step, data source, and implementation boundary. |
| 6. Implementation timeline | Make it credible | Discovery, pilot, validation, launch, and iteration steps. |
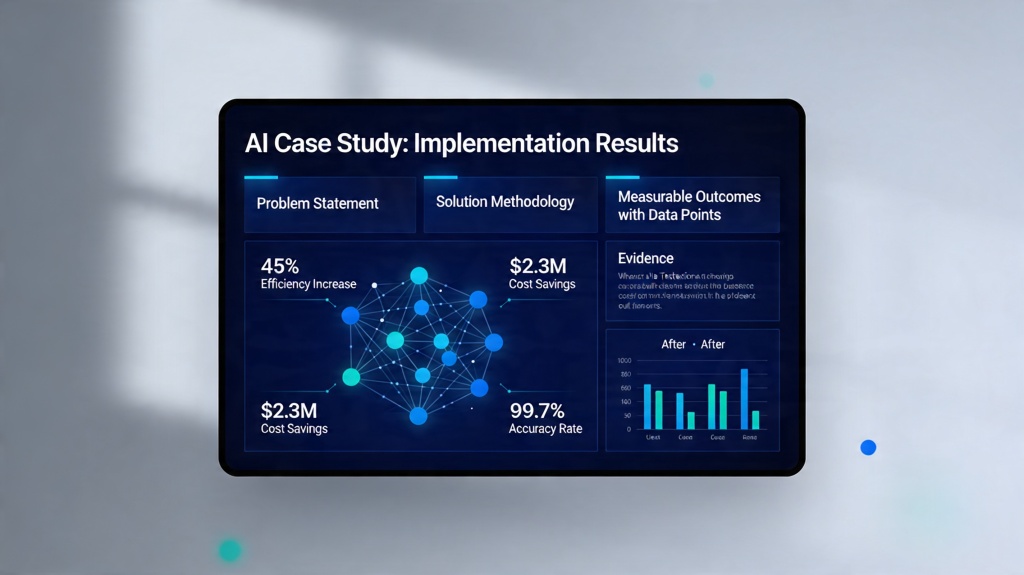
| 7. Results and proof | Show evidence | Before-after metrics, screenshots, charts, testimonials, and limitations. |
| 8. Lessons learned | Build trust | What worked, what changed, risks managed, and what you would do differently. |
| 9. Next steps | Drive action | Scale plan, recommendation, ask, or follow-up offer. |
What Each Case Study Slide Should Say
AI can draft the structure, but you still need to supply the real evidence. Use this checklist before generating the deck.
- Problem slide: name the business friction and show why it mattered before AI was introduced.
- Baseline slide: include the metric the audience should compare against later.
- Solution slide: explain the AI role in plain language, not model jargon.
- Workflow slide: show inputs, AI processing, human review, and final output.
- Evidence slide: show before-after results and avoid unsupported claims.
- Quote slide: use a customer, user, or stakeholder quote that confirms the practical value.
- Lessons slide: mention limitations, risk controls, and what changed after feedback.
- Next-step slide: tell the audience what to approve, try, buy, or scale.
Evidence rule: If a result cannot be traced to a source, timeframe, or baseline, write it as a hypothesis or remove it from the case study.
AI Generation Prompt for a Case Study Deck
Use this prompt after you have gathered the baseline numbers, project notes, customer quote, and final results.
Create a 9-slide case study presentation for [audience]. Case study topic: [project/customer/use case]. Problem: [before state]. Baseline evidence: [metrics]. AI solution: [workflow, model role, human review]. Implementation timeline: [steps]. Results: [before-after metrics, qualitative feedback]. Limitations: [risks or caveats]. Create slide titles, concise bullets, suggested visuals, and speaker notes. Keep claims evidence-based and mark any missing proof as a placeholder.
After the first draft, ask AI to simplify technical language for the audience. For example, "semantic retrieval pipeline with human validation" can become "AI finds the most relevant support content, then a reviewer confirms the answer before publishing."
Example Case Study Copy and Scenarios
Example 1: Customer support AI pilot
Problem: Support agents spent too much time searching old tickets. Solution: AI suggested answer drafts from approved help content with human review. Evidence: Average first response time dropped from 8 minutes to 4.5 minutes during a four-week pilot, while QA pass rate stayed above 92%.
Example 2: Marketing content analysis case study
Problem: The team could not identify which campaign messages drove qualified leads. Solution: AI grouped call notes, ad comments, and landing page feedback into recurring objections. Evidence: The next campaign rewrote three landing page sections and increased demo form completion by 18% compared with the previous month.
Frequently Asked Questions
What should an AI case study presentation include?
It should include the audience, problem, baseline evidence, AI solution, workflow, measurable results, limitations, lessons learned, and a clear next step.
How many slides should a case study deck have?
Most case study decks work best at 8 to 12 slides. That gives enough space for the problem, evidence, solution, results, and lessons without becoming a technical report.
Can AI write a case study presentation from notes?
Yes. AI can organize notes, metrics, quotes, and transcripts into a structured draft, but you should verify the evidence, anonymize sensitive data, and remove any unsupported claims.
Create your case study deck faster
Use PopAi to turn project notes, metrics, and proof points into an editable case study presentation draft.
Try PopAi for Free