Turn Social Media Content into Presentations with AI
Published on August 03, 2026

Social media content can become a useful presentation when it is treated as evidence, not decoration. The revised workflow is shorter and more platform-specific: collect posts and metrics, label what each post proves, map platform formats to slide formats, then create a deck for a clear decision.
Platform Mapping Examples
| Platform | Source content | Best slide format | What to avoid |
|---|---|---|---|
| Carousel, Reel, story screenshot, comment theme. | Visual sequence, creative-learning slide, or campaign mood board. | Using screenshots without permission or context. | |
| Long post, poll, founder post, company update. | Claim-evidence-implication slide or audience-insight summary. | Treating likes as proof of revenue impact. | |
| TikTok / Reels / Shorts | Hook, script, captions, comments, watch pattern. | Hook analysis, content formula, or creator-learning slide. | Copying creator footage into public decks without rights. |
| X / Threads | Short posts, quote posts, discussion threads. | Message testing, objection map, or conversation summary. | Overweighting a loud minority of replies. |
Synthetic Example: Campaign Recap Deck
Synthetic example This scenario is illustrative, not a real test result.
A SaaS team exports 15 posts from LinkedIn, Instagram, and TikTok about an onboarding feature. Instead of asking AI to summarize all posts, they create a source table with platform, post URL, date, format, hook, main claim, engagement rate, saves, comments, clicks, and qualitative comment themes.
| Source signal | Slide title | Decision supported |
|---|---|---|
| LinkedIn comments ask for implementation details. | Professional audiences want setup proof, not only feature benefits. | Add implementation screenshots to sales enablement. |
| Instagram carousel saves are high but clicks are low. | Educational content is useful but not enough for conversion. | Add a stronger CTA and landing-page link. |
| TikTok hook gets views but low qualified comments. | Entertainment hook creates reach without buyer intent. | Test a problem-first hook for the next sprint. |
Metrics, Screenshots, and Permission Rules
Use platform metrics carefully. Reach, impressions, views, saves, shares, clicks, comments, and conversions do not measure the same thing. When AI creates charts, ask it to keep platform metrics separate unless you have normalized them. Label screenshots with source platform, date captured, and whether the deck is internal or external.
- Use screenshots only when account, creator, and platform rules allow it.
- Blur usernames and profile images unless public use is approved.
- Separate paid campaign data from organic social data.
- Do not imply endorsement from a user comment without permission.
- Use links to original posts in speaker notes or appendix where appropriate.
Shorter Prompt for Social Media Decks
This shorter prompt avoids the common problem of turning every social post into its own slide. The final deck should answer what worked, why it may have worked, what evidence supports it, and what the team should do next.
If you manage marketing, sales enablement, creator partnerships, or training content, you probably have useful ideas scattered across LinkedIn posts, X threads, TikTok scripts, Instagram carousels, YouTube transcripts, comment threads, and campaign reports. This guide shows a practical workflow for turning that material into a deck for a meeting: a campaign recap, sales proof deck, founder update, influencer report, classroom discussion, or training module.
Here is the concrete scenario used throughout: 12 LinkedIn posts, 2 X threads, 3 short-form video scripts, 1 YouTube transcript, 86 tagged comments, and a CSV export of campaign metrics become a 10-slide recap deck with a recommendation slide, source appendix, and editable PPTX handoff. A prepared analytics export can support a faster first draft, but legal approval, customer permissions, screenshot review, and transcript cleanup can still take meaningful time.
The workflow works best for internal or stakeholder-facing decks where you control the source material. For public sales decks, investor decks, regulated industries, or decks using creator/customer content, add a permission and compliance review before sharing.
Why Use AI to Turn Social Media Content into a Presentation?
Use AI when you need to compress scattered social proof into a structured argument, not when you need a legally approved final deck with no human review.
Social media is where many teams first see audience signals: which message earned saves, which objection repeated in comments, which tutorial people replayed, which customer phrase spread, and which offer drove clicks or demo requests. A presentation makes those signals useful in meetings because it forces hierarchy: insight first, evidence second, recommendation third.
Not every social signal deserves the same weight. A high-reach post may reflect timing, paid amplification, controversy, or platform distribution rather than buyer interest. A lower-reach LinkedIn post with 17 comments from target accounts may be more useful for sales enablement than a viral TikTok with no downstream action. Treat engagement as a clue, then validate it against audience quality, conversion data, sales notes, or repeated comment themes.
Working example: In a B2B onboarding campaign, the top-reach post was a broad “remote work mistakes” carousel with 78,000 impressions but weak click-through. The post that shaped the deck was smaller: a LinkedIn post with 9,400 impressions, 42 comments, 11 saves, and 18 follow-up sales conversations. The presentation insight was not “remote work content performs.” It was “operations leaders are worried that onboarding is inconsistent across managers, so next month’s content should show manager-ready checklists and implementation examples.”
Deck-building principle: AI can group posts and draft slides, but it cannot know which metric your business actually trusts. Decide what counts as evidence before you generate the deck.
Tool-selection checkpoint: Before choosing a workflow, confirm whether the tool accepts the files you actually have: CSV exports for analytics, text or Docs for captions and transcripts, PDFs for campaign reports, PPTX for old decks, and images for screenshots. If you are comparing options, review AI presentation makers against source handling, outline preview, editable export, privacy controls, and team review features.
Collect and Clean Social Media Content Before Slide Creation
For a broader view of available tools, compare the latest AI presentation makers before choosing the workflow that best fits your team.
The quality of the presentation depends less on the AI prompt and more on the source brief you feed it.
Start by deciding the presentation’s job. A campaign recap needs objectives, hypotheses, metrics, and lessons learned. A sales deck needs proof points, customer language, and objection handling. A training deck needs sequenced instructions and examples. An investor update needs traction, channel learning, and credible momentum. Do not mix all of these goals in one deck unless the audience truly needs them.
Collect source material by platform
- LinkedIn: export available analytics from the post or company page, then copy the post text, URL, date, and notable comments into a spreadsheet. For creator or employee posts, ask the owner for screenshots or analytics if you do not have admin access.
- X threads: paste the full thread in order, include the original URL, and mark reply context separately. AI often loses sequence if each post is pasted as an isolated line.
- Instagram carousels and Reels: save the caption, slide text, thumbnail, post URL, date, and metrics from professional dashboard exports or screenshots. For carousels, include the slide order because that sequence often becomes the training or explanation structure.
- TikTok, Reels, and Shorts: use the script, transcript, hook, on-screen text, and retention or completion data if available. Raw video links are less reliable than transcripts plus screenshots of key frames.
- YouTube: download or copy the transcript, chapter timestamps, title, description, retention notes, comments, and traffic source data where available. Long transcripts should be split by section before prompting.
- Meta Business Suite, social schedulers, or analytics tools: export CSVs when possible. Keep the raw export unchanged and create a cleaned working copy so you can trace every chart back to the original data.
Use a clean source table
For a useful AI-generated deck, 10–20 well-labeled posts are usually better than 100 unfiltered posts. If you are building a monthly recap, include the top performers, the underperformers tied to important assumptions, and a small sample of audience comments. Store the working file as a spreadsheet or CSV for metrics, plus a text/Doc file for long captions, transcripts, and quotes.
- Minimum fields: platform, source URL, post date, campaign name, audience segment, post title, core idea, format, metric date range, impressions or reach, engagement actions, clicks or leads, comment themes, permission status, screenshot available, public/internal use allowed, recommended slide role, and confidence level.
- Naming convention: use consistent IDs such as 2026-01-LI-ONBOARDING-03 so screenshots, transcripts, rows, and slide notes match.
- Privacy cleanup: remove names, handles, emails, DMs, company-sensitive information, and any comment that could identify a person without approval.
- Source preservation: keep URLs, dates, and metric date ranges. “42 comments” is much less useful than “42 comments, LinkedIn, Jan 1–31, organic only.”
Cleaned content record example
Content ID: 2026-01-LI-ONBOARDING-03
Post title: “3 mistakes teams make in onboarding”
Platform/source: LinkedIn post; source URL saved in spreadsheet
Post date: Jan 8; metric range: Jan 8–31; traffic: organic only
Campaign: Onboarding quality series; audience: HR and operations leaders
Core idea: New hires need manager-ready examples, not policy PDFs.
Evidence: 9,400 impressions, 42 comments, 11 saves, 18 sales conversations tagged by SDRs.
Representative quote: “This is exactly why our onboarding feels inconsistent.” Permission needed for direct quote; paraphrase approved for internal use.
Recommended slide type: Problem-framing slide or sales objection slide.
Confidence level: Medium-high because comment quality and sales notes point to the same theme.
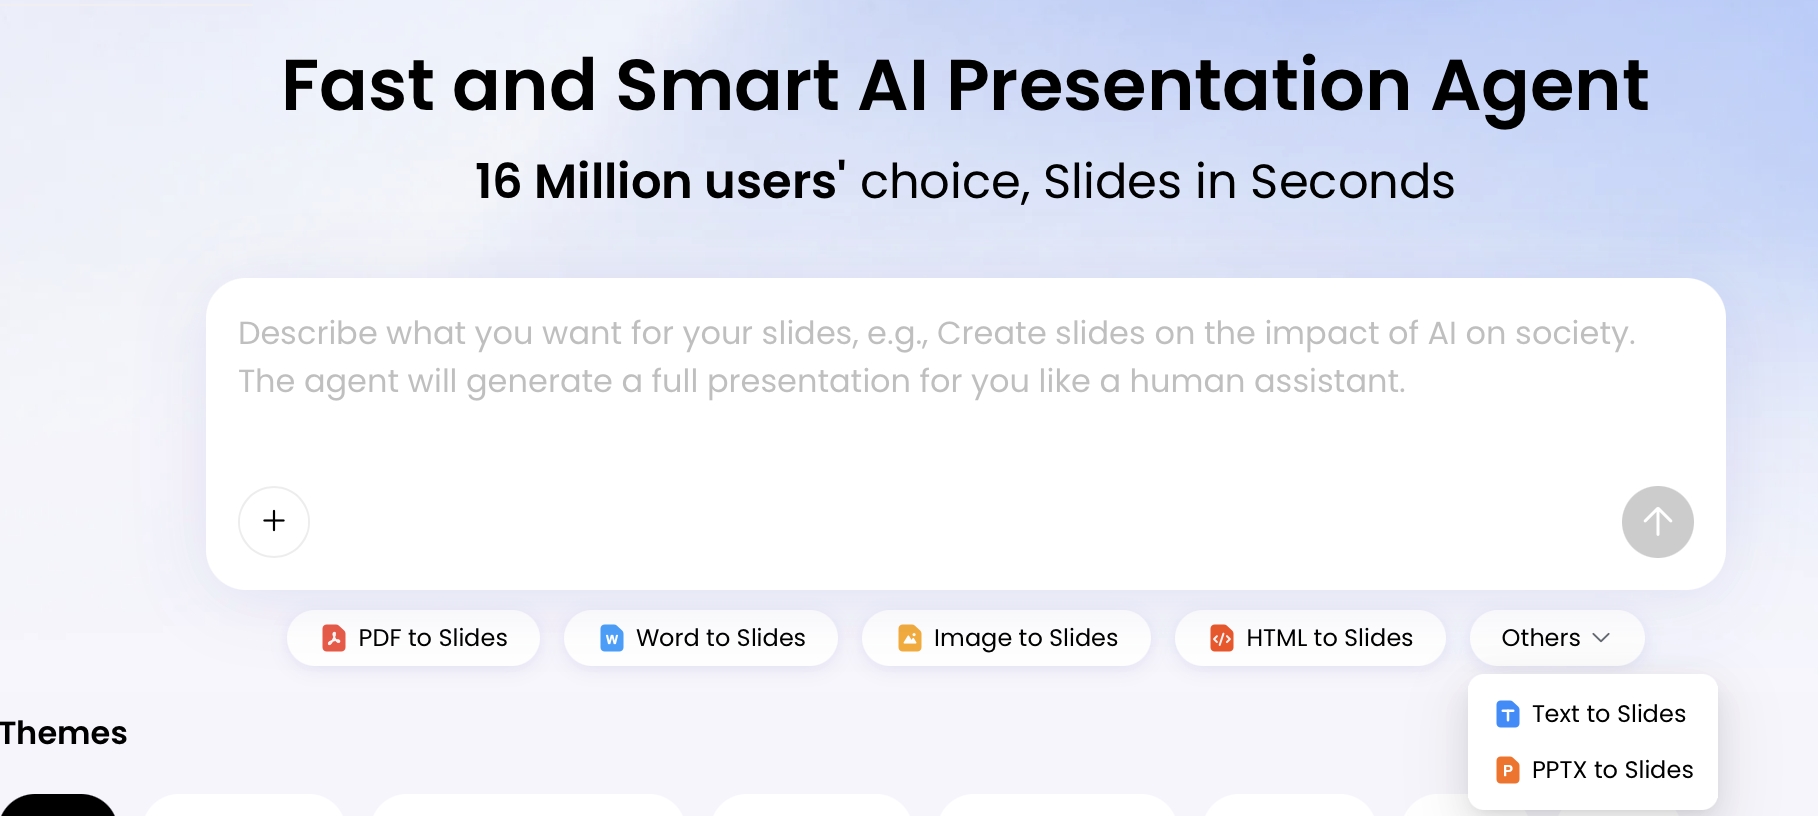
When you need to move from files into slides, PopAi AI Presentation can start from a prompt or from source materials such as PDF, Word, image, HTML, text, and PPTX inputs. In practice, use CSV or spreadsheet exports for metrics, text files for captions and transcripts, PDFs for campaign reports, PPTX for existing decks you want to update, and images only when screenshots are necessary—OCR can miss small UI text, so verify anything extracted from an image.
Build an AI Outline Before Generating Slides
The outline is where a pile of posts becomes a point of view.
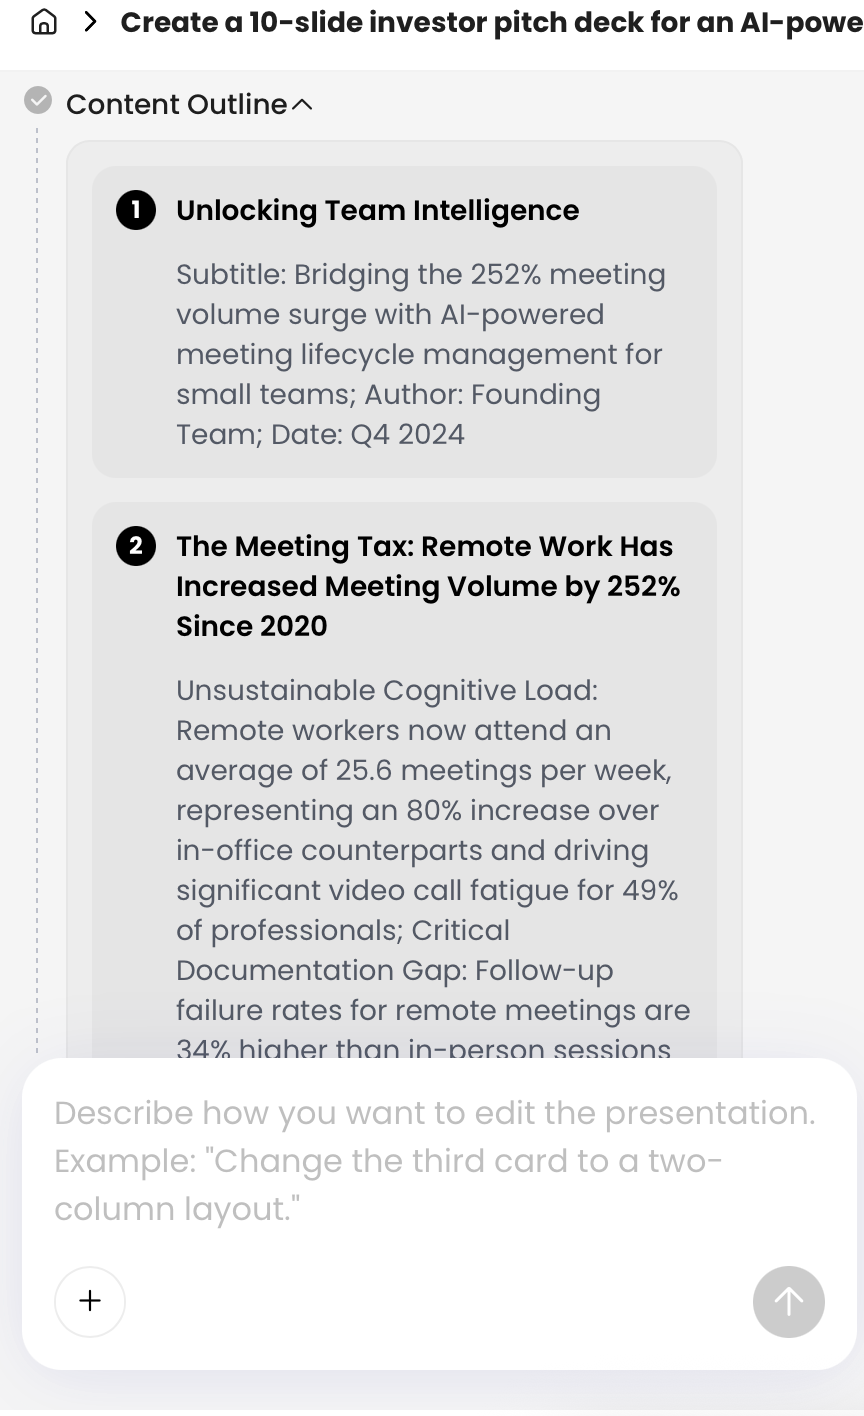
Instead of asking AI to “make slides from these posts,” ask it to identify themes, rank evidence strength, decide what the audience should believe by the end, and sequence the argument. This prevents the common failure mode where each slide becomes one post with a decorative headline.
In an AI presentation workflow that shows a content plan before slide generation, treat the outline as the first approval gate. Look for four problems: missing audience context, unsupported claims, too many example slides, and a conclusion that repeats the intro instead of asking for a decision.
Use a prompt chain, not one giant prompt
Step 1 — Extract: “From the source table, list each post with platform, date, source URL, main idea, metric range, key metric, quote, and permission status. Do not infer missing numbers.”
Step 2 — Cluster: “Group the posts into 3–5 themes. For each theme, show supporting posts, audience signal, evidence strength, and weak or conflicting evidence.”
Step 3 — Outline: “Create a [number]-slide presentation for [audience]. Goal: [business outcome]. Use the structure: context, audience signal, key findings, examples, recommendation, next steps. Include one takeaway per slide, suggested visual, and source IDs.”
Step 4 — Audit: “Review the outline for unsupported claims, invented metrics, missing date ranges, uncited quotes, and slides that combine more than one takeaway. Flag where human review is required.”
Prompt template for a stronger outline
“Turn the following cleaned social media source brief into a [number]-slide presentation for [audience]. The goal is to [business outcome]. Group posts into 3–5 themes, identify the strongest evidence, separate reach metrics from intent signals, and convert metrics into recommendations. Do not invent metrics. Preserve source IDs and URLs. Mark unsupported claims as ‘needs evidence.’ Separate direct quotes from paraphrases and flag permission requirements. Include suggested slide titles, one takeaway per slide, speaker-note cues, and the data or visual needed for each slide.”
Weak outline vs. useful outline
A weak AI outline says: “Slide 1: Campaign overview. Slide 2: LinkedIn results. Slide 3: YouTube results. Slide 4: Comments. Slide 5: Recommendations.” It reports channels, but it does not explain what the team learned.
A stronger outline says: “Slide 1: The campaign tested whether implementation content outperforms awareness content. Slide 2: Reach was broad, but intent concentrated around onboarding consistency. Slide 3: LinkedIn comments revealed manager enablement anxiety. Slide 4: YouTube tutorials held attention but did not trigger direct inquiries. Slide 5: Recommendation: build a manager-ready checklist series and route implementation objections into sales collateral.”
Outline rule of thumb: Every slide should answer one meeting question. If a slide needs three explanations, split it, simplify it, or move supporting detail to the appendix.
Adapt Each Social Platform into the Right Slide Structure
Different platforms produce different kinds of evidence, so the slide structure should change with the source.
Text-heavy platforms: LinkedIn and X
- LinkedIn long post → claim/evidence/implication slide: headline states the insight, a short quote or metric supports it, and the final line explains what sales, product, or marketing should do next.
- LinkedIn comment thread → objection-handling slide: group comments into “confused,” “skeptical,” “ready to buy,” and “needs proof.” Use this for sales enablement or messaging refinement.
- X thread → framework slide: convert a sequence of posts into a 4–6 step model, timeline, myth-vs-fact slide, or “problem → mistake → fix” section.
Visual platforms: Instagram carousels and image posts
- Carousel → lesson module: keep the educational sequence but rewrite slide copy for spoken delivery. Carousel captions often read too compressed for a meeting deck.
- Before/after visual → proof slide: show the transformation, then add context: audience, time period, metric, and what changed.
- Screenshot → evidence slide: crop consistently, avoid tiny UI text, and add a source note or appendix reference instead of relying on the screenshot alone.
Video platforms: TikTok, Reels, Shorts, and YouTube
- Short-form script → hook/problem/demo/proof sequence: use the opening hook as a title slide, the problem as context, the demo beats as body slides, and the proof or CTA as the recommendation.
- YouTube transcript → training structure: extract chapters, definitions, examples, warnings, and recap moments. Do not summarize a 30-minute transcript evenly; prioritize the parts with instructional value or retention spikes.
- Watch-time data → content insight: a retention drop may signal pacing problems, not topic rejection. Pair retention data with comments or clicks before making conclusions.
Comments and community data
Comment sections are valuable because they show audience language, but they are not a survey. Cluster comments into themes such as confusion, objection, comparison, desire, praise, and implementation concern. Then choose a slide pattern: objection matrix, voice-of-customer quote slide, FAQ slide, or “what this means for messaging” slide.
Cross-platform metric normalization
Do not compare LinkedIn impressions, Instagram reach, TikTok views, and YouTube watch time as if they measure the same behavior. Normalize around the decision you need to make. For awareness, compare reach or impressions. For education, compare saves, average watch duration, completion rate, or carousel completion if available. For demand, compare clicks, qualified comments, demo requests, signups, or attributed sales conversations.
Saves, shares, qualified comments, clicks, and demo requests can indicate deeper value, but each needs context. Saves may mean educational utility, not purchase intent. Shares may reflect controversy or entertainment. Comments may be bot-driven or low-quality. Clicks may bounce. Demo requests are stronger, but only if attribution and timing are credible.
Convert Social Media Data into Slides, Charts, and Decisions
Performance data should become a decision slide, not a screenshot of a spreadsheet.
Start with the decision question
- Which message worked? Compare themes by qualified engagement, not only reach.
- Which channel drove action? Separate organic from paid and show clicks, leads, or sales conversations where available.
- Which creative format should we test next? Compare carousels, short videos, long tutorials, and text posts using metrics appropriate to each format.
- Which audience concern matters most? Use comment clustering and sales notes, not engagement totals alone.
Metric definitions that prevent bad charts
- Engagement rate: commonly calculated as engagements divided by impressions or reach. State which denominator you used.
- CTR: clicks divided by impressions, views, or reach depending on platform export. Label the denominator.
- Reach vs. impressions: reach estimates people/accounts exposed; impressions count total displays and may include repeat exposure.
- Views: platform definitions vary, especially for short-form video. Do not equate a view with a completed watch.
- Conversions: define the attribution window and whether conversions are platform-reported, CRM-verified, or manually tagged.
Useful slide patterns for social analytics
- Leaderboard slide: use when ranking top posts by a business-relevant metric. Avoid when paid and organic posts are mixed without labels. Best chart: sorted bar chart or table.
- Message pillar matrix: use when comparing themes across reach, engagement, comments, clicks, and qualitative insight. Avoid if sample sizes are tiny. Best chart: matrix or heat map.
- Funnel slide: use when you can connect impressions to profile visits, clicks, signups, demo requests, or sales conversations. Avoid if attribution is unclear. Best chart: funnel or step chart.
- Before-and-after slide: use for a positioning change, creative refresh, or campaign launch. Avoid if seasonality or paid spend changed at the same time. Best chart: side-by-side bars or line chart.
- Comment insight slide: use when qualitative themes explain what metrics alone cannot. Avoid presenting one comment as a trend. Best chart: theme count table plus selected paraphrases.
Synthetic example: A SaaS team reviewed one month of content. LinkedIn implementation posts reached 9,400–18,200 impressions each and produced 23 qualified comments from operations leaders. A YouTube tutorial averaged 6 minutes 40 seconds of watch time on a 14-minute video but generated only 18 product clicks. A short-form demo reached 52,000 views but produced mostly generic comments. The deck recommendation was: “Use short video for awareness, but build the next sales-enablement asset around implementation anxiety because that theme produced the strongest qualified comments and sales follow-up.”
Sample metrics-to-slide conversion
Source data: LinkedIn onboarding post: 9,400 impressions, 42 comments, 11 saves, 18 sales conversations. YouTube tutorial: 3,100 views, 6:40 average watch time, 18 product clicks. TikTok demo: 52,000 views, 1,900 likes, 14 qualified comments, no CRM-attributed leads.
Slide 1: “Intent concentrated around implementation questions, not broad awareness.” Visual: message pillar matrix.
Slide 2: “Video educated viewers, but LinkedIn comments revealed sales-ready objections.” Visual: channel comparison table with metric caveats.
Slide 3: “Next test: manager-ready onboarding checklist plus objection-handling carousel.” Visual: 30-day test plan.
Chart check: Ask AI for chart recommendations separately from slide text, then validate the match. Use bar charts for ranking, line charts for trends over time, tables for mixed metrics, heat maps for theme comparisons, funnel charts for conversion paths, and matrices for qualitative categories. Watch for common AI mistakes: dual-axis charts without explanation, truncated axes that exaggerate change, unlabeled date ranges, and charts that compare paid and organic results as if they were equivalent.
Avoid Common Pitfalls, Copyright Issues, and Compliance Risks
Social content makes decks vivid, but it also increases the risk of overclaiming, privacy mistakes, and unauthorized reuse.
Avoid overclaiming social data
A popular post is evidence of engagement, not proof of market dominance. A positive comment is useful voice-of-customer material, not a statistically representative survey. A watch-time spike may reflect a strong hook, a confusing section, or a replayed tutorial step. Label evidence honestly: “suggests,” “indicates,” and “in this campaign sample” are often more accurate than “proves.”
Handle quotes, screenshots, and user-generated content
Before using social content in a deck, ask: Is the deck internal or external? Is the content owned, licensed, user-generated, or third-party? Is the person identifiable? Does the quote sound like a testimonial? Does the screenshot imply endorsement? Is there a contract, platform term, or customer agreement governing reuse?
- Do not imply endorsement from a user comment unless you have explicit approval.
- Do not use creator or influencer content in sales collateral unless the contract permits that usage.
- Do not assume public posts are automatically safe for commercial reuse.
- Do paraphrase themes when permission for direct quotes is unclear.
- Do anonymize comments, DMs, and customer references unless approved by legal or the customer.
Protect private and regulated data
Internal presentations may have more flexibility than public decks, but internal use is not a universal exemption. Customer contracts, privacy laws such as GDPR or CCPA, employee policies, healthcare or finance rules, education privacy requirements, and influencer usage rights can still apply. Be especially careful when uploading customer comments, DMs, sales notes, unpublished campaign data, or screenshots from private communities into any AI tool.
- Do separate platform-reported metrics from manually calculated metrics.
- Do document date ranges, campaign filters, paid boosts, and data exclusions.
- Do keep a source appendix for metrics, screenshots, quotes, and approvals.
- Do review AI-generated claims for accuracy, especially when summarizing comments or transcripts.
- Do involve legal, brand, compliance, or partner teams before using creator assets, customer names, logos, testimonials, or regulated claims.
Practical close: A social-media-to-presentation workflow is successful only if the audience leaves knowing what to approve, stop, test, fund, or change.
Use the same final sequence every time: collect the source material, clean it into a traceable table, cluster themes, build an outline, generate the draft, audit claims, improve titles and charts, confirm permissions, and export only after a final QA pass. The deck should not end with “thank you” alone; it should ask for the next campaign test, messaging decision, creator partnership, sales collateral update, training rollout, or executive approval.
FAQ: Turning Social Media Content into Presentations with AI
Can AI turn social media content into a presentation automatically?
Yes. AI can summarize posts, threads, captions, scripts, comments, and performance notes into an outline, then generate editable slides. You still need to review accuracy, permissions, and the final story.
What social media content should I export before making slides?
Export the posts you want to reuse, engagement metrics, comments or testimonials you have permission to quote, video transcripts, campaign notes, and screenshots only when they are allowed by your brand and platform policies.
How do I keep social media slides from feeling like a random post dump?
Group posts by business question, audience insight, campaign phase, or message pillar. Then ask AI to create a narrative arc with a problem, evidence, analysis, recommendation, and next step.
Can I export an AI-generated social media presentation to PowerPoint?
Many AI presentation tools support PPTX or PDF export. In a review workflow, exported PPTX files should be opened in Microsoft PowerPoint or the team's preferred editor before publishing. No tool should be assumed to preserve every object perfectly.
Create your presentation with one click now
Transform posts, scripts, reports, and campaign notes into a structured presentation draft you can refine, export, and share.
Start creating with PopAi