Best Operations Review Presentation Templates for AI Tools
Why Operations Review Presentation Templates Matter
If you are an operations leader, PMO manager, customer support manager, manufacturing supervisor, or business analyst, the problem is rarely “not enough data.” It is usually scattered evidence: a BI export in one tab, an incident log in another, last month’s action tracker in PowerPoint, and a Slack thread explaining why a KPI moved. The best operations review presentation templates give AI tools a working structure for KPIs, root causes, risks, and next steps before anyone starts formatting slides.
An operations review is different from a dashboard export. A dashboard tells people what changed; a review deck should help the room decide what to do next. Common decisions include approving overtime, escalating a supplier, shifting support queues, funding automation, changing a maintenance window, or accepting a service-risk tradeoff.
The winning operations review deck is not the one with the most charts. It is the one where every chart leads to a decision, an owner, or a deadline.
A weak AI-generated slide title might say, “Support Ticket Trends.” A decision-ready title says, “Backlog rose 22% because Tier 2 escalations outpaced staffing; approve two-week queue rebalancing.” That difference comes from the template, not the color theme.
Modern AI tools can generate slides from prompts, documents, web pages, and existing decks, but support varies by platform and the template still matters. Without a review frame, AI often produces generic “performance update” slides. With a review frame, it can sort metrics into scorecards, convert dense notes into action-oriented titles, and flag missing inputs instead of hiding them in polished language.
Best Operations Review Presentation Templates to Use with AI
Choose the template by cadence, audience, and the operational question the meeting must answer.
For this guide, “template” means more than a visual theme. A useful operations review template includes a slide sequence, required data fields, recommended visuals, decision prompts, and validation rules. The templates below are evaluated on five criteria: decision clarity, KPI fit, AI input readiness, ease of reuse, and risk of misleading interpretation.
| Template type | Best for | Cadence | Recommended length | Best AI inputs | Avoid when |
|---|---|---|---|---|---|
| Monthly Operations Review | Department MBRs and recurring operating rhythms | Monthly | 8–12 slides | KPI export, action tracker, last month’s deck | The audience only needs a live dashboard walkthrough |
| Quarterly Operations Review | Executive and cross-functional performance reviews | Quarterly | 12–18 slides | Quarterly scorecard, budget notes, risk register | You do not have validated financial or capacity data |
| KPI Dashboard Review | Metric-heavy reviews with many owners | Weekly or monthly | 6–10 slides | BI dashboard export, metric dictionary, owner list | The meeting requires deep root-cause investigation |
| Process Improvement Review | Lean, Six Sigma, QA, PMO, and transformation teams | Project milestone or monthly | 10–15 slides | Process map, defect data, before/after metrics | The problem statement is not yet agreed |
| Risk and Incident Review | IT Ops, DevOps, logistics, compliance, service operations | After incident or monthly risk review | 7–12 slides | Incident report, timeline, impact log, mitigation plan | Facts are still unconfirmed or legally sensitive |
1. Best Overall: Monthly Operations Review Template
Use this when leadership wants a repeatable MBR that connects performance, variance, root cause, and next-month commitments. Required slides: executive summary, KPI scorecard, demand trend, capacity/productivity, SLA or quality, cost efficiency, top bottlenecks, root cause, risks, and action plan.
- Best audience: COO, VP Ops, department heads, regional managers.
- Best visuals: KPI scorecard, trend line, variance bar, owner/action table.
- Example slide title: “Order backlog improved 9%, but East region misses SLA due to staffing imbalance.”
- Common mistake: showing all green KPIs first and burying the one unresolved blocker on slide 14.
2. Best for Executives: Quarterly Operations Review Template
Use this when the discussion needs to move beyond “how did we perform?” into “what should we fund, stop, escalate, or change?” Add quarter-over-quarter comparisons, financial impact, capacity planning, customer-impact analysis, strategic risks, and decisions required.
- Best audience: executive team, finance partners, business unit leaders.
- Best visuals: trend plus forecast, cost bridge, capacity heatmap, risk matrix.
- Example KPI set: unit cost, throughput, service level, backlog, defect rate, forecasted demand, automation savings.
- When not to use: if the team only needs tactical queue management or shift-level issue resolution.
3. Best for Metric Reviews: KPI Dashboard Review Template
Use this for reviews where each KPI has an owner and the main job is to separate normal variation from exceptions. The template should include metric cards, variance vs. target, trend lines, red-amber-green status, commentary fields, and source notes.
- Best audience: functional managers, analysts, PMO, customer operations leads.
- Must-have field: metric definition, because “resolution time” or “on-time delivery” can mean different things across systems.
- Best AI instruction: “Do not summarize green metrics unless there is hidden risk or a decision required.”
- Common mistake: turning the deck into a screenshot gallery from BI with no owner or next step.
4. Best for Improvement Work: Process Improvement Review Template
Use this for Lean, Six Sigma, DMAIC, QA, and PMO teams that need to prove whether an operational change worked. Include current-state process, defect or delay analysis, root causes, countermeasures, pilot results, expected gains, and control plan.
- Best audience: process owners, plant managers, transformation teams, quality leaders.
- Best visuals: Pareto chart, before/after process map, control chart, impact table.
- Example slide title: “Three defect categories explain 71% of rework; inspection change reduces repeat failures in pilot cell.”
- When not to use: when the team has not isolated a process, defect, delay, or measurable baseline.
5. Best for Disruption: Risk and Incident Review Template
Use this when the meeting must establish what happened, who was affected, what remains exposed, and how recurrence will be prevented. Prioritize incident timeline, severity, customer or operational impact, mitigation, owner, deadline, and prevention controls.
- Best audience: service operations, IT Ops, DevOps, logistics, compliance, vendor management.
- Best visuals: timeline, severity matrix, impact table, open-risk register.
- Required distinction: confirmed facts versus assumptions.
- Common mistake: presenting a polished postmortem before legal, security, or customer-impact facts are verified.
A Slide-by-Slide Operations Review Presentation Framework
A reliable operations review deck follows a simple arc: context, scorecard, diagnosis, risk, decision.
- Title and meeting context: business unit, review period, presenter, meeting objective, and decision scope. Example title: “North America Support Operations Review — May 2026.”
- Executive summary: three to five bullets covering performance, exceptions, risks, and decisions needed. Use plain language; do not repeat the KPI table.
- KPI scorecard: target, actual, variance, trend, status, owner, and source for each critical metric. Keep the main slide to 6–10 KPIs; move secondary metrics to appendix.
- Volume and demand trends: order volume, ticket volume, production output, backlog, or demand forecast. Use line charts for trends and stacked bars when mix matters.
- Capacity and productivity: utilization, staffing, throughput, cycle time, downtime, and workload balance. Show whether the constraint is people, equipment, process, or demand mix.
- Quality and SLA performance: defect rate, rework, first-contact resolution, on-time delivery, SLA attainment, or error rate. Pair the metric with customer or operational impact.
- Cost and efficiency: unit cost, overtime, waste, cost per ticket, cost per shipment, or automation savings. Use a cost bridge if executives need to see drivers.
- Root-cause analysis: top drivers, Pareto chart, 5 Whys, fishbone summary, or process bottleneck map. Use Pareto for defect categories, 5 Whys for a specific incident, and a driver tree for multi-factor KPI movement.
- Risk register: severity, probability, impact, mitigation, owner, and due date. Do not list risks without a mitigation status.
- Action plan: decision required, next step, accountable owner, deadline, expected impact, and follow-up date.
Lagging indicators need diagnostic layers. “Cycle time increased 18%” is not enough unless the deck shows whether the driver was demand mix, staffing, machine downtime, supplier delay, system latency, or rework.
| Deck version | Use when | How to structure it |
|---|---|---|
| 10 slides | Monthly executive review | Merge demand with capacity, merge quality with SLA, keep one action-plan slide. |
| 15 slides | Department review with operators present | Separate each KPI family, add root-cause detail, include appendix for owner-level metrics. |
| 30 slides | Quarterly operations pack or board pre-read | Add deep dives by site, region, channel, product line, process owner, and risk category. |
Operations Review Template Preview: Static Template vs AI-Ready Template
This preview makes the template resource more concrete and shows why an AI-ready version is different from a generic operations deck.
| Slide | Static template usually shows | AI-ready PopAi version should ask for | Reviewer decision |
|---|---|---|---|
| Executive operations summary | Generic status bullets. | Three verified changes since the last review, one operational risk, one decision request. | Is the message summary or noise? |
| KPI dashboard | A pasted chart or table. | KPI name, definition, time period, target, actual, variance, owner, source link. | Are definitions stable and comparable? |
| Root-cause view | Bullet list of possible reasons. | Issue statement, evidence, affected workflow, possible drivers, known unknowns. | Does evidence support the cause? |
| Action tracker | Tasks without accountability. | Action, owner, due date, dependency, expected operational impact, escalation need. | Can the team actually commit? |
| Next operating cycle | Loose priorities. | Planned experiments, process changes, capacity assumptions, and review checkpoints. | What must be rechecked next week? |
Example template use case
A logistics team can paste weekly order volume, late shipments, support tickets, and warehouse staffing notes into PopAi. The first draft should separate what happened, why it may have happened, and what action needs approval. The final reviewer should replace generic AI language with the operations team’s confirmed root cause and next-step owner.
AI Tool Features That Make Operations Review Presentation Templates Better
Most AI slide tools can create a first draft. Fewer support the full operations workflow: ingest source material, organize the storyline, preserve template rules, edit charts, export usable files, and keep humans in control of the numbers.
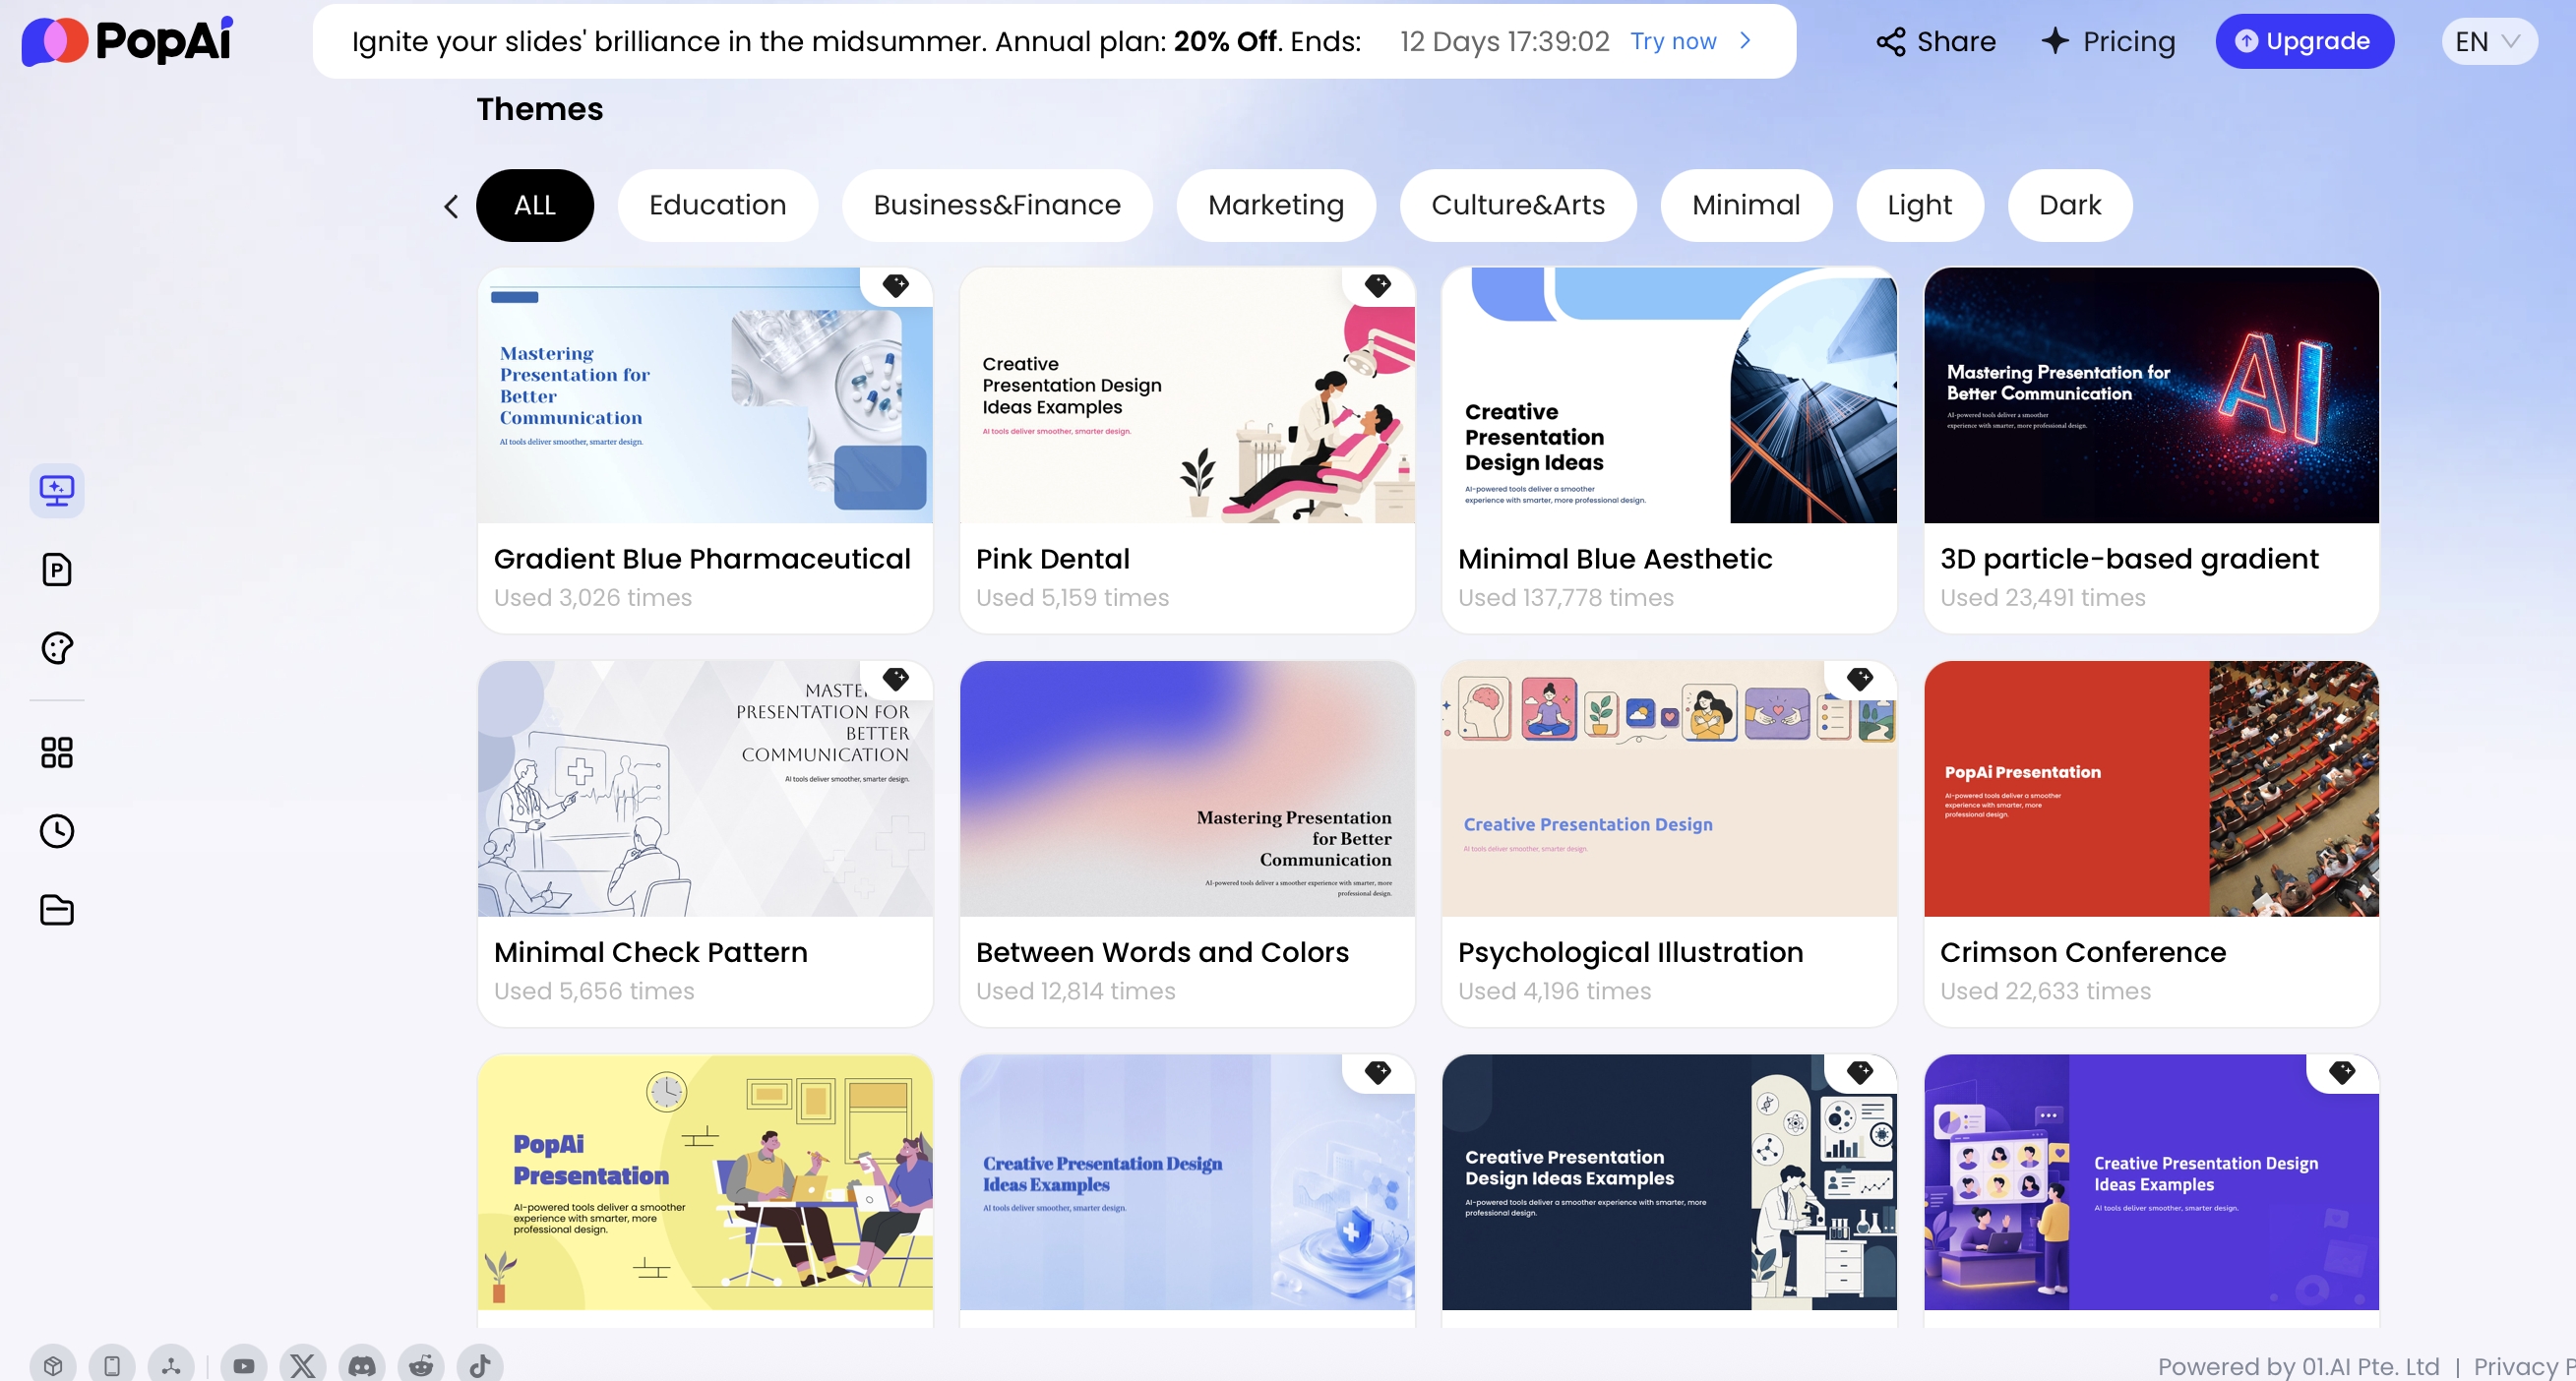
With PopAi AI Presentation, teams can start from a topic or prompt, upload existing materials, or use AI PowerPoint workflows with official templates, personal templates, and uploaded PPTX templates. That is useful for operations teams because review inputs rarely live in one place: the KPI export may be a spreadsheet, the root-cause notes may be in a document, and last month’s commitments may be trapped in an old deck.

When comparing tools, separate attractive slide generation from operational usefulness. Prompt-only tools may be fast but weak at source control. Template-upload tools are better for recurring MBRs and QBRs. Chart-editing tools matter when the deck must survive analyst review. Enterprise-ready tools should provide permission controls, export reliability, and a workflow that allows human validation before distribution.
| Capability | Why it matters for operations reviews | What to check before using it |
|---|---|---|
| Prompt-to-deck generation | Creates a first draft from meeting goals, audience, and required sections. | Can you specify page count, tone, language, mandatory chapters, and missing-data behavior? |
| Document-to-slides | Turns reports, policies, incident summaries, and process notes into deck sections. | Does it support your source formats such as PDF, Word, HTML, Markdown, images, or PPTX? |
| Template reuse | Keeps MBRs and QBRs consistent across teams, regions, and quarters. | Can you upload or reuse a PPTX template, not just change logo and colors? |
| Chart editing | Supports KPI trend lines, variance bars, dual-axis comparisons, and dashboard-style summaries. | Can you edit the data table, units, legends, colors, axes, reference lines, and labels? |
| Content planning before generation | Lets reviewers catch missing sections before a full deck is produced. | Can you inspect and revise the outline before committing to slide generation? |
| PPTX/PDF export | Lets teams continue editing in PowerPoint or distribute a locked review copy. | Do exported PPTX files open with editable text and acceptable layout fidelity? |
PopAi shows content planning before generation: AI Presentation displays a thought process, Creative Slides shows a draft or outline, and AI PowerPoint provides a content plan and theme selection. In practice, this planning step is where an operations owner should check whether the AI understood the review period, audience, KPI families, source files, and required action-plan sections before the full deck is generated.
If you are comparing broader AI presentation makers, evaluate them on more than generation speed. Operations reviews require accurate structure, stable export, chart flexibility, collaboration, template reuse, and permission discipline.
Operations Review Presentation Templates by Industry and Role
Industry fit is not just a KPI list. The slide sequence, root-cause method, chart type, and risk language should change by operating model.
SaaS Ops and Customer Support: Queue Health and Customer Impact
- Core question: Are service levels improving without hiding backlog, escalations, or churn risk?
- Template structure: SLA scorecard, volume/backlog trend, escalation drivers, customer-impact incidents, staffing or routing actions.
- KPIs: SLA attainment, first response time, resolution time, ticket volume, backlog, escalation rate, self-service deflection, support cost per account.
- Best visuals: backlog aging chart, SLA trend, escalation Pareto, action-owner table.
- AI risk: AI may treat “resolved tickets” as positive even when reopen rate or customer sentiment is worsening.
Manufacturing and Plant Operations: Throughput, Quality, and Constraint Control
- Core question: Which constraint is limiting output, and is the countermeasure working?
- Template structure: production scorecard, OEE trend, downtime Pareto, defect/rework analysis, countermeasure status, control plan.
- KPIs: OEE, throughput, downtime, changeover time, defect rate, scrap, rework, capacity utilization.
- Best visuals: Pareto chart, shift heatmap, before/after process map, control chart.
- AI risk: If shift, line, or SKU mix is missing, AI may overstate a single root cause.
Logistics and Supply Chain: Exceptions, Regions, and Cost-to-Serve
- Core question: Where are delivery promises breaking, and what is the cost of recovery?
- Template structure: on-time delivery scorecard, regional/site breakdown, exception drivers, freight-cost bridge, supplier or carrier risk register.
- KPIs: on-time delivery, order accuracy, warehouse cycle time, freight cost, stockouts, inventory turns, expedited shipment rate.
- Best visuals: regional heatmap, waterfall cost bridge, exception Pareto, risk matrix.
- AI risk: AI may mix shipment date, promised date, and delivery date unless definitions are supplied.
IT Ops and DevOps: Reliability, Incidents, and Change Risk
- Core question: Are reliability outcomes improving, and are open risks owned?
- Template structure: reliability scorecard, incident timeline, MTTR/MTTD trend, change failure analysis, prevention controls, open-risk register.
- KPIs: availability, incident count, mean time to detect, mean time to recover, deployment frequency, change failure rate.
- Best visuals: incident timeline, severity distribution, deployment/change overlay, risk-owner table.
- AI risk: AI-generated summaries can imply causation between deployments and outages without evidence from logs or postmortems.
Field note: In a customer support MBR, a team can have green average response time while VIP accounts experience repeated escalations. In a manufacturing review, overall throughput can look stable while one line creates most scrap. The template should force segmentation by customer tier, site, line, region, or product family where the operating model demands it.
Analysis: The industry-specific KPI layer is where many AI decks become either useful or misleading. If you ask AI to “make an operations review,” it may invent plausible metrics. If you provide a metric dictionary, source data, and audience context, the resulting deck is far more likely to reflect how your organization actually measures performance.
Prompt Templates for AI Operations Review Presentations
A good prompt is a creative brief plus an analyst checklist. It should specify audience, cadence, reporting period, source files, KPI definitions, slide count, visual preferences, validation rules, and what to do when data is missing.
Prompt Checklist Before You Generate
- Audience: executive team, operating managers, site leaders, PMO, board committee.
- Reporting period: exact dates, fiscal month or quarter, comparison period.
- Source bundle: KPI export, incident report, action tracker, previous deck, metric dictionary.
- Required outputs: slide count, chart types, appendix needs, decision slides.
- Validation rules: do not invent numbers, mark missing data, separate facts from assumptions, cite source file names.
- Confidentiality rules: anonymize customers, employees, security findings, vendor costs, or regulated data where needed.
10-Slide Monthly Operations Review Prompt
Create a 10-slide monthly operations review for a senior leadership audience for [business unit] covering [reporting period]. Use the attached KPI export, previous month’s action tracker, and metric dictionary. Include: executive summary, KPI scorecard, demand trend, capacity and productivity, SLA and quality, cost efficiency, top three bottlenecks, root-cause analysis, risk register, and action plan. For every KPI, show target, actual, variance, trend, owner, and data source. Do not invent numbers. Mark missing data as “needs validation.” Use action-oriented slide titles.
Manufacturing Process Improvement Prompt
Create a 12-slide process improvement review for a manufacturing plant. Focus on OEE, throughput, downtime, defect rate, scrap, rework, and capacity utilization. Use a Pareto-style root-cause slide for the top defect or downtime categories, a before/after process slide, expected impact, owners, due dates, and a control plan. Separate confirmed production data from supervisor hypotheses.
Incident and Risk Review Prompt
Turn this incident report into an operations review deck. Summarize timeline, affected customers or processes, severity, root cause, mitigation, open risks, prevention controls, accountable owners, and executive decisions required. Separate confirmed facts from assumptions. Do not assign blame. Flag any missing timestamps, impact estimates, or unresolved ownership.
Bad Prompt vs. Better Prompt
Weak: “Make a professional operations review deck from this report.” This usually produces generic slides, invented section names, and vague recommendations.
Better: “Create an 8-slide support operations MBR for the VP of Customer Experience. Use only the attached ticket export and action tracker. Include SLA, backlog aging, escalation drivers, staffing constraints, customer-impact risks, and owner-level actions. Mark missing targets as needs validation.”
Tested workflow note: In an internal HTML-to-slides dry run for this article, the source file contained a title, executive summary, six KPI rows, a three-item risk register, and recommended actions. The AI-generated draft organized it into a six-page operations deck with a KPI summary, risk table, and action slide. The useful output was the structure; the manual corrections were metric wording, chart labeling, and tightening slide titles so they pointed to decisions rather than summaries.
PopAi’s workflow is useful here because the system can first organize the content plan, then generate the deck, and then let users revise with natural-language editing, theme changes, layout adjustments, AI Writing, Cards, Logic Frames, Charts, and Icons. Treat that as a drafting workflow, not an approval workflow: the operations owner still needs to verify sources and sign off on the final numbers.
How to Validate AI-Generated Operations Review Presentation Templates
AI accelerates the first draft, but operations data needs governance. Your deck may influence staffing, budget, customer commitments, vendor escalation, or compliance action. Accuracy and traceability are not optional.

Eight-Step Validation Workflow
- Freeze the source dataset: record the export date, system, filters, and reporting period.
- Confirm metric definitions: align target, numerator, denominator, exclusions, and owner.
- Reconcile numbers: compare AI-generated totals, percentages, and deltas against the source table.
- Check charts: verify axes, units, date ranges, legends, reference lines, and whether zero baselines are appropriate.
- Review commentary: remove unsupported causal claims such as “staffing caused backlog” unless driver evidence is shown.
- Validate risks and actions: confirm severity, mitigation, owner, due date, and escalation path.
- Redact sensitive data: remove customer names, employee details, confidential costs, security findings, and regulated information when needed.
- Inspect export: open the final PPTX or PDF in the destination tool and check fonts, charts, editable text, and slide order.
| Validation risk | Example | Prevention |
|---|---|---|
| Invented metric | “Customer delay risk score” appears without a source | Provide a metric dictionary and require source labels |
| Wrong time period | AI mixes July data with Q3 commentary | Lock reporting dates in the prompt and slide footer |
| Causal overclaim | “Staffing caused backlog” appears without queue or capacity evidence | Require driver evidence or mark as hypothesis |
| Misleading chart | Truncated axis exaggerates a small SLA movement | Review chart scale, baseline, and reference targets |
| Unowned action | “Improve response time” appears with no owner or date | Require owner, due date, expected impact, and follow-up status |
A beautiful operations review deck that cannot prove its numbers is not a management tool. It is a risk artifact.
Competitive tests of AI presentation tools often compare speed, design quality, collaboration, export stability, brand consistency, and enterprise readiness. Operations teams should add three stricter criteria: metric definition control, source traceability, and action-item accountability.
PopAi supports export to PPTX and PDF, and exported PPTX files can be opened in Microsoft PowerPoint with editable text objects in typical workflows. Export results can vary by layout, fonts, charts, and PowerPoint version, so always run a final check. For chart-heavy operations reviews, chart editing tools can be used to switch among bar, horizontal bar, line, area, pie, donut, dual-axis, radar, scatter, and bubble charts; edit data tables; upload or download Excel files; and adjust colors, axes, legends, units, prefixes, suffixes, reference lines, and data-point labels.
Use the Template Before, During, and After the Review Meeting
The best operations review presentation templates are meeting systems, not just slide layouts.
Before the Meeting: Freeze Inputs and Pre-Align Owners
- Send a pre-read with the executive summary, KPI dashboard, risk register, and proposed decisions 24–48 hours before the review.
- Ask metric owners to confirm data, add variance commentary, and flag missing context before the live meeting.
- Highlight only exceptions that require discussion; stable green metrics can stay in the appendix unless they hide downstream risk.
- Prepare a decision list: approvals needed, escalations, tradeoffs, and blocked actions.
During the Meeting: Discuss Exceptions, Not Every Slide
- For a 30-minute review, use 5 minutes for summary, 15 minutes for red/amber issues, 5 minutes for risks, and 5 minutes for decisions and owners.
- For a 60-minute review, add 10–15 minutes for root-cause deep dives and 10 minutes for cross-functional blockers.
- Start with red and amber metrics when the audience already read the pre-read; start with context when executives are new to the issue.
- Use the root-cause slide to separate symptoms from drivers and stop the meeting from becoming a status readout.
- Record decisions directly on the action-plan slide with owner, deadline, expected impact, and escalation path.
After the Meeting: Turn Decisions Into Next Month’s Inputs
- Export the deck as PDF for recordkeeping and PPTX for teams that need to edit follow-up slides.
- Share the final file with stakeholders and mark actions as closed, delayed, escalated, or carried forward.
- Maintain a recurring action tracker with decision, owner, due date, status, blocker, and next review date.
- Use the previous month’s final deck, KPI export, and action tracker as source material for the next AI-generated draft.
A practical monthly loop looks like this: freeze KPI exports on day one, generate the first draft on day two, validate with owners on day three, run the review on day five, and carry unresolved actions into the next month’s deck. That is where AI becomes more than a slide generator: it reduces deck assembly time while the team preserves accountability for the decisions.
FAQ
What slides should an operations review presentation template include?
Include an executive summary, KPI dashboard, demand and capacity trends, quality or SLA performance, cost analysis, risks, root causes, and an action plan with owners and deadlines.
Can AI generate KPI charts for an operations review?
Yes. Provide clean source data, metric definitions, time periods, and the chart type you want. Always verify calculations, labels, and conclusions before presenting.
Which operations KPIs work best in an AI presentation?
Useful KPIs include SLA attainment, backlog, throughput, cycle time, downtime, defect rate, OEE, capacity utilization, response time, ticket volume, on-time delivery, and unit cost.
How do I prevent AI hallucinations in an operations review deck?
Give the AI source-labeled data, ask it not to invent numbers, require missing data to be flagged, review every chart against the source, and keep human approval for final claims.
Create your presentation with one click now
Turn your KPI notes, reports, and operating updates into a structured presentation draft you can edit, export, and share.
Start creating with PopAi