Best Annual Report Templates for AI Presentations
Published on August 25, 2026

If you are preparing an annual report deck for executives, investors, shareholders, employees, or donors, the hardest part is not opening PowerPoint. It is turning audited numbers, operating results, risk language, and next-year priorities into a deck that a real decision-maker can trust. The best annual report presentation templates for AI tools do more than look polished: they define the audience, required inputs, slide intent, chart logic, review checkpoints, and where management judgment must override the draft.
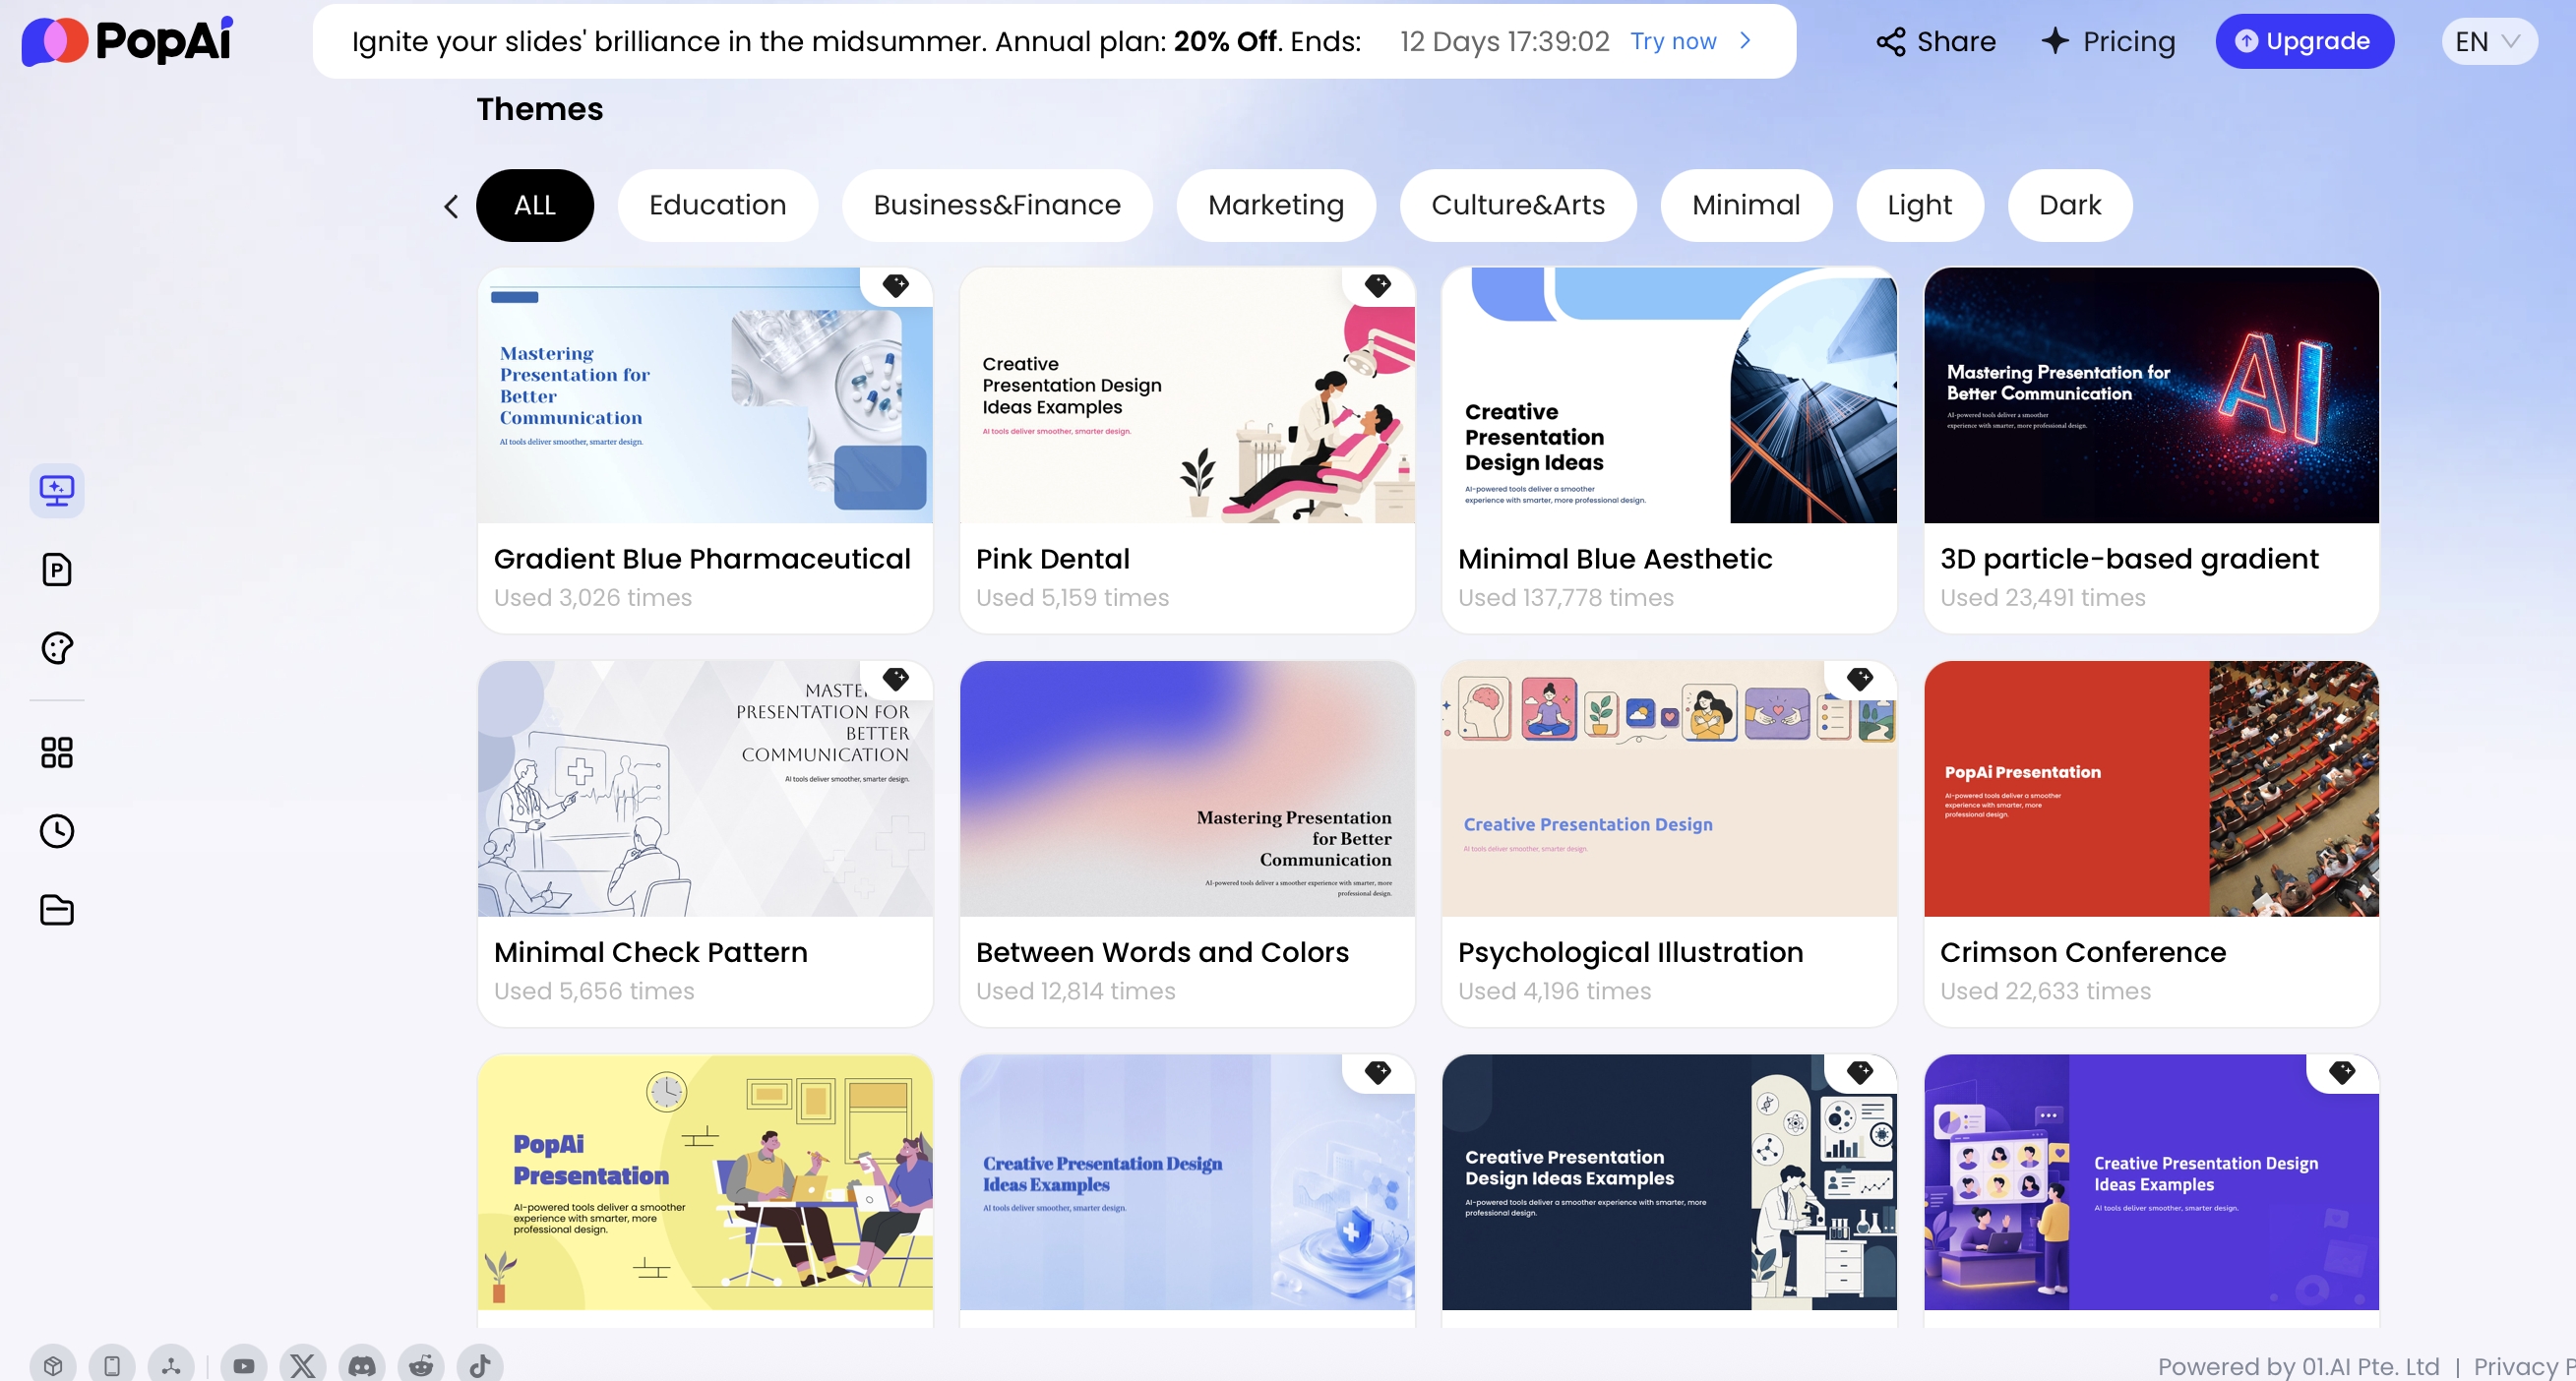
This guide treats “template” in the practical AI-ready sense: a repeatable deck structure you can use in PopAi, PowerPoint Copilot, Canva, Gamma, Beautiful.ai, Pitch, Plus AI, or another presentation workflow. In PopAi AI Presentation, for example, you can start from a prompt or upload existing materials, review the AI-generated content plan, choose or upload a theme, edit charts, and export to PPTX or PDF for final finance and legal review.
Quick takeaway: Choose the template by audience before choosing the design style. A board deck should foreground decisions, variance, capital allocation, and risk. An investor deck should emphasize growth drivers, margins, market progress, and outlook. An employee deck should simplify financials and explain priorities. A donor deck should prove impact, funding transparency, and stewardship.
What Makes a Good Annual Report Template for AI Presentations?
A strong AI-ready annual report template gives every slide a job, every metric a source, and every claim a review path. Static template packs often provide attractive covers, icons, maps, tables, and timelines; useful, but not enough. For AI-assisted reporting, the template must tell the model what to summarize, what not to invent, which numbers need source notes, and how to separate actual results from commentary or forecasts.
Prioritize slide intent over decoration
Each slide should answer a specific reporting question: what happened, why it happened, what it means, and what leaders should do next. A vague placeholder such as “Financial overview” gives AI too much room to produce generic commentary. A better instruction is: “Show revenue, gross margin, EBITDA, and YoY change; explain the two largest drivers of variance; mark unaudited figures as provisional.”
- Executive summary: one slide with the three to five messages leaders must remember, written as conclusions rather than topics.
- Financial performance: revenue, operating profit, cash position, margin, budget variance, and source notes for any adjusted or non-GAAP metrics.
- Operational performance: customer, product, people, sales, service, enrollment, beneficiary, or program metrics depending on the organization.
- Strategic initiatives: what changed during the year, whether initiatives are on track, and which decisions remain open.
- Governance and risk: material risks, severity, owner, mitigation, controls, ESG progress, and review status.
- Forward view: priorities, assumptions, opportunities, known uncertainties, and appropriate cautionary language.
Use stronger slide instructions for AI
The simplest way to improve output quality is to replace generic template labels with evidence-based prompts.
| Weak template label | AI-ready slide instruction |
|---|---|
| Financial overview | Summarize revenue, gross margin, operating income, cash, and YoY change. Explain the two largest positive and negative drivers. Add source notes. |
| Risk slide | List the top five risks by severity and likelihood. Include owner, mitigation action, status, and any decision required from the board. |
| Impact | Show beneficiary outcomes, program reach, cost per outcome, restricted vs unrestricted funding, and one substantiated story. |
| Outlook | Separate committed priorities from assumptions. Mark forecasts clearly and include caveats for market, funding, hiring, or regulatory uncertainty. |
Match template logic to organization type
Annual report decks are not interchangeable. A SaaS board review needs different evidence from a nonprofit donor report or a public-company shareholder update.
- SaaS or subscription business: ARR bridge, churn cohort, net revenue retention, CAC payback, pipeline quality, product adoption, expansion vs new logo revenue.
- Nonprofit: restricted vs unrestricted funds, program expense ratio, grant compliance, beneficiary outcomes, donor retention, impact claim substantiation.
- Public company: segment reporting, non-GAAP reconciliation, risk factors, forward-looking statement review, investor relations tone, consistent terminology.
- Private company or startup: cash runway, budget variance, hiring plan, customer concentration, investor confidentiality, milestone progress.
- Education or institution: enrollment, retention, funding sources, program outcomes, facilities, community impact, board decisions.
The best annual report template does not simply make annual data look better. It forces the story to become clearer, shorter, sourced, and harder to misread.
Practitioner note: In marketplace template packs, it is common to see 25–35-slide “annual report” bundles with many decorative layouts. Those are useful as design libraries, but leadership meetings usually benefit from a tighter 12–18-slide narrative plus appendix. The difference is not attention span alone; it is review control. Fewer core slides make it easier for finance, legal, and executives to verify every number and wording change before circulation.
Best Annual Report Templates for AI Presentations by Use Case
For a broader view of available tools, compare the latest AI presentation makers before choosing the workflow that best fits your team.
Before selecting a workflow, compare the latest AI presentation makers against your required inputs, export format, chart editing needs, brand controls, and data-security rules.
The “best” annual report template is the one that matches the decision context. I evaluate annual report templates on seven criteria: audience fit, AI prompt clarity, financial-storytelling structure, chart support, editability after export, source-note readiness, and compliance risk. The table below names practical AI-ready template blueprints you can recreate in most presentation tools or use as selection criteria when browsing template libraries.
| Template recommendation | Best audience | Typical length | Required inputs | Use it when | Avoid it when |
|---|---|---|---|---|---|
| Board Decision Annual Review | Board, CEO, CFO, executive committee | 12–15 slides | Financial statements, KPI dashboard, risk register, strategy update, decision log | You need decisions on budget, risk, capital allocation, or strategic priorities | The audience only needs a public-facing highlights deck |
| Investor Performance and Outlook Deck | Shareholders, private investors, analysts, founders | 10–14 slides | Revenue bridge, margin analysis, market update, customer metrics, forecast assumptions | You need to explain performance drivers and confidence in the next period | Numbers are still unaudited or investor-only metrics cannot be disclosed broadly |
| Nonprofit Impact and Stewardship Report | Donors, trustees, grant committees, community partners | 12–16 slides | Program outcomes, funding breakdown, beneficiary stories, grant obligations, audited accounts | You must connect funding to measurable outcomes and mission progress | You cannot substantiate impact claims or protect beneficiary privacy |
| SaaS Metrics Annual Review | SaaS leadership, board, sales, customer success | 15–18 slides | ARR, NRR, churn, cohort retention, pipeline, product adoption, support metrics | You need trend charts and operating metrics, not just financial statements | Metric definitions have changed and are not reconciled |
| Employee Year-in-Review Town Hall | Employees, managers, internal communications | 8–12 slides | Company highlights, people milestones, customer stories, high-level KPIs, priorities | You need a clear internal narrative without over-sharing confidential details | The year involved sensitive restructuring, unreleased forecasts, or investor-only data |
| Institutional Stakeholder Report | Schools, universities, associations, public agencies | 12–18 slides | Enrollment or participation data, finances, program outcomes, facilities, community metrics | You serve multiple stakeholders and need a balanced public briefing | The audience expects a formal statutory report rather than a presentation summary |
| Minimal Financial Highlights Template | Senior executives, lenders, compact investor updates | 6–8 slides | Approved financial summary, KPI dashboard, variance notes, outlook caveats | You need a short readout before a longer appendix or written report | The audience needs full segment, regional, or compliance detail |
Recommended template winners by situation
- Best overall: Board Decision Annual Review, because it combines performance, risk, strategy, and decisions in one disciplined flow.
- Best for fundraising: Investor Performance and Outlook Deck, because it links results to future assumptions and capital needs.
- Best for mission-led organizations: Nonprofit Impact and Stewardship Report, because it balances outcomes, funding transparency, and credible stories.
- Best for data-heavy operating reviews: SaaS Metrics Annual Review, because it handles ARR, churn, NRR, cohorts, and pipeline without forcing everything into financial-statement language.
- Best for all-hands communication: Employee Year-in-Review Town Hall, because it converts formal reporting into plain-language progress, priorities, and recognition.
Tool choice matters after template choice. Gamma and Tome are fast for narrative web-style decks; Canva is strong for brand-friendly visuals; Beautiful.ai is useful for locked design systems; PowerPoint Copilot fits Microsoft-centered teams; Plus AI works well for Google Slides workflows; PopAi is particularly useful when your source materials are spread across PDFs, DOCX files, PPTX decks, HTML reports, images, audio/video, or YouTube references. For annual reports, the practical question is not “Which tool is most impressive?” but “Which tool preserves sources, charts, branding, and editability through the final approval process?”
How to Build Annual Report Templates for AI Presentations in PopAi
Use AI as a drafting and structuring layer, not as the system of record. A reliable annual-report workflow is: lock approved inputs, define the audience, choose the template blueprint, generate a first draft, assign slide owners, reconcile numbers, revise language, and export only after finance/legal/executive review.
A practical five-step workflow with controls
- Create an approved source folder. Separate audited financial statements, board-approved commentary, KPI dashboards, risk registers, ESG notes, and draft department updates. Label files clearly: FY2025_Audited_Financials_Final.pdf is safer than finance_latest.pdf.
- Define the audience and meeting goal. Tell the AI whether the deck is for a board vote, investor update, annual town hall, donor review, or management workshop. Include what the audience must decide, not just what they need to know.
- Generate and review the outline before slides. In PopAi, review the thought process, draft, outline, or content plan before generating the presentation. Remove sections that rely on unapproved data or unsupported claims.
- Apply the visual system. Use official templates, personal templates, or upload a PPTX template if you need corporate branding, board footer rules, slide numbers, legal notes, or accessibility standards.
- Assign ownership and revise by slide. Finance owns numbers, legal owns disclosure wording, department leads own operational claims, and executives own the final narrative. Use natural-language editing only after the source hierarchy is clear.
Prompt starter: “Create a 15-slide annual report presentation for a board audience for [organization name], covering FY[year]. Use only the uploaded approved sources. Use conclusion-led titles. Cover executive summary, financial performance, operating KPIs, strategic initiatives, ESG/governance, risk register, decisions required, and next-year priorities. Add source notes for each metric. Use TBD where data is missing. Do not invent numbers.”
Case study: In a PopAi HTML-to-slides test, the input was a structured 1,200-word annual review draft containing a title, executive summary, KPI list, three initiative updates, a five-row risk register, and recommended actions. The output was a six-slide deck: cover, executive summary, KPI dashboard, initiatives, risk register, and actions. The useful part was structure extraction: the risk table stayed organized with risk, severity, owner, and mitigation. The manual edits were also predictable: two KPI labels needed clarification, one “recommendation” slide was too vague, and all financial values still required source reconciliation.
For leadership audiences, ask AI to “keep the three decisions and remove secondary detail.” Compression is often more valuable than decoration.
Annual Report Templates for AI Presentations: 10, 15, and 25-Slide Outlines
Many annual report template collections show attractive pages but not enough sequencing. Use these outlines as copy-ready structures when prompting an AI tool or judging whether a downloaded template is actually usable.
10-slide executive version for fast review
- Cover: organization, reporting period, audience, confidentiality label
- Executive summary: three key messages and one recommended action
- Year in numbers: KPI dashboard with source notes
- Financial performance: revenue, cost, profit, cash, and major variance
- Operational performance: customer, product, service, program, or people metrics
- Strategic initiatives completed: status, evidence, lessons learned
- Major risks and mitigations: owner, severity, action status
- ESG, governance, compliance, or audit highlights
- Next-year priorities and assumptions: what is committed vs uncertain
- Appendix/Q&A prompt slide: backup tables and discussion items
15-slide board or investor version for decisions
- Cover and confidentiality/disclosure note
- Executive summary: performance, risks, outlook, decisions required
- Management narrative: what changed during the year and why
- Market or operating context: demand, competition, funding, regulation, or sector trends
- Financial dashboard: revenue, margin, operating income, cash, debt, budget variance
- Revenue or funding bridge: explain movement from prior year to current year
- Cost and margin analysis: key drivers, one-offs, efficiency actions
- Segment, region, product, or program performance
- Operating KPI trends: customers, retention, enrollment, beneficiaries, productivity, quality
- Strategic initiatives: completed, delayed, stopped, and lessons learned
- Capital allocation or resource use: investment, hiring, grants, facilities, technology
- Risk register: severity, likelihood, owner, mitigation, escalation needs
- Governance, ESG, compliance, or audit matters
- Next-year priorities: assumptions, targets, constraints, open questions
- Decision slide and appendix index: what approval or guidance is needed
25-slide workshop version for detailed review
- Cover, purpose, and workshop outcomes
- Executive summary
- Decision agenda
- External context and market/sector changes
- Full financial dashboard
- Revenue, funding, or income bridge
- Expense and margin analysis
- Cash flow, liquidity, debt, or runway
- Budget vs actual variance
- Segment or business-unit performance
- Regional or program performance
- Product, service, or curriculum performance
- Customer, donor, student, or beneficiary metrics
- People and capacity: headcount, retention, hiring, productivity
- Strategic initiative scorecard
- Technology, operations, or process improvements
- ESG, governance, compliance, or audit status
- Risk heatmap
- Top risk deep dives with owners and mitigations
- Scenario view: base case, downside, upside, and assumptions
- Next-year operating priorities
- Investment, resource, or budget requests
- Discussion prompts and tradeoffs
- Decisions required and next steps
- Appendix index with detailed tables and definitions
Meeting design note: In executive reviews, the first 10 minutes usually establish the storyline that the rest of the discussion tests. Put “what changed,” “why it changed,” and “what we recommend” in slides 2–4. Move dense tables, departmental detail, and reconciliation schedules to the appendix unless they directly support a decision.
Chart and Data Rules for Annual Report Templates
Annual report presentations are judged on trust before beauty. The template should make common reporting questions easy to answer: how revenue changed, where margin moved, which segments grew, how expenses varied against budget, and which risks increased or decreased.

Choose charts by reporting question
- Bar chart: compare business units, regions, products, programs, or expense categories.
- Line chart: show monthly, quarterly, or year-over-year trends; label fiscal year and units clearly.
- Waterfall chart: explain revenue, EBITDA, cash, margin, or funding movement from one period to another; show negative drivers visibly.
- Dashboard cards: show headline metrics such as revenue, gross margin, churn, NPS, cash runway, donor retention, or beneficiaries served.
- Stacked bar: use when mix matters, but label totals and categories so the audience does not confuse composition with growth.
- Dual-axis chart: use sparingly for related measures such as revenue and margin; avoid it when the axis scaling could exaggerate correlation.
- Risk matrix: show severity and likelihood, but add owners and mitigation actions so the slide becomes operational.
Common chart mistakes and better choices
| Mistake | Better choice |
|---|---|
| Using a pie chart to show YoY performance | Use a bar or line chart so change over time is visible. |
| Combining audited actuals and forecasts with the same visual style | Separate actuals from forecasts with shading, dashed lines, or clear labels. |
| Showing non-GAAP or adjusted metrics without reconciliation | Add a footnote, appendix reconciliation, and consistent metric definition. |
| Using rounded numbers that do not tie across slides | Reconcile to source data and specify whether percentages use rounded or unrounded values. |
| Hiding survey base size for NPS, employee engagement, or beneficiary data | Show response count, date range, and methodology note. |
Editable chart data matters more than having many chart styles. In PopAi, the chart editor can handle common annual-report visuals such as bars, lines, waterfalls through editable data, dual-axis charts, scatter/bubble views, and Excel upload or download. The practical use cases are straightforward: import finance-approved tables, add reference lines for target vs actual, label units and fiscal periods, and use callouts to explain major variance. After export, still check whether the final PPTX preserves the editability and formatting your finance team expects.
Data case: A revenue bridge that looks correct can still fail review if one slide uses rounded millions and another uses exact thousands. In one board-review workflow, the visible variance was off by 0.1 percentage points because the KPI dashboard used rounded inputs while the appendix used unrounded source data. The fix was not visual; it was governance: one approved data table, one owner, and one rounding rule across the deck.
Annual Report Data Visualization Examples You Can Recreate
Use real audited annual-report source tables, then turn them into clear slides only after the numbers and labels have been checked.
Annual report templates become more useful when they show exactly which table, filing, or management discussion section the slide is based on. The examples below are not benchmark claims. They are template patterns for converting published annual report data into readable presentation visuals.
| Annual report source | Slide template | What to visualize | Human check before presenting |
|---|---|---|---|
| Audited income statement and MD&A revenue discussion. | Revenue bridge slide | Prior-year revenue, current-year revenue, key drivers, and management commentary. | Confirm reporting currency, fiscal year, continuing operations, and whether growth is constant-currency or reported. |
| Segment note or geographic revenue table. | Segment performance slide | Revenue or operating income by business unit, region, or product family. | Check that segment definitions did not change year over year before using stacked bars or trend charts. |
| Cash flow statement and capital allocation notes. | Cash use slide | Operating cash flow, capital expenditure, dividends, buybacks, debt repayment, or reinvestment areas. | Separate cash flow from earnings and avoid implying future cash policy unless management explicitly states it. |
| Sustainability or people section attached to the annual report. | Non-financial KPI slide | Headcount, emissions, safety incidents, customer satisfaction, or governance milestones. | Label non-audited, limited-assurance, and self-reported metrics clearly. |
Source discipline: build the slide from the company annual report, Form 10-K, Form 20-F, or audited financial statement package. Useful source starting points: SEC EDGAR company filings and IFRS IAS 1 presentation of financial statements. Do not add “best practice” percentages, margin targets, or peer averages unless the article or deck includes the exact source.
Compliance, Security, and Human Review Checklist
Annual report slides often contain sensitive financial information, employee data, investor language, material risks, and forward-looking statements. Treat the AI-generated deck as a structured first draft and make review ownership explicit.
Review before sending
- Financial accuracy: verify revenue, profit, cash, debt, margin, forecasts, budget variance, and all YoY comparisons against approved sources.
- Metric definitions: align terms such as ARR, EBITDA, net income, operating cash flow, restricted funds, program expense ratio, churn, NRR, and cash runway.
- Source notes: add footnotes for non-GAAP metrics, survey data, estimates, external benchmarks, and any unaudited figures.
- Public-company language: review forward-looking statements, risk language, segment reporting, and non-GAAP reconciliation with legal or investor relations.
- Nonprofit language: verify restricted funds, grant obligations, donor privacy, program outcomes, and impact claims.
- Private-company language: protect investor-only metrics, customer concentration, cash runway, unreleased forecasts, and strategic transactions.
- Employee-facing language: remove individual performance data, pending restructuring plans, compensation-sensitive details, and board-only financial assumptions.
- Brand and accessibility: confirm logo use, colors, fonts, chart style, slide numbers, contrast, and readable chart labels.
- Confidentiality: do not upload restricted data unless your organization has approved the AI workflow, vendor terms, and data-handling requirements.
- Audience versioning: maintain separate board, investor, employee, donor, and public versions with a change log.
Editable export is a governance requirement, not just a convenience. PopAi supports exporting presentations to PPTX and PDF, and exported PPTX files can be opened in Microsoft PowerPoint with text objects remaining editable. That matters because many organizations still make final legal notes, approval stamps, board footers, and finance corrections inside PowerPoint before distribution. Whichever tool you use, test the export early for fonts, charts, speaker notes, footers, and layout shifts.
AI can draft the story. The organization must still own the truth, the disclosures, and the decisions.
Copy-Ready Input Checklist and Prompts
The quality of an AI annual report presentation depends heavily on source discipline. Instead of asking for “a professional annual report,” give the AI approved material, a source hierarchy, a target audience, and explicit rules for missing or conflicting data.
Prepare inputs in priority order
- Audited financial statements or final management accounts — highest authority for financial numbers.
- Board-approved CEO/CFO commentary — safest source for management interpretation.
- Final KPI dashboard and metric definitions — prevents conflicting ARR, churn, margin, or impact calculations.
- Risk register and compliance notes — provides owners, mitigations, and disclosure context.
- Strategic plan updates and initiative status — supports progress claims and next-year priorities.
- Customer, employee, donor, student, or beneficiary stories — useful only when privacy and permissions are confirmed.
- Brand guidelines and prior deck examples — helps preserve tone, design, slide ratio, and formatting conventions.
File preparation rules for cleaner AI output
- Remove obsolete drafts before upload, or label them clearly as background only.
- Mark unaudited numbers, forecasts, and assumptions separately from actual results.
- Redact confidential customer names, donor names, employee data, and unreleased forecasts when not required for drafting.
- Use consistent file names with date, status, and owner, such as FY2025_KPI_Dashboard_Final_CFO.xlsx.
- Ask the AI to create a final “items requiring verification” list rather than silently filling gaps.
Prompt for a board version
“Create a concise 12-slide board annual report deck for FY[year]. Use only the uploaded approved sources. Use conclusion-led titles. Prioritize financial performance, strategic progress, risks, and decisions required. Add source notes for every metric. Move detailed tables to the appendix. Do not invent numbers. Use TBD where data is missing. Create a final verification list for unsupported claims, conflicting figures, non-GAAP metrics, and forward-looking statements.”
Prompt for an employee town hall version
“Rewrite this annual report as an employee-facing year-in-review presentation. Use plain language, celebrate team contributions, explain performance honestly, and end with next-year priorities. Keep financial detail high-level. Do not include unreleased forecasts, investor-only metrics, individual performance data, compensation-sensitive information, customer-confidential details, or pending restructuring plans.”
For best results, generate audience-specific versions rather than one universal deck. Useful revision instructions include: “turn this table into three KPI cards,” “separate actuals from forecasts,” “rewrite this for donors without investor terminology,” “move unsupported claims to a verification slide,” and “make the outlook slide more cautious and evidence-based.” In PopAi, you can continue refining slides after generation with natural-language edits, but the strongest results still come from disciplined source inputs and a clear review workflow.
FAQ: Annual Report Templates for AI Presentations
What slides should an AI annual report template include?
A strong template usually includes a cover, agenda, executive message, annual highlights, financial performance, operating metrics, strategic initiatives, ESG or governance, risks, outlook, and appendix slides.
Can I upload PDF, Word, or PowerPoint materials to create an annual report presentation?
Yes. In PopAi, you can start from a prompt or upload supported materials such as PDF, DOCX, TXT, MD, HTML, PPTX, images, audio, and video sources. The system organizes content before generating slides.
Are AI-generated annual report slides ready for a board meeting?
They can be an excellent first draft, but financial data, audit language, source notes, forward-looking statements, and legal disclosures should still be reviewed by the responsible finance, legal, and leadership teams.
Which chart types work best for annual report presentations?
Use bar charts for category comparison, line or area charts for trends, waterfall charts for profit bridges, dashboards for KPI snapshots, and dual-axis charts carefully when comparing related measures such as revenue and margin.
Create your presentation with one click now
Turn annual report notes, financial summaries, and strategy updates into a structured presentation draft you can edit, brand, export, and share.
Create with PopAi