
You can master the full–process operation of pivot tables with zero threshold by using Excel Copilot. From quick creation to in–depth analysis, you only need natural language instructions and no need to memorize complex steps or formulas. Combining Excel Copilot pivot tables with the AI functions of popai can also realize the efficient transformation and display of data results, maximizing the data analysis value of pivot tables. The combination of Excel Copilot and pivot tables breaks the learning threshold of traditional pivot tables, while popai enables the analysis results of pivot tables to be quickly turned into professional reports and presentations, becoming a highly efficient data processing combination for workplace office work.
1. Why Can Excel Copilot Master Pivot Tables Effortlessly?
Pivot tables are the core tool in Excel for processing massive data and achieving multi–dimensional analysis, but traditional operations require mastering multiple steps such as data source standardization, field dragging and format setting, which daunts many professionals. As a built–in AI intelligent assistant, Excel Copilot can understand users’ data analysis needs through natural language, skip the tedious steps of manual operation, guide the completion of the creation and analysis of pivot tables throughout the process, and this is the core reason why it can master pivot tables effortlessly.
Excel Copilot can accurately identify the data dimensions and numerical indicators in the table, and automatically complete field matching and summary calculation according to the user’s text instructions. Even for zero–based users, they can generate professional pivot tables only by stating their analysis needs.
2.How to Create Pivot Tables Quickly with Excel Copilot?
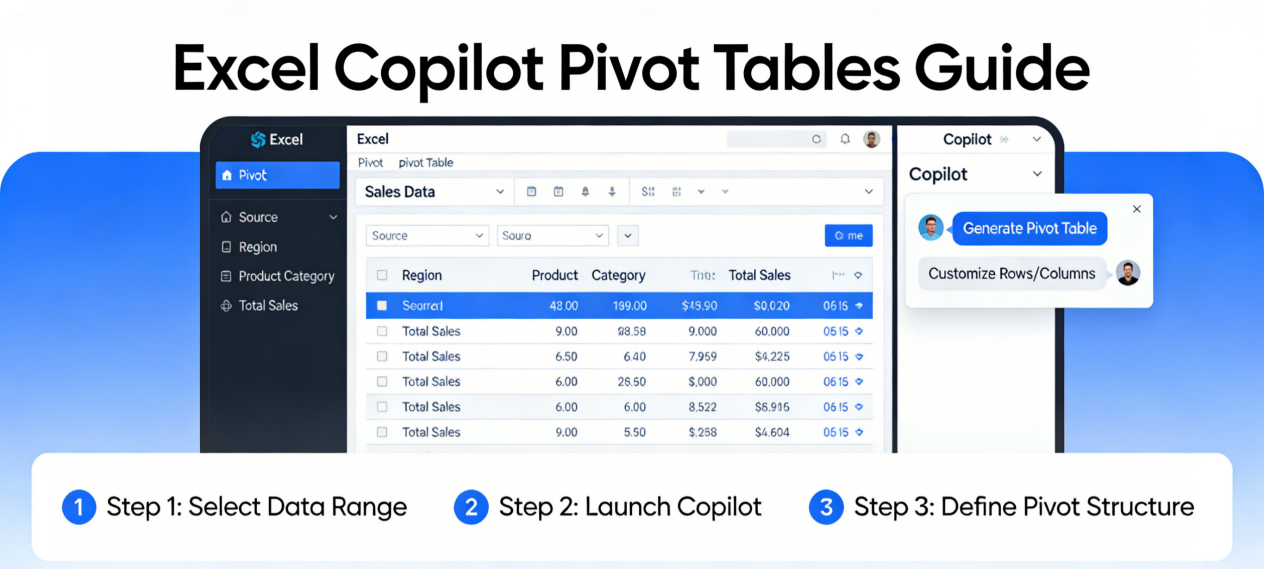
To create accurate pivot tables quickly with Excel Copilot, preparing the data source in the first step is the foundation, which is also a prerequisite for ensuring the accuracy of pivot table analysis results. Then, with simple shortcut keys and natural language instructions, you can achieve second–level creation. The whole process requires no complex operations and can be done in one step even for beginners.
First, standardize the raw data in Excel into a table format. Select all data areas and press the CTRL+T shortcut key. In the pop–up window, check ‘include headers’ and confirm to complete the table formatting. This step allows Excel Copilot to identify data fields more accurately. Then save the workbook to the cloud, which is a necessary condition for enabling Excel Copilot. After completion, press the combined shortcut key Alt+H+FX to open the side panel of Excel Copilot.
You only need to describe your data analysis needs in concise language in the input box of the panel, such as ‘create pivot tables for total sales statistics by region’ or ‘generate pivot tables for comparing the sales volume of each product by month’. Excel Copilot will respond to the instructions immediately and automatically complete the creation of pivot tables. You only need to choose to add the pivot table to a new worksheet to see the generated analysis results.
3.How to Customize and Optimize Pivot Tables with Excel Copilot?
After creating the basic pivot tables with Excel Copilot, you can also let it customize and optimize the pivot tables and adjust the visualization through natural language instructions, making the data display more in line with the analysis needs.
Excel Copilot supports all–round adjustment of the indicators, dimensions and display forms of pivot tables. For example, on the basis of the basic pivot table, input ‘add a column to count the average sales by category’, and Copilot will automatically add a new calculation column in the pivot table and complete the average calculation; input ‘display the data of this pivot table as a column chart’, and it will quickly generate a visual chart linked to the pivot table, making data comparison more intuitive. If you need to filter and analyze the data, just input ‘highlight the months with abnormally high sales’, and Copilot will also mark the data in the pivot table to accurately locate data outliers.
4.How to Dig Deep into the Analytical Value of Pivot Tables with Excel Copilot?
Excel Copilot can not only create and optimize pivot tables, but also conduct in–depth data analysis based on the generated pivot tables. By proactively providing analysis suggestions and executing advanced analysis instructions, it explores the trends, correlations and laws behind the data, upgrading the analysis of pivot tables from simple summary statistics to valuable business insights.
After the creation of pivot tables is completed, the side panel of Excel Copilot will automatically push a series of analysis suggestions, such as ‘conduct advanced analysis for more in–depth results’, ‘generate a line chart for average value data’ and ‘find outliers in the data’. Users only need to click the corresponding suggestions, and Copilot will execute them immediately. Among them, advanced analysis will explore the correlation of data from multiple dimensions, such as analyzing the correlation trend between sales volume and regions and time; outlier search can locate values that deviate from the normal data range, helping users troubleshoot data errors or discover business opportunities. All these analysis results will be directly reflected in the pivot tables or newly added analysis charts.
If you have more specific in–depth analysis needs, you can also directly input custom instructions in the input box, such as ‘analyze the month–on–month changes in sales volume of each region’ or ‘count the proportion of sales volume of each category’. Excel Copilot will conduct secondary analysis on the pivot tables according to the instructions and generate more targeted analysis results.
5.Which Shortcut Keys Can Be Matched with Excel Copilot to Improve Pivot Table Operation Efficiency?
In the process of using Excel Copilot to operate pivot tables, matching it with Excel’s native shortcut keys can further improve operation efficiency, reduce the number of mouse clicks, and make the data processing process smoother. These shortcut keys are simple to operate and easy to remember and use, suitable for repeated use in daily office work.
In addition to CTRL+T for creating tables and Alt+H+FX for opening Copilot, there are several core shortcut keys that you must master: Alt+N+V for manually creating pivot tables without using Copilot, which is suitable for quickly calling up the pivot table creation window when you do not want to use Copilot; CTRL+Z for undoing operations, which can undo all operations of Excel Copilot with one click—if you are not satisfied with the generated pivot table, you can quickly restore it to the original state; CTRL+arrow keys for quickly locating the first row, last row, first column and last column in massive pivot table data, avoiding the tediousness of manually dragging the scroll bar.
In the daily maintenance of pivot tables, there is also a practical operation skill instead of a shortcut key: after the raw data is modified, select any cell of the pivot tables, click the ‘Data’ tab in Excel and select ‘Refresh’ to update the data of the pivot tables synchronously and ensure the accuracy of the analysis results.
6.What Are the Key Points for Daily Maintenance of Pivot Tables?
To make good use of the pivot tables generated by Excel Copilot, you not only need to know how to create and analyze them, but also do a good job in daily maintenance. This can ensure the data accuracy and reusability of the pivot tables, and avoid affecting subsequent analysis work due to data or format problems. The key points of daily maintenance are simple to operate, and you only need to develop good habits in office work.
First of all, timely data refresh is the core maintenance point. Any modification of the raw data, including addition, deletion and numerical modification, requires refreshing the pivot tables. Otherwise, the pivot tables will always display old data, leading to wrong analysis results. Secondly, avoid randomly modifying the native fields of the pivot tables.
If you need to share the pivot tables with colleagues, it is recommended to save the pivot tables together with the raw data, or convert the pivot tables into static tables to avoid the pivot tables failing to display normally due to missing data sources when colleagues open them. At the same time, with the help of Excel’s cloud synchronization function, save the workbook containing pivot tables in the cloud, which can not only ensure the normal use of Excel Copilot, but also realize multi–person collaborative editing, facilitating the whole team to conduct data analysis together.
7.How to Achieve Efficient Collaboration Between Excel Copilot Pivot Tables and popai?
Excel Copilot pivot tables can efficiently complete data processing and analysis, while various AI functions of popai can quickly transform these analysis results into professional office outcomes, realizing a closed loop from data processing to report writing and presentation creation. The collaboration between the two can substantially improve the efficiency of data office work for professionals, and the operation process is simple without the need for additional professional skills.
The AI Writing function of popai can directly write professional data analysis reports and business documents based on the pivot table data generated by Excel Copilot. You only need to paste the core data and analysis conclusions from the pivot tables into the input box of popai and input ‘write a monthly data analysis report based on this sales data pivot table’, and popai can quickly generate a report with a complete structure and clear logic.
In terms of the display of data results, the AI Presentation function of popai can quickly turn the analysis results of Excel Copilot pivot tables into professional PPTs. Through the Instant PPT Generation function of popai, you can customize the number of slides and select a layout suitable for workplace reporting. popai will automatically search for pictures related to the data to generate a presentation with strong visual appeal. It can also optimize the text expression of the slides through the AI–Powered Content Enhancement function, making the data display clearer.
For scenarios that require in–depth interpretation and knowledge management of pivot table data, the Intelligent Reading Comprehension function of popai can conduct AI–driven interpretation of complex pivot table data, and can also automatically generate flow charts, transforming tedious data indicators into intuitive charts to simplify complex information. With the help of the One–Click Annotation function of popai, you can mark key data in the pivot tables and add annotations to realize systematic knowledge organization.
Excel Copilot makes the operation of pivot tables zero–threshold, allowing more professionals to easily master this core data analysis tool, while popai makes the analysis results of pivot tables no longer limited to Excel spreadsheets, but can be quickly turned into various outcomes needed in the workplace such as reports, PPTs and documents. The collaboration between the two truly realizes end–to–end efficient office work of ‘data processing – analysis – outcome implementation’. For professionals, mastering the operation skills of Excel Copilot pivot tables and combining them with the AI functions of popai can make data a strong support in work, greatly improving office efficiency and professionalism, and no longer having to spend a lot of time and energy on data processing and outcome display.