
Presentation Summary
The presentation discusses the impending Social Security insolvency by 2035, the projected $16,500 benefit cut crisis, and its impact on retirees. It covers Social Security Disability Insurance, retirement income planning, and policy solutions.
Full Presentation Transcript
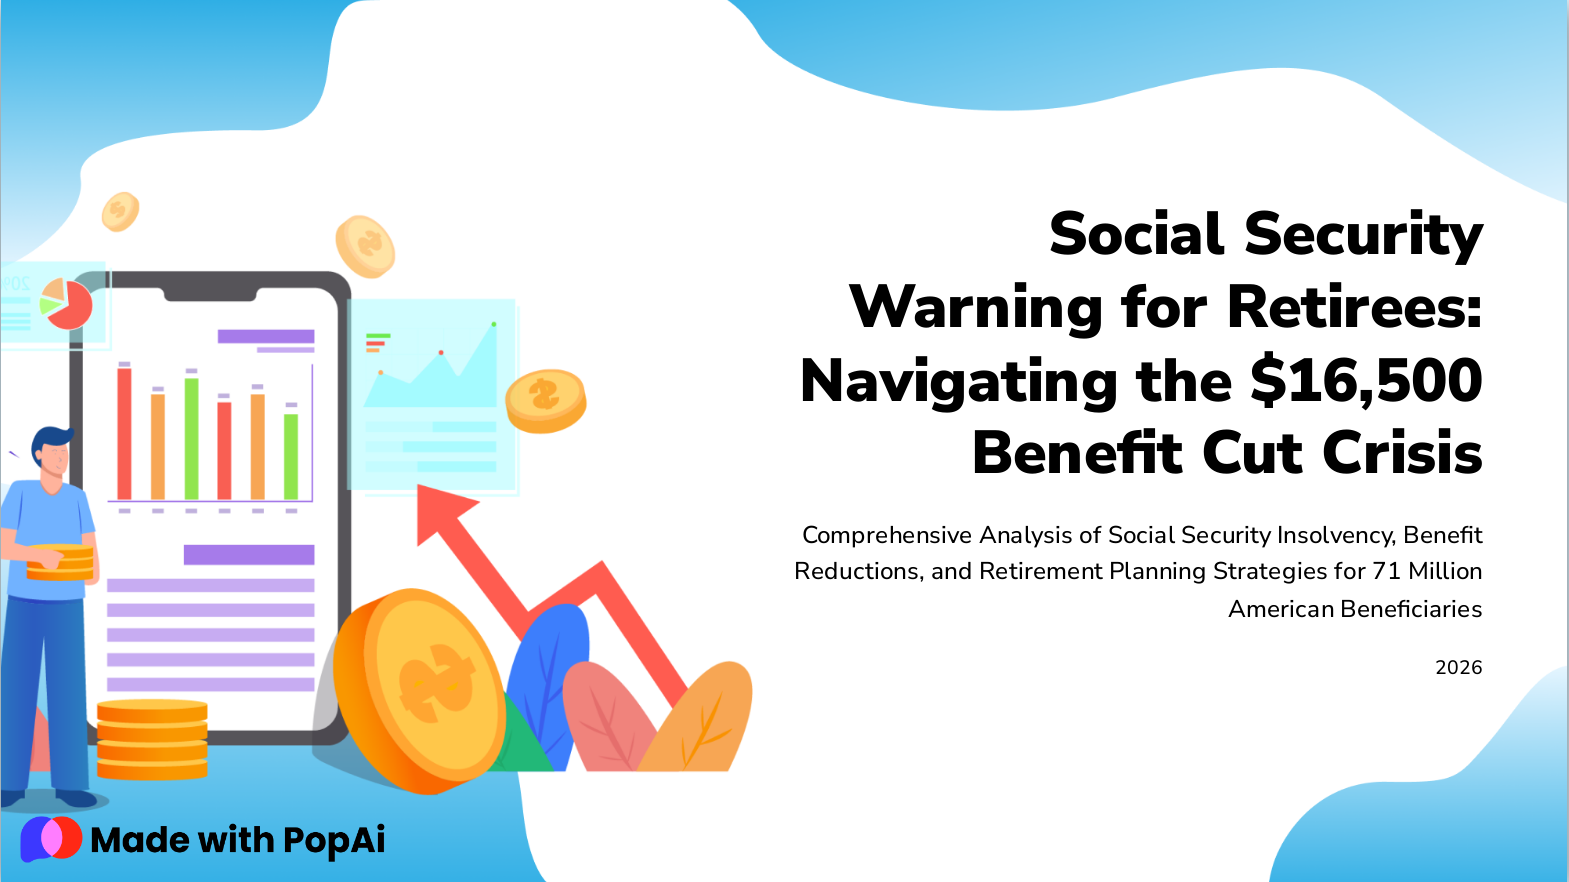
Slide 1: Social Security Warning for Retirees: Navigating the $16,500 Benefit Cut Crisis
Comprehensive Analysis of Social Security Insolvency, Benefit Reductions, and Retirement Planning Strategies for 71 Million American Beneficiaries
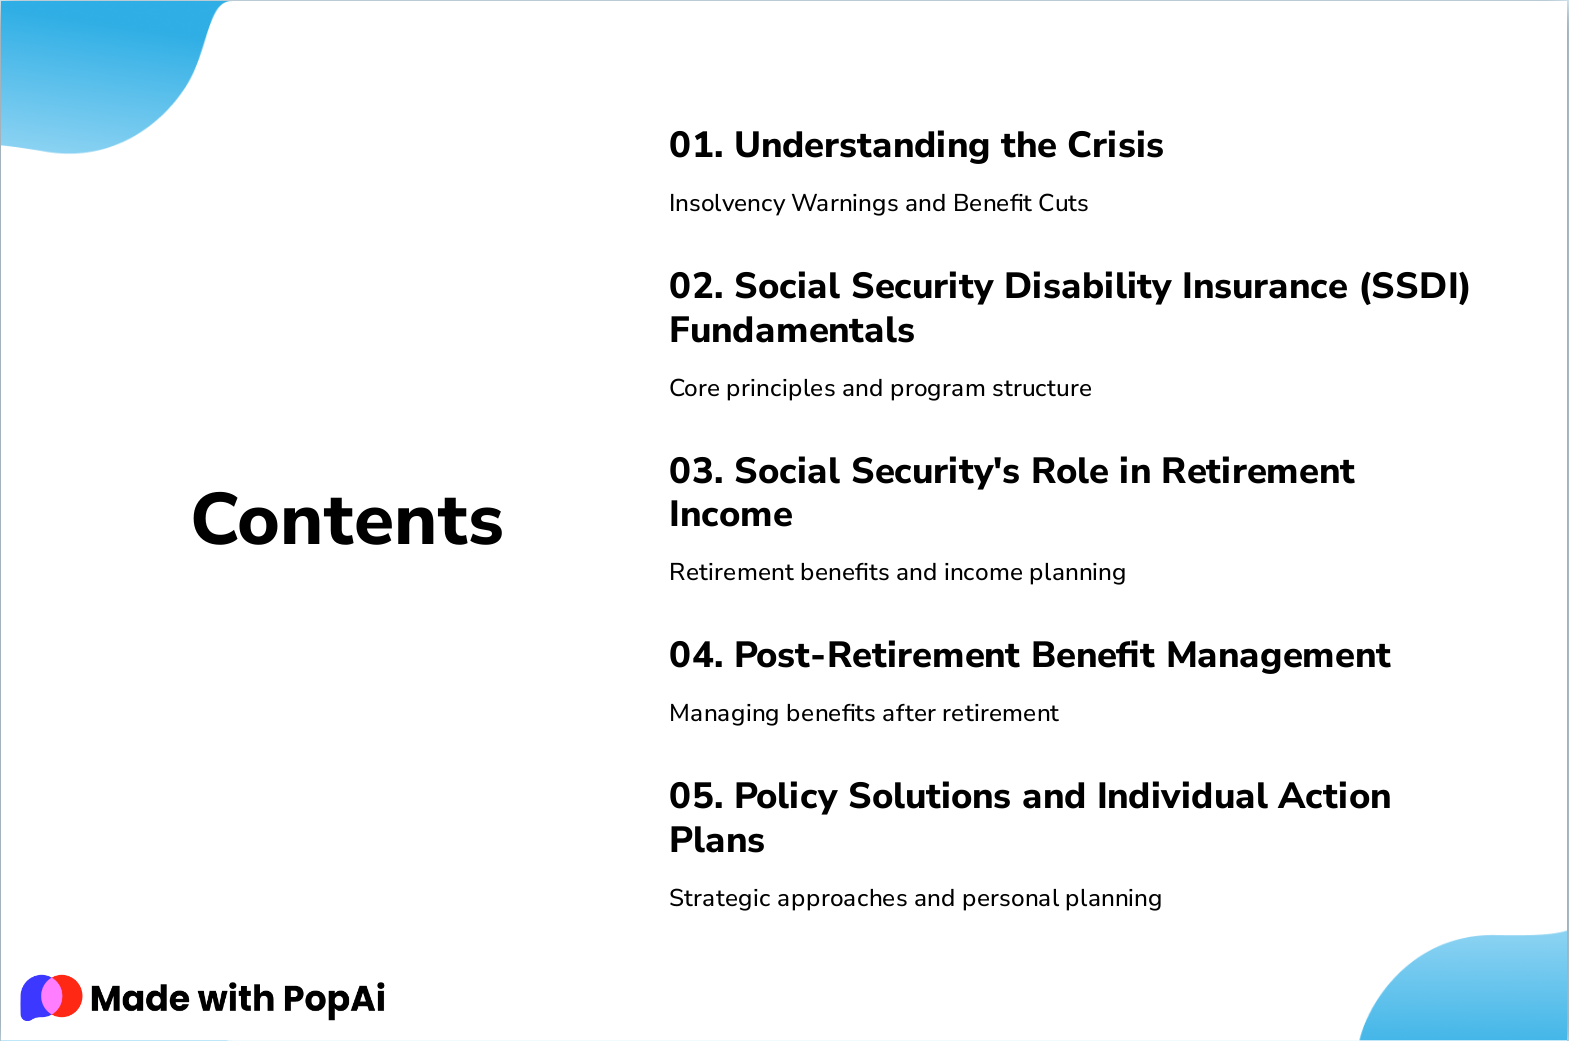
Slide 2: Contents
- Understanding the Crisis: Insolvency Warnings and Benefit Cuts
- Social Security Disability Insurance (SSDI) Fundamentals: Core principles and program structure
- Social Security's Role in Retirement Income: Retirement benefits and income planning
- Post-Retirement Benefit Management: Managing benefits after retirement
- Policy Solutions and Individual Action Plans: Strategic approaches and personal planning
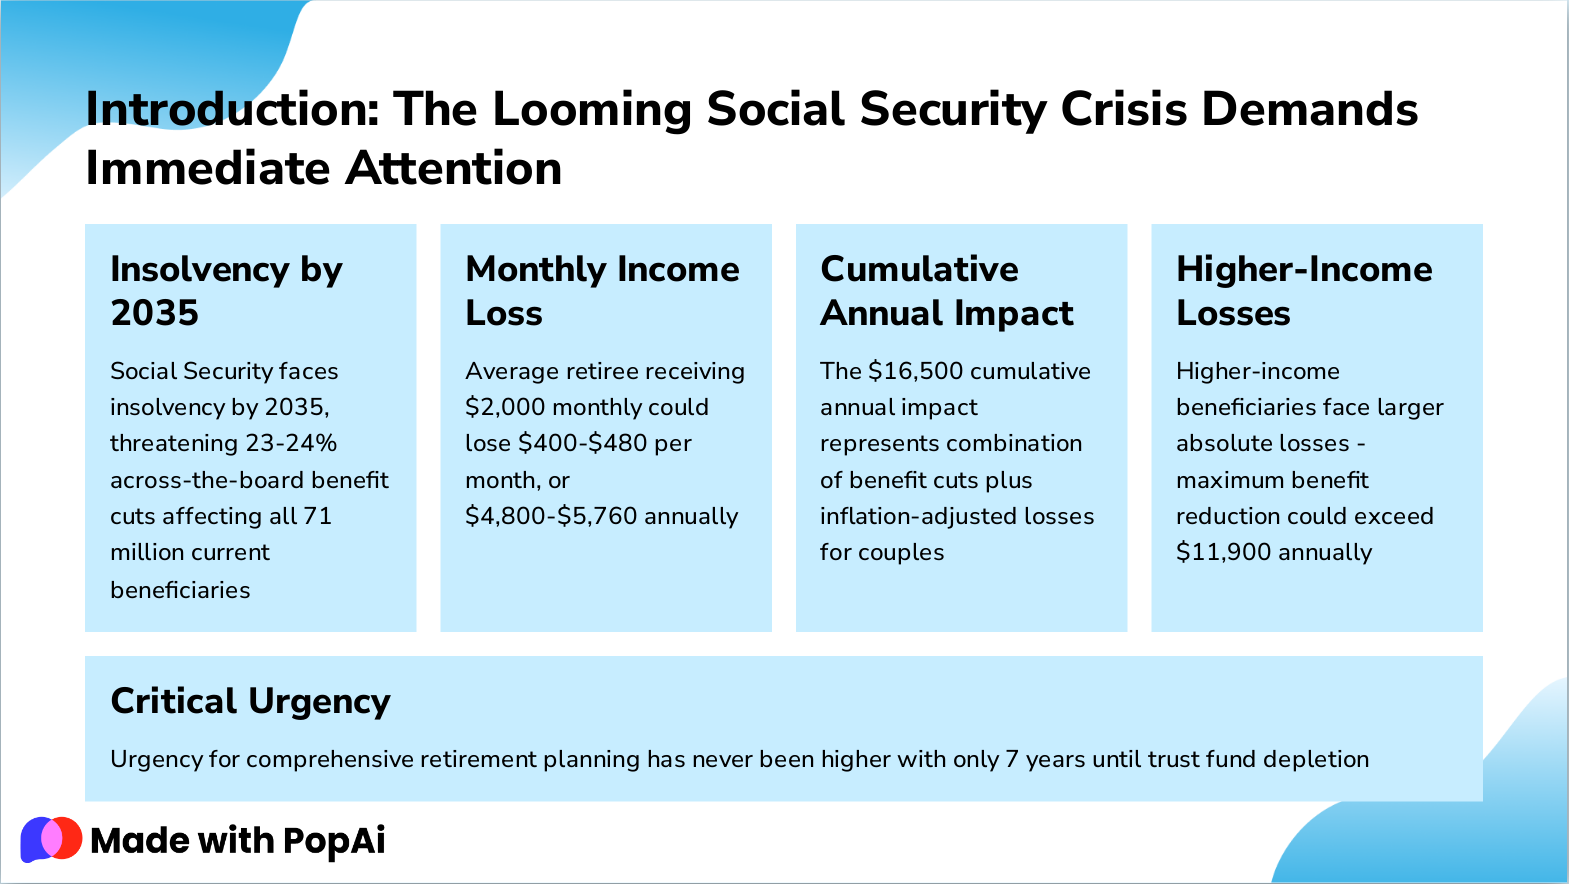
Slide 3: Introduction: The Looming Social Security Crisis Demands Immediate Attention
- Insolvency by 2035: Social Security faces insolvency by 2035, threatening 23-24% across-the-board benefit cuts affecting all 71 million current beneficiaries
- Monthly Income Loss: Average retiree receiving $2,000 monthly could lose $400-$480 per month, or $4,800-$5,760 annually
- Cumulative Annual Impact: The $16,500 cumulative annual impact represents combination of benefit cuts plus inflation-adjusted losses for couples
- Higher-Income Losses: Higher-income beneficiaries face larger absolute losses - maximum benefit reduction could exceed $11,900 annually
- Critical Urgency: Urgency for comprehensive retirement planning has never been higher with only 7 years until trust fund depletion
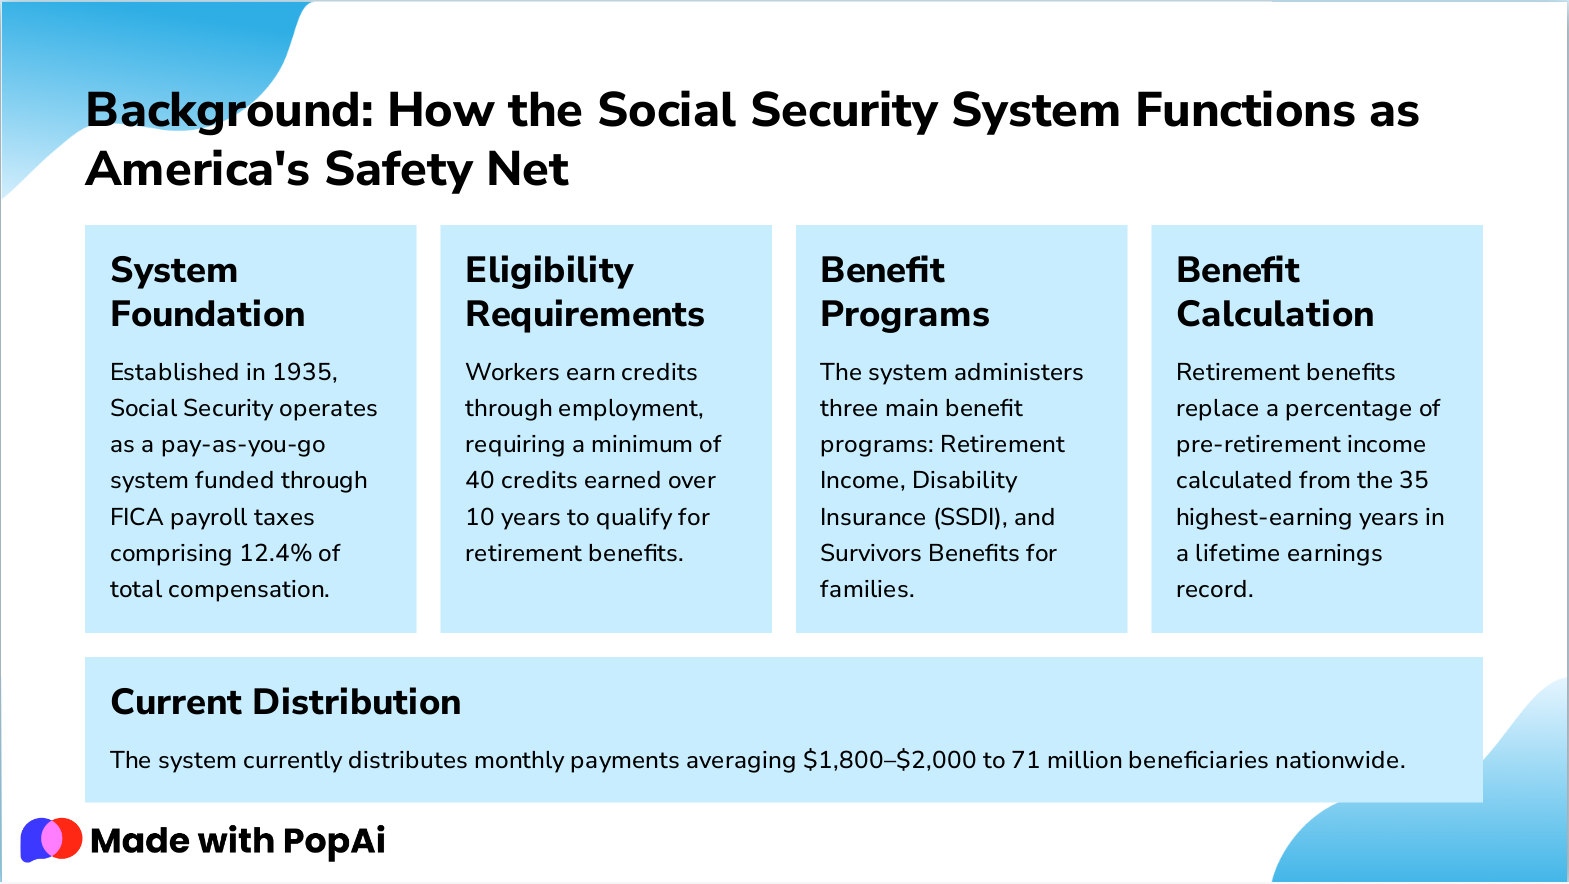
Slide 4: Background: How the Social Security System Functions as America's Safety Net
- System Foundation: Established in 1935, Social Security operates as a pay-as-you-go system funded through FICA payroll taxes comprising 12.4% of total compensation.
- Eligibility Requirements: Workers earn credits through employment, requiring a minimum of 40 credits earned over 10 years to qualify for retirement benefits.
- Benefit Programs: The system administers three main benefit programs: Retirement Income, Disability Insurance (SSDI), and Survivors Benefits for families.
- Benefit Calculation: Retirement benefits replace a percentage of pre-retirement income calculated from the 35 highest-earning years in a lifetime earnings record.
- Current Distribution: The system currently distributes monthly payments averaging $1,800–$2,000 to 71 million beneficiaries nationwide.
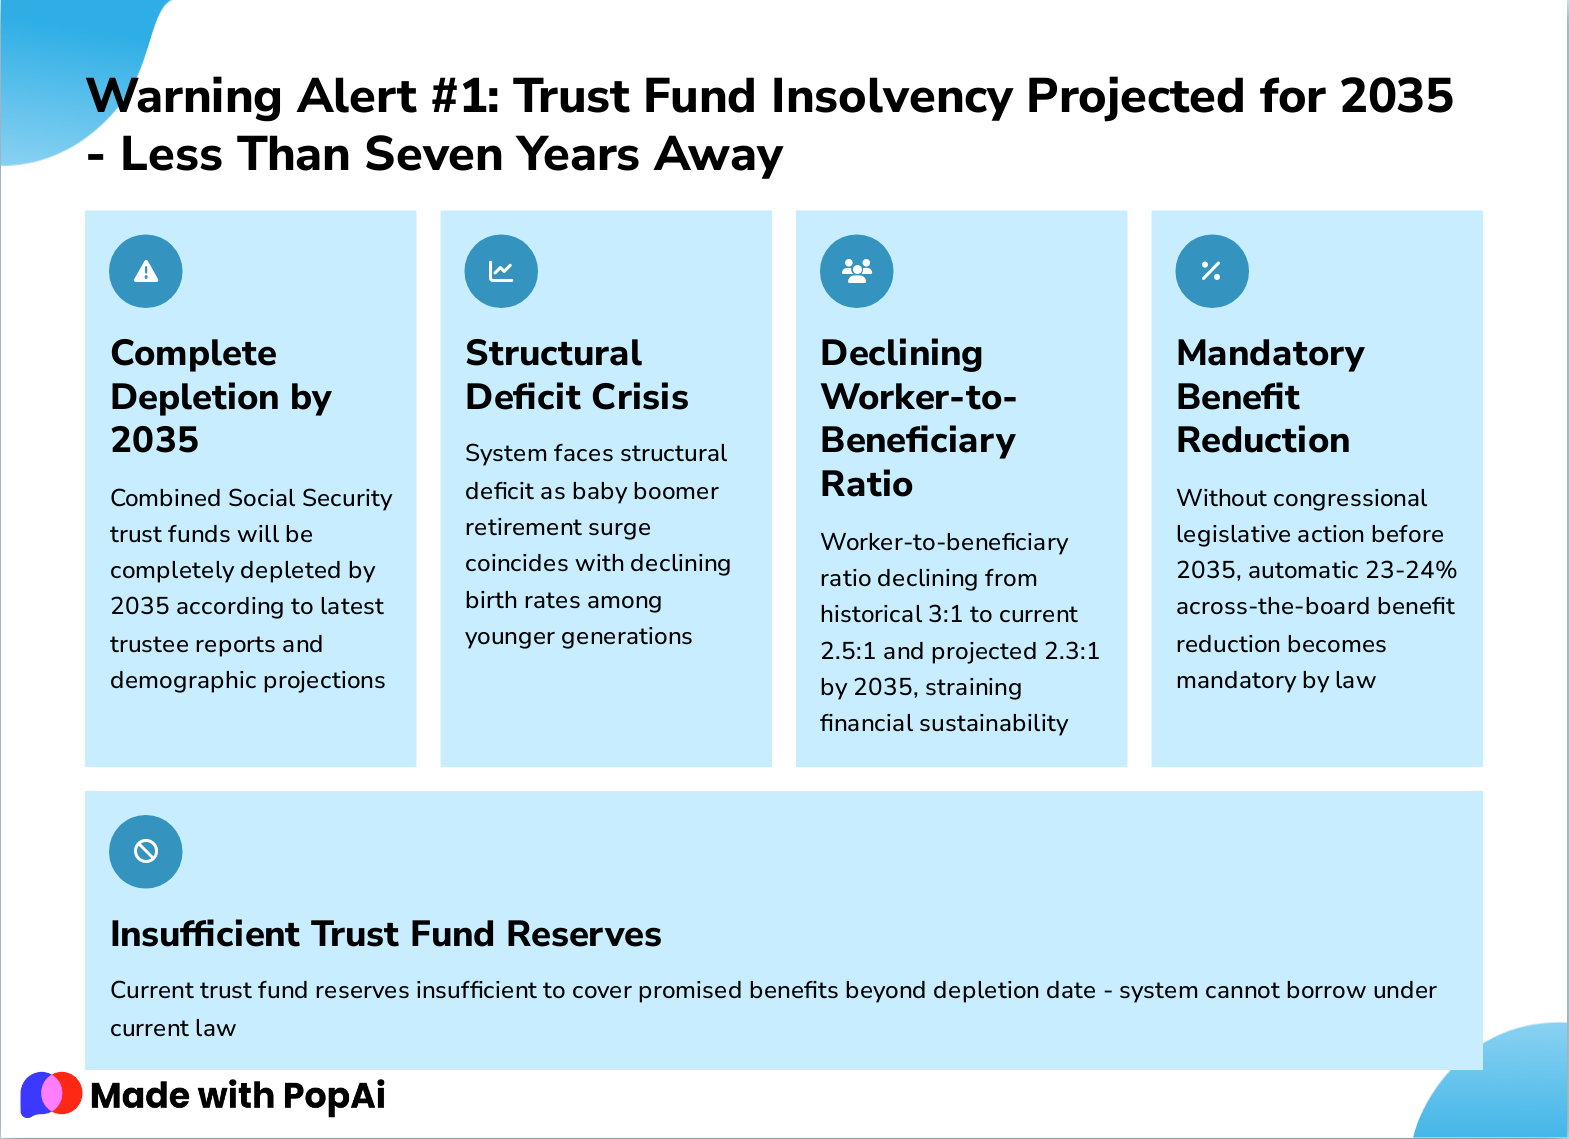
Slide 5: Warning Alert #1: Trust Fund Insolvency Projected for 2035 - Less Than Seven Years Away
- Complete Depletion by 2035: Combined Social Security trust funds will be completely depleted by 2035 according to latest trustee reports and demographic projections
- Structural Deficit Crisis: System faces structural deficit as baby boomer retirement surge coincides with declining birth rates among younger generations
- Declining Worker-to-Beneficiary Ratio: Worker-to-beneficiary ratio declining from historical 3:1 to current 2.5:1 and projected 2.3:1 by 2035, straining financial sustainability
- Mandatory Benefit Reduction: Without congressional legislative action before 2035, automatic 23-24% across-the-board benefit reduction becomes mandatory by law
- Insufficient Trust Fund Reserves: Current trust fund reserves insufficient to cover promised benefits beyond depletion date - system cannot borrow under current law
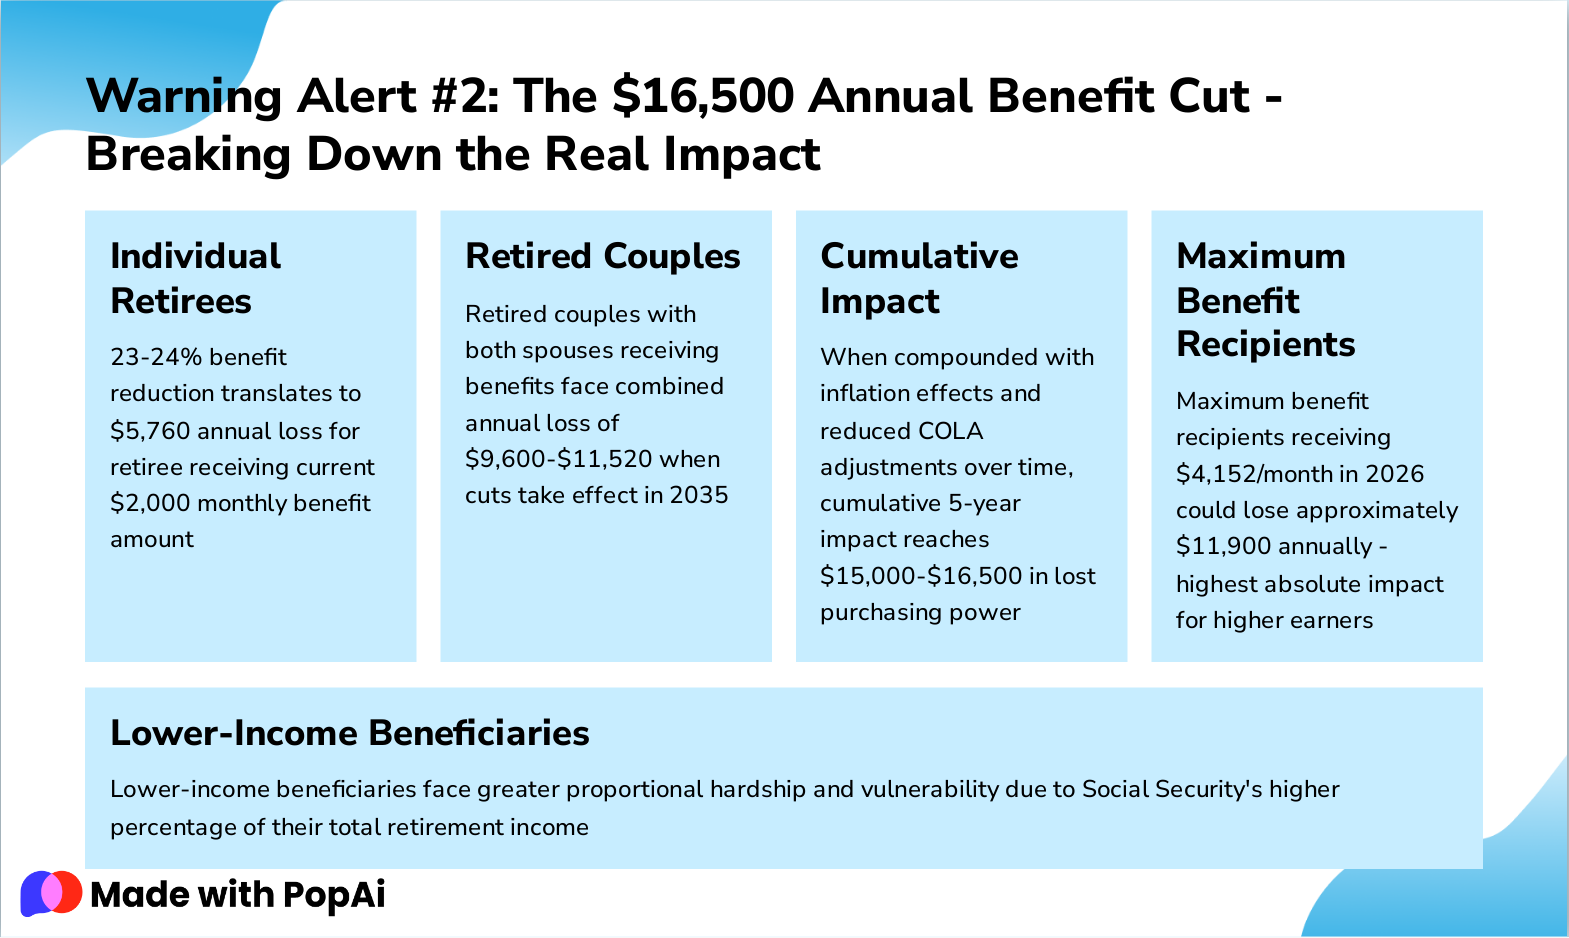
Slide 6: Warning Alert #2: The $16,500 Annual Benefit Cut - Breaking Down the Real Impact
- Individual Retirees: 23-24% benefit reduction translates to $5,760 annual loss for retiree receiving current $2,000 monthly benefit amount
- Retired Couples: Retired couples with both spouses receiving benefits face combined annual loss of $9,600-$11,520 when cuts take effect in 2035
- Cumulative Impact: When compounded with inflation effects and reduced COLA adjustments over time, cumulative 5-year impact reaches $15,000-$16,500 in lost purchasing power
- Maximum Benefit Recipients: Maximum benefit recipients receiving $4,152/month in 2026 could lose approximately $11,900 annually - highest absolute impact for higher earners
- Lower-Income Beneficiaries: Lower-income beneficiaries face greater proportional hardship and vulnerability due to Social Security's higher percentage of their total retirement income
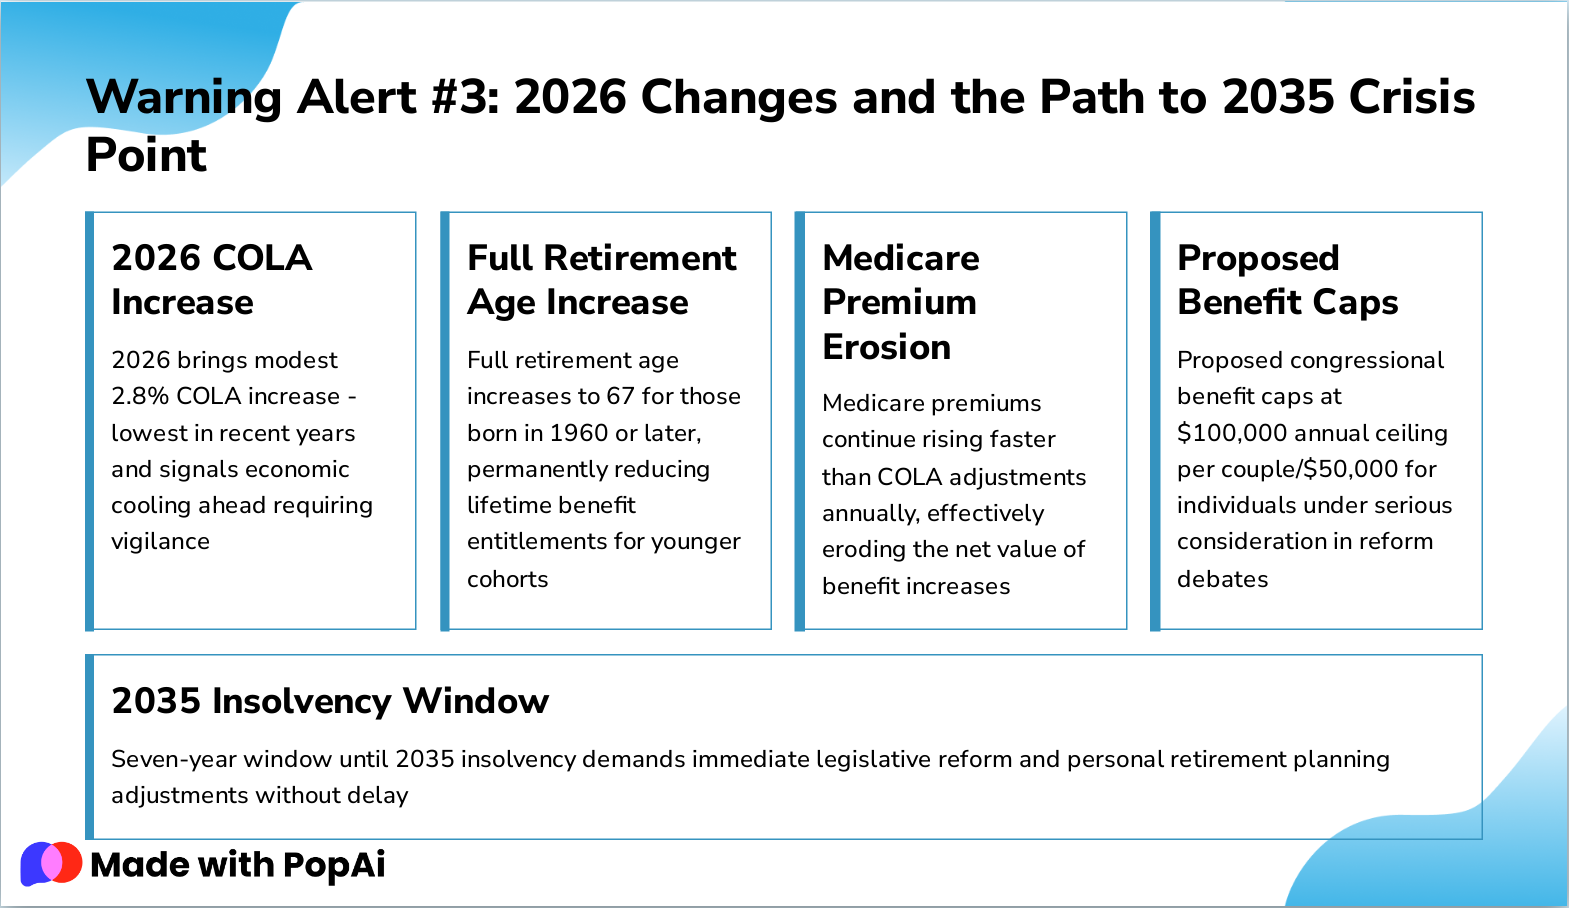
Slide 7: Warning Alert #3: 2026 Changes and the Path to 2035 Crisis Point
- 2026 COLA Increase: 2026 brings modest 2.8% COLA increase - lowest in recent years and signals economic cooling ahead requiring vigilance
- Full Retirement Age Increase: Full retirement age increases to 67 for those born in 1960 or later, permanently reducing lifetime benefit entitlements for younger cohorts
- Medicare Premium Erosion: Medicare premiums continue rising faster than COLA adjustments annually, effectively eroding the net value of benefit increases
- Proposed Benefit Caps: Proposed congressional benefit caps at $100,000 annual ceiling per couple/$50,000 for individuals under serious consideration in reform debates
- 2035 Insolvency Window: Seven-year window until 2035 insolvency demands immediate legislative reform and personal retirement planning adjustments without delay
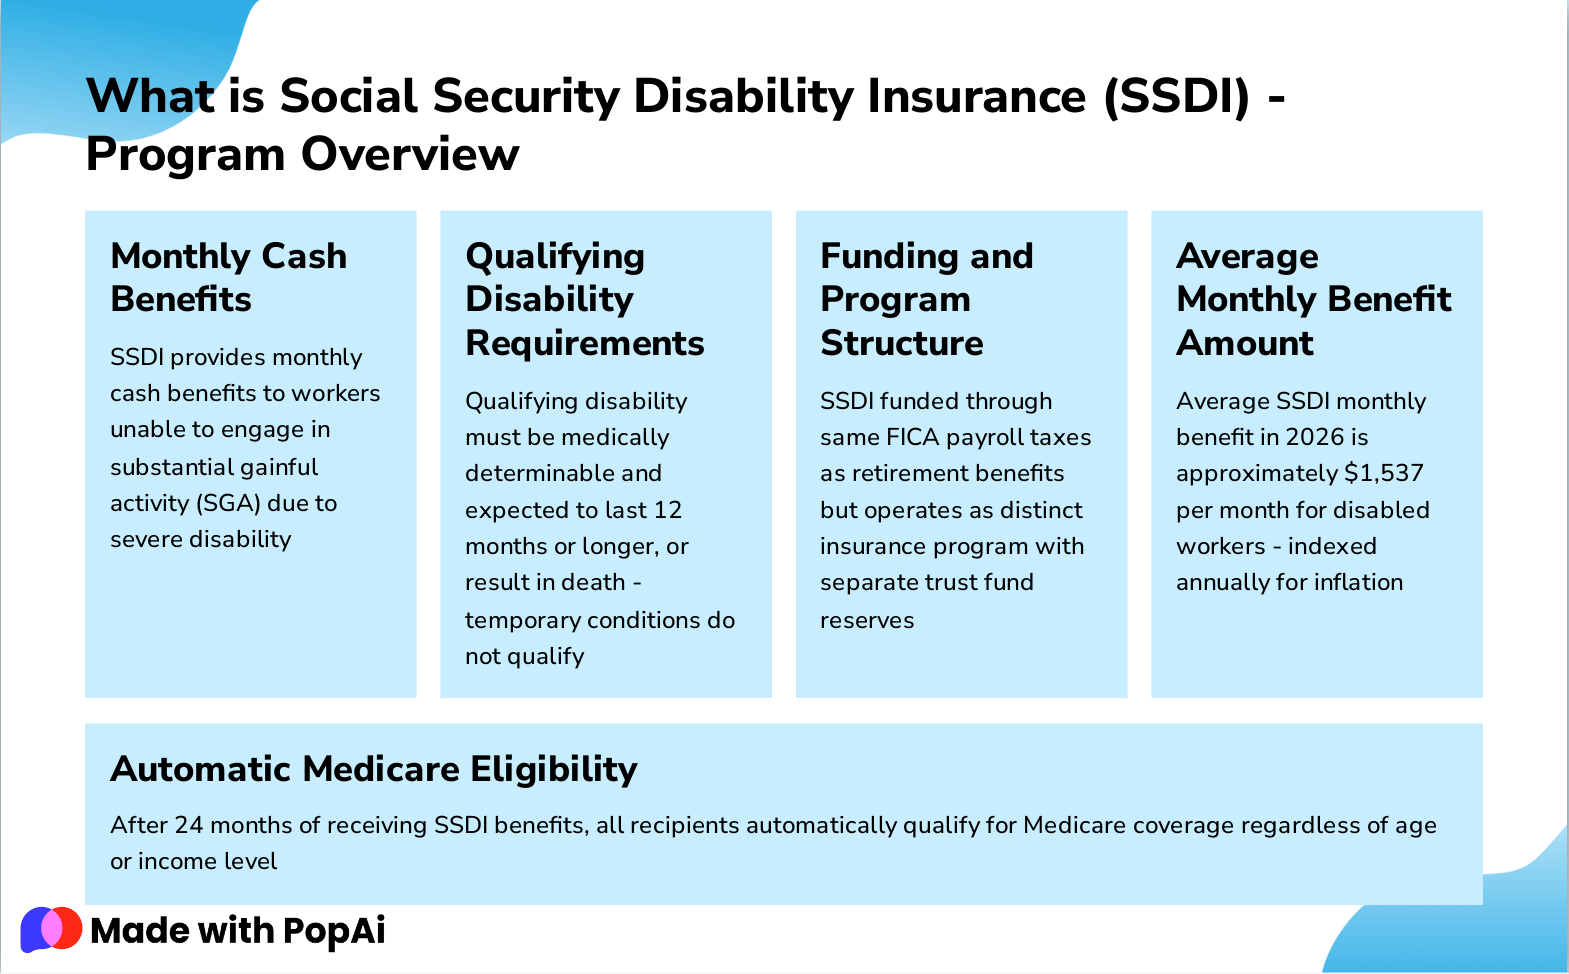
Slide 8: What is Social Security Disability Insurance (SSDI) - Program Overview
- Monthly Cash Benefits: SSDI provides monthly cash benefits to workers unable to engage in substantial gainful activity (SGA) due to severe disability
- Qualifying Disability Requirements: Qualifying disability must be medically determinable and expected to last 12 months or longer, or result in death - temporary conditions do not qualify
- Funding and Program Structure: SSDI funded through same FICA payroll taxes as retirement benefits but operates as distinct insurance program with separate trust fund reserves
- Average Monthly Benefit Amount: Average SSDI monthly benefit in 2026 is approximately $1,537 per month for disabled workers - indexed annually for inflation
- Automatic Medicare Eligibility: After 24 months of receiving SSDI benefits, all recipients automatically qualify for Medicare coverage regardless of age or income level
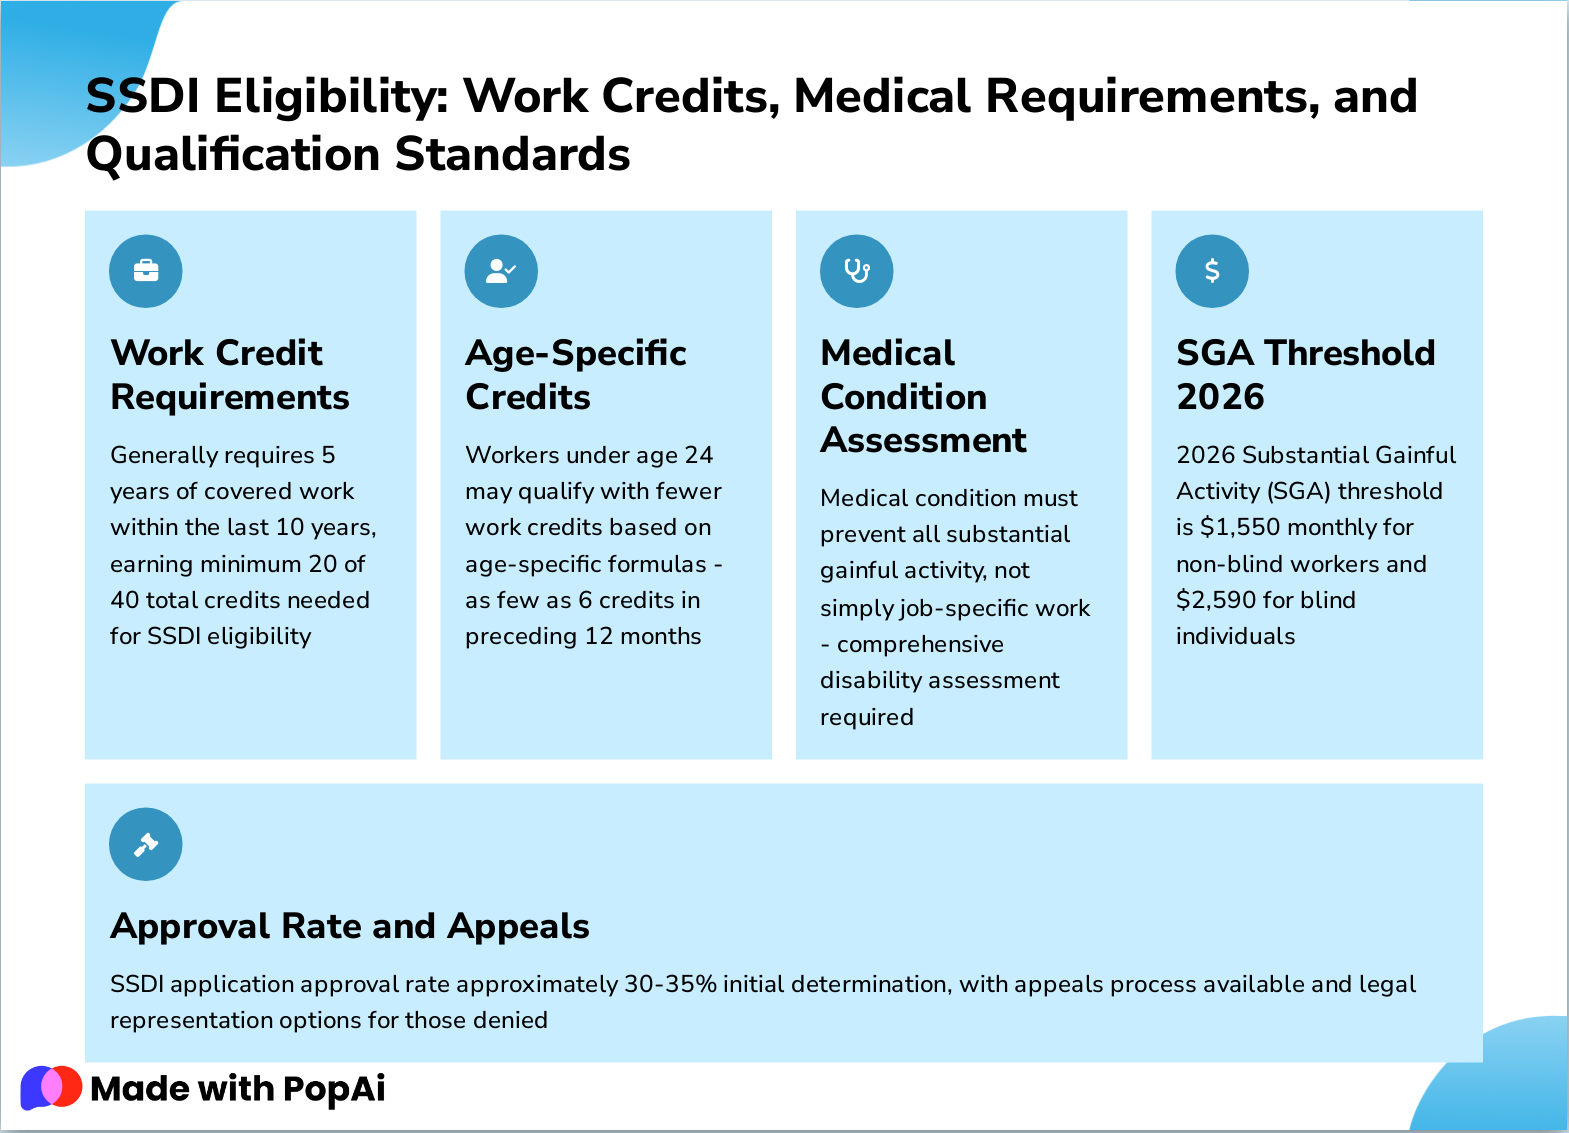
Slide 9: SSDI Eligibility: Work Credits, Medical Requirements, and Qualification Standards
- Work Credit Requirements: Generally requires 5 years of covered work within the last 10 years, earning minimum 20 of 40 total credits needed for SSDI eligibility
- Age-Specific Credits: Workers under age 24 may qualify with fewer work credits based on age-specific formulas - as few as 6 credits in preceding 12 months
- Medical Condition Assessment: Medical condition must prevent all substantial gainful activity, not simply job-specific work - comprehensive disability assessment required
- SGA Threshold 2026: 2026 Substantial Gainful Activity (SGA) threshold is $1,550 monthly for non-blind workers and $2,590 for blind individuals
- Approval Rate and Appeals: SSDI application approval rate approximately 30-35% initial determination, with appeals process available and legal representation options for those denied
Slide 10: SSDI vs. Retirement Benefits: Critical Differences Every Worker Should Understand
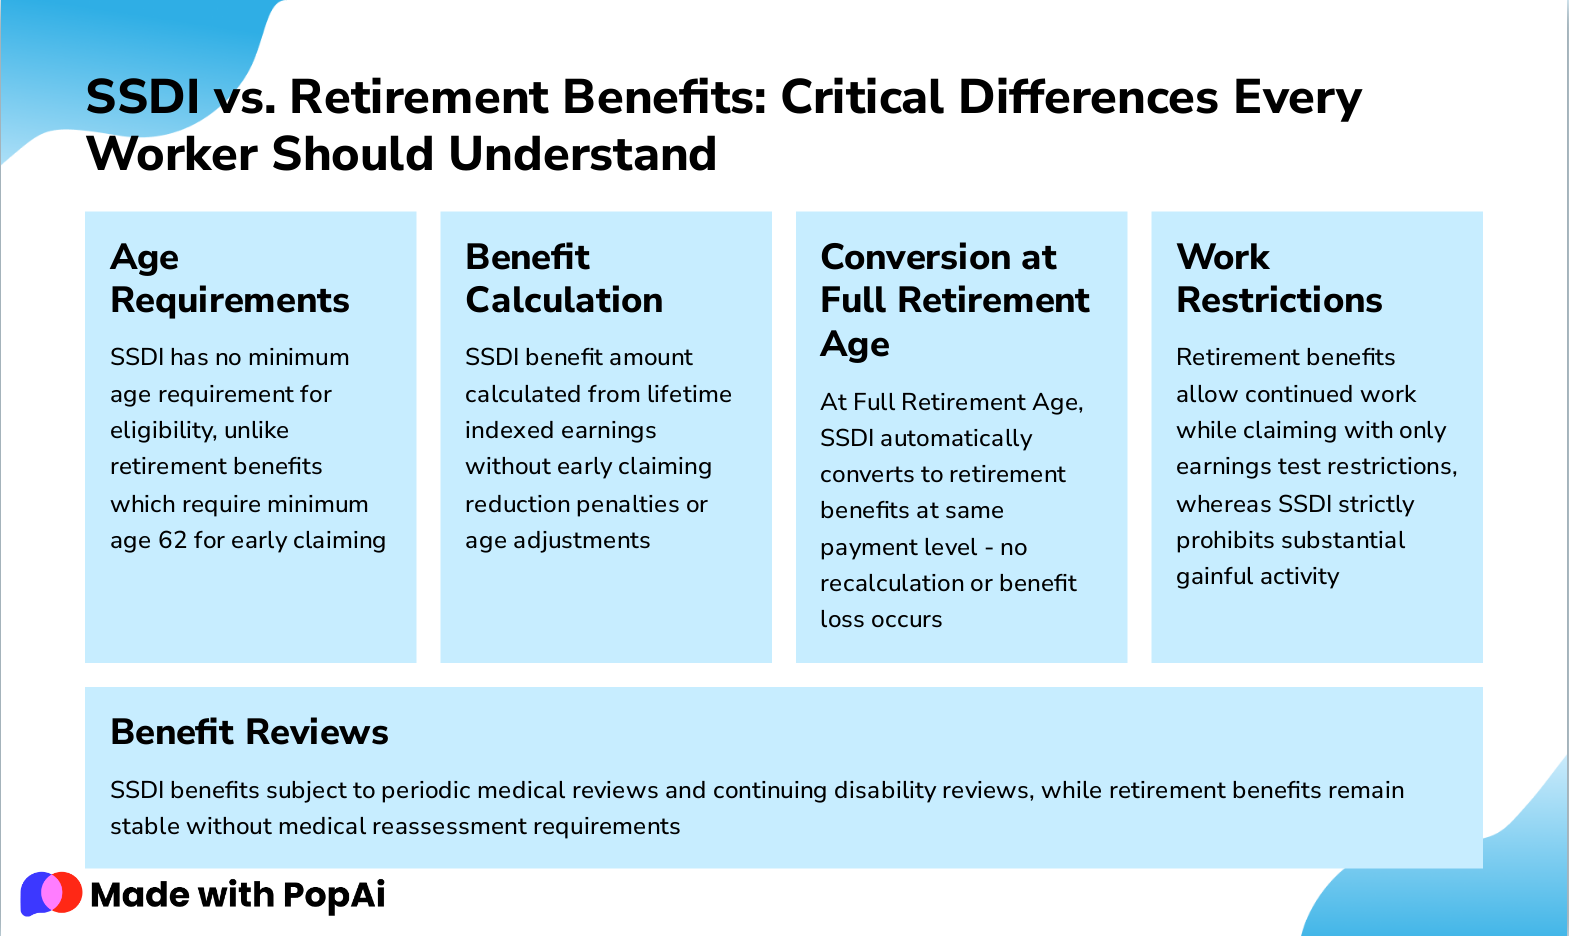
- Age Requirements: SSDI has no minimum age requirement for eligibility, unlike retirement benefits which require minimum age 62 for early claiming
- Benefit Calculation: SSDI benefit amount calculated from lifetime indexed earnings without early claiming reduction penalties or age adjustments
- Conversion at Full Retirement Age: At Full Retirement Age, SSDI automatically converts to retirement benefits at same payment level - no recalculation or benefit loss occurs
- Work Restrictions: Retirement benefits allow continued work while claiming with only earnings test restrictions, whereas SSDI strictly prohibits substantial gainful activity
- Benefit Reviews: SSDI benefits subject to periodic medical reviews and continuing disability reviews, while retirement benefits remain stable without medical reassessment requirements
Slide 11: Common Misconception: Is Social Security Sufficient as Your Sole Retirement Income?
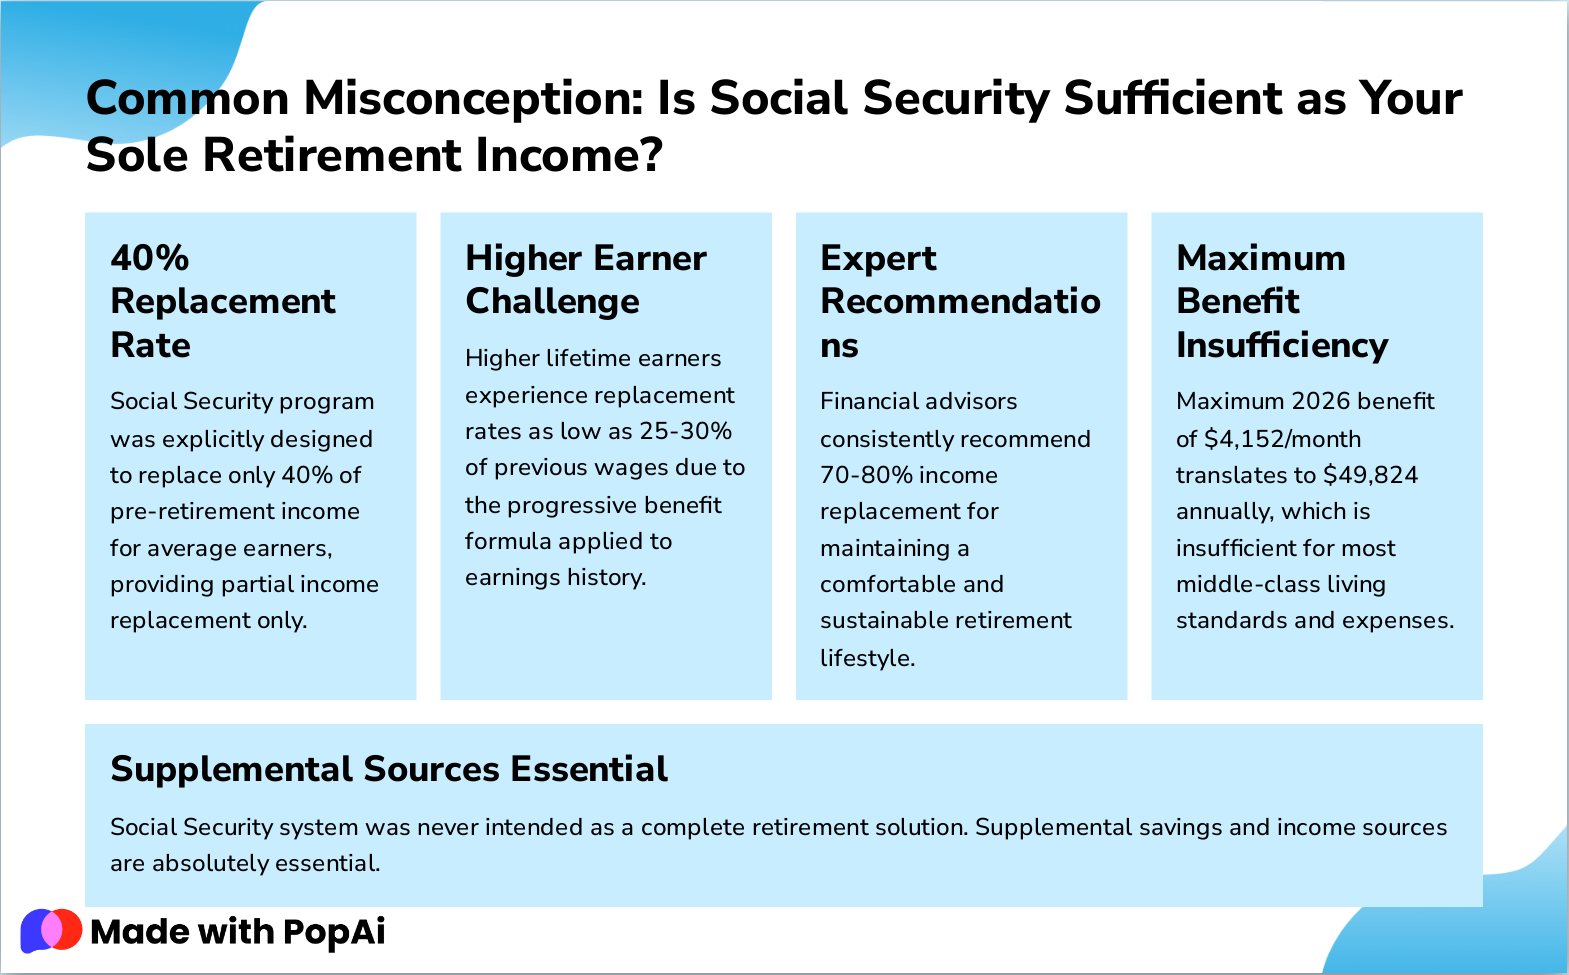
- 40% Replacement Rate: Social Security program was explicitly designed to replace only 40% of pre-retirement income for average earners, providing partial income replacement only.
- Higher Earner Challenge: Higher lifetime earners experience replacement rates as low as 25-30% of previous wages due to the progressive benefit formula applied to earnings history.
- Expert Recommendations: Financial advisors consistently recommend 70-80% income replacement for maintaining a comfortable and sustainable retirement lifestyle.
- Maximum Benefit Insufficiency: Maximum 2026 benefit of $4,152/month translates to $49,824 annually, which is insufficient for most middle-class living standards and expenses.
- Supplemental Sources Essential: Social Security system was never intended as a complete retirement solution. Supplemental savings and income sources are absolutely essential.
Slide 12: The Reality: Social Security Functions as Income Replacement Foundation, Not Complete Solution
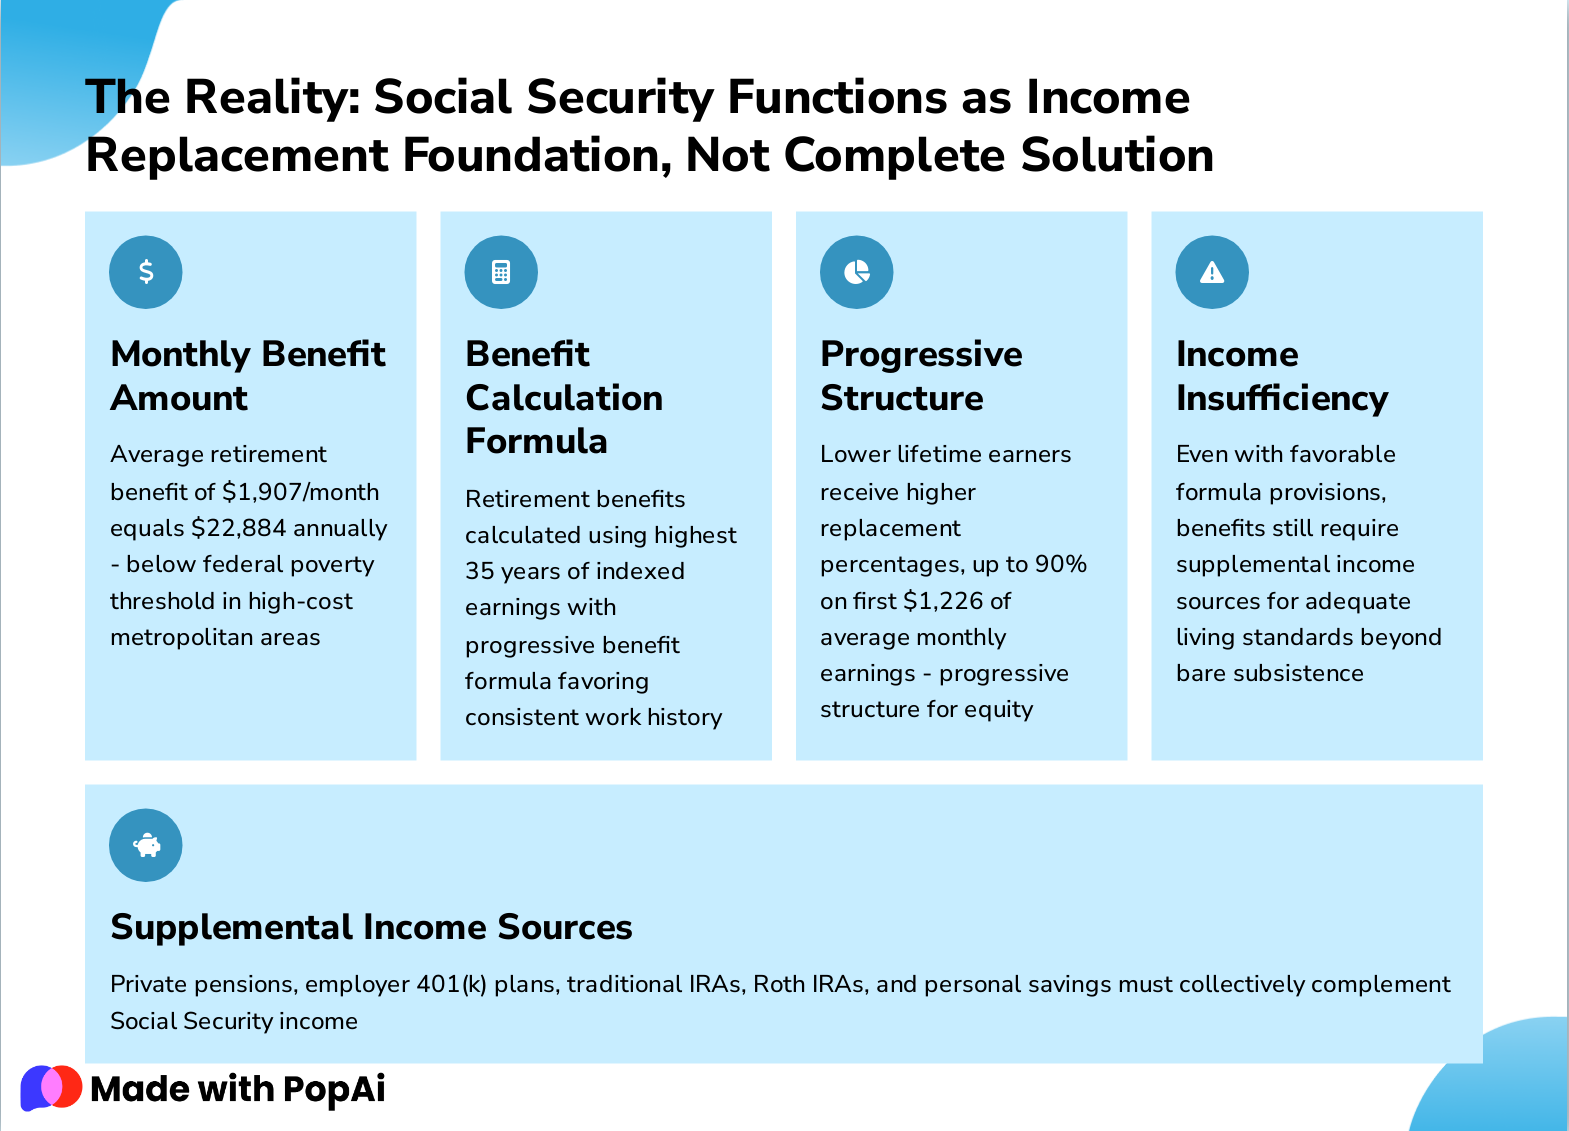
- Monthly Benefit Amount: Average retirement benefit of $1,907/month equals $22,884 annually - below federal poverty threshold in high-cost metropolitan areas
- Benefit Calculation Formula: Retirement benefits calculated using highest 35 years of indexed earnings with progressive benefit formula favoring consistent work history
- Progressive Structure: Lower lifetime earners receive higher replacement percentages, up to 90% on first $1,226 of average monthly earnings - progressive structure for equity
- Income Insufficiency: Even with favorable formula provisions, benefits still require supplemental income sources for adequate living standards beyond bare subsistence
- Supplemental Income Sources: Private pensions, employer 401(k) plans, traditional IRAs, Roth IRAs, and personal savings must collectively complement Social Security income
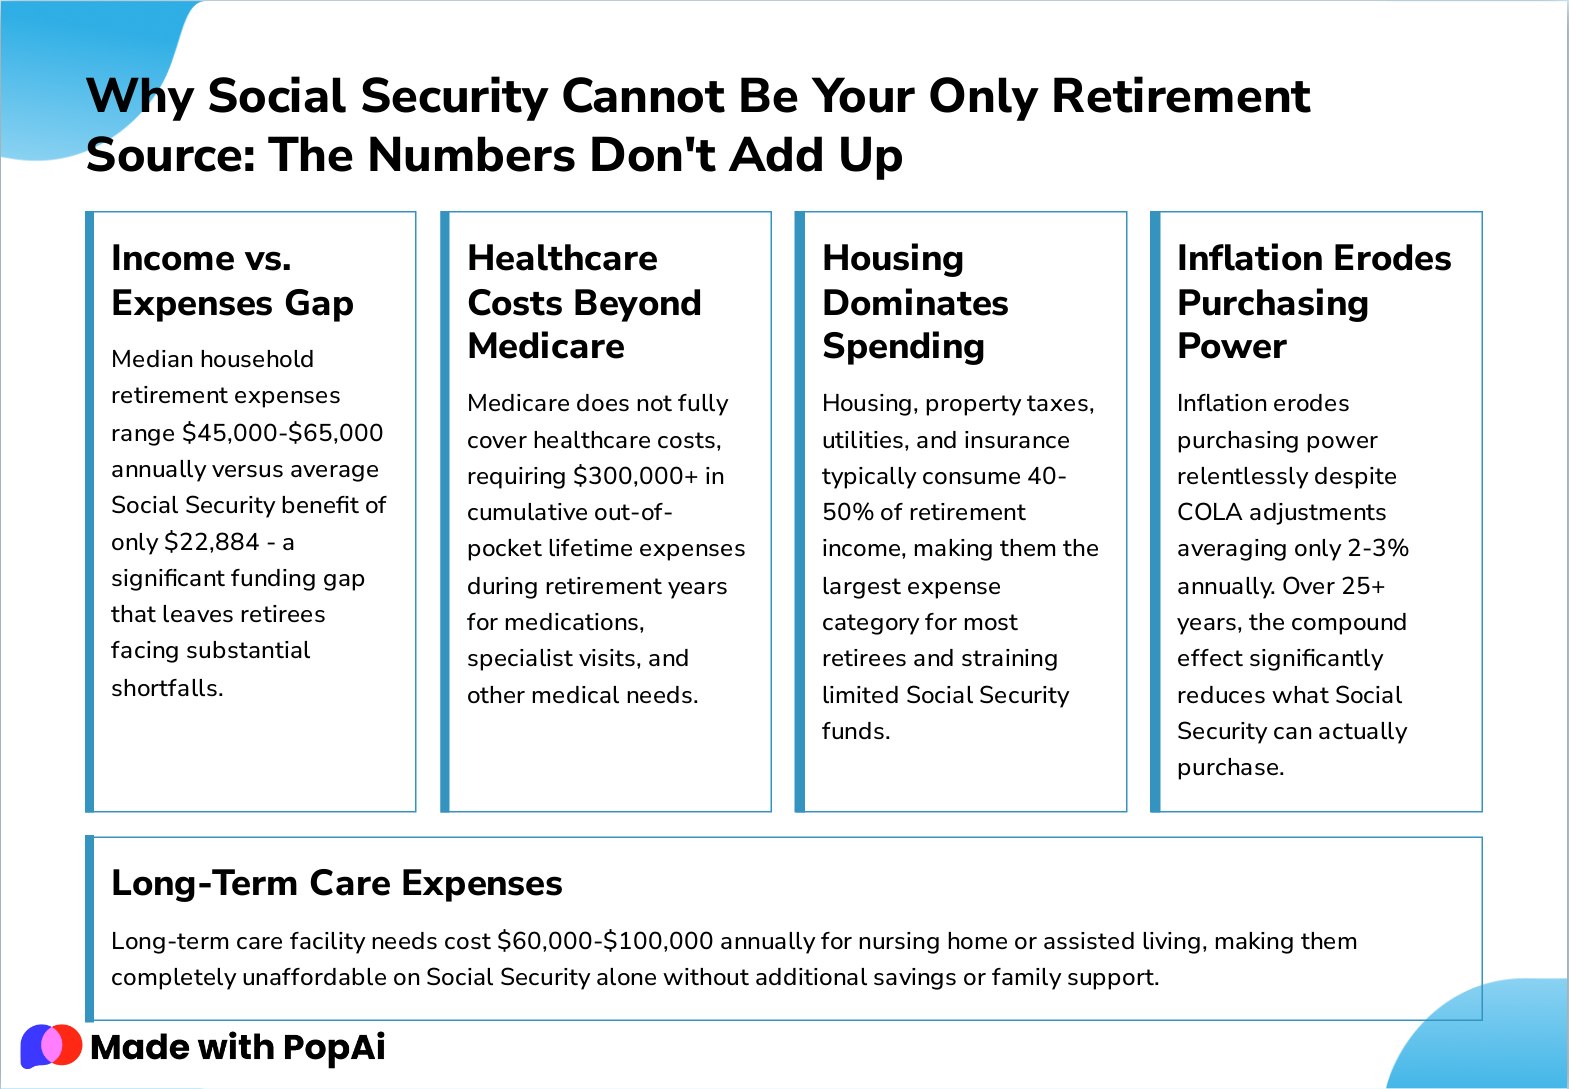
Slide 13: Why Social Security Cannot Be Your Only Retirement Source: The Numbers Don't Add Up
- Income vs. Expenses Gap: Median household retirement expenses range $45,000-$65,000 annually versus average Social Security benefit of only $22,884 - a significant funding gap that leaves retirees facing substantial shortfalls.
- Healthcare Costs Beyond Medicare: Medicare does not fully cover healthcare costs, requiring $300,000+ in cumulative out-of-pocket lifetime expenses during retirement years for medications, specialist visits, and other medical needs.
- Housing Dominates Spending: Housing, property taxes, utilities, and insurance typically consume 40-50% of retirement income, making them the largest expense category for most retirees and straining limited Social Security funds.
- Inflation Erodes Purchasing Power: Inflation erodes purchasing power relentlessly despite COLA adjustments averaging only 2-3% annually. Over 25+ years, the compound effect significantly reduces what Social Security can actually purchase.
- Long-Term Care Expenses: Long-term care facility needs cost $60,000-$100,000 annually for nursing home or assisted living, making them completely unaffordable on Social Security alone without additional savings or family support.
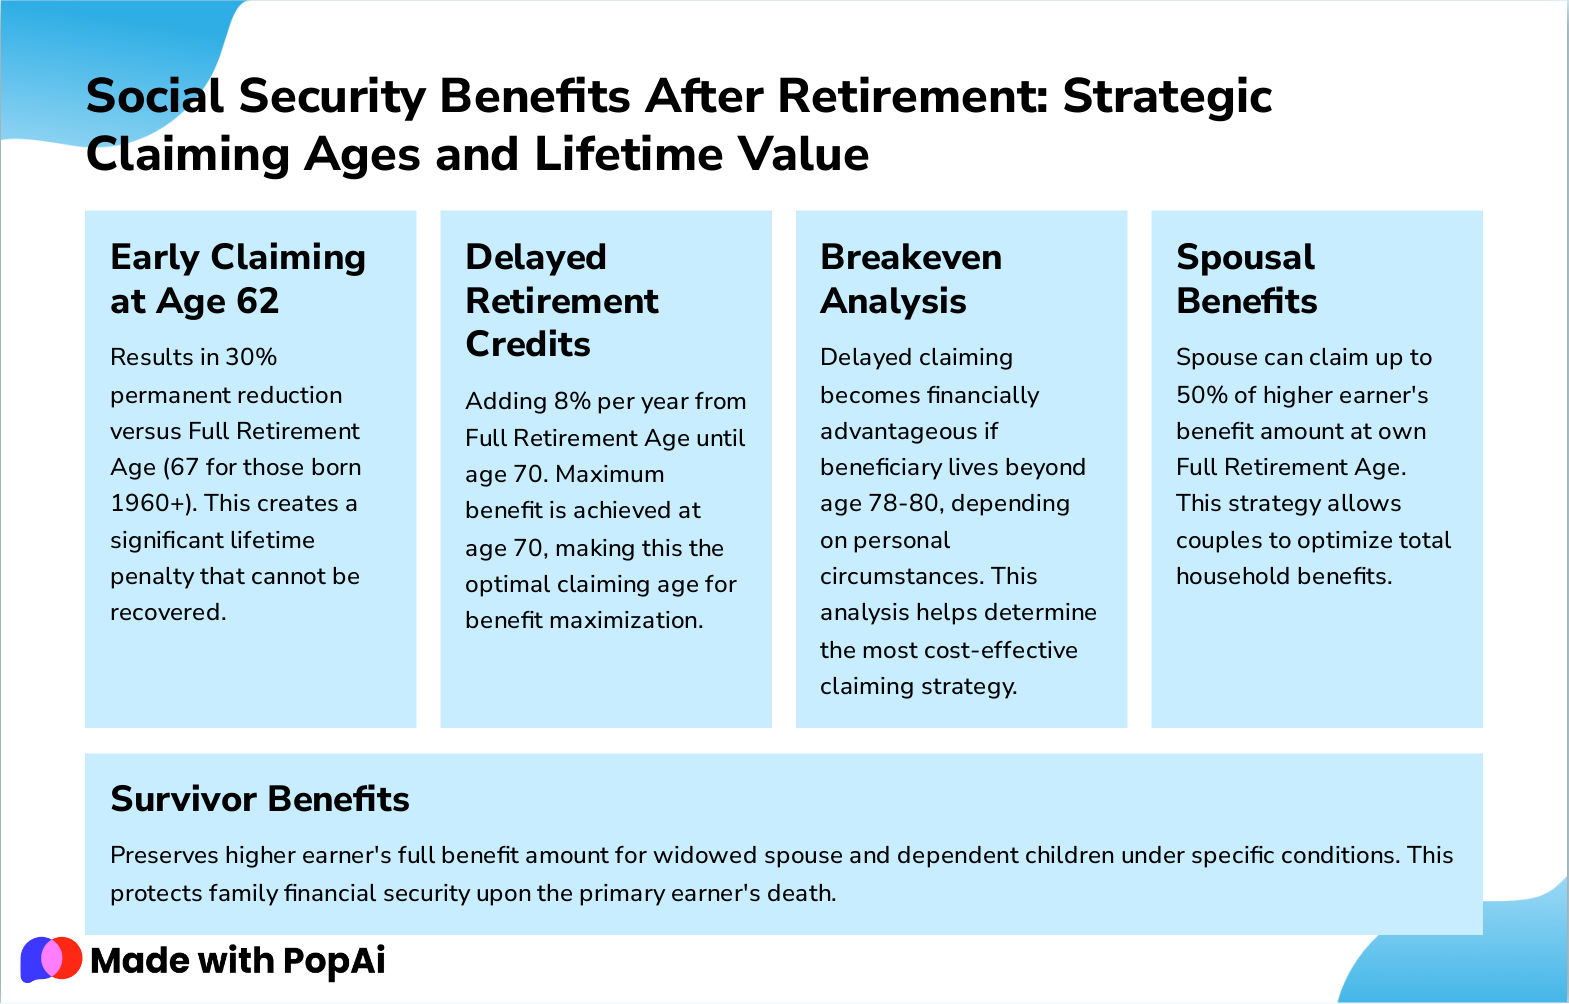
Slide 14: Social Security Benefits After Retirement: Strategic Claiming Ages and Lifetime Value
- Early Claiming at Age 62: Results in 30% permanent reduction versus Full Retirement Age (67 for those born 1960+). This creates a significant lifetime penalty that cannot be recovered.
- Delayed Retirement Credits: Adding 8% per year from Full Retirement Age until age 70. Maximum benefit is achieved at age 70, making this the optimal claiming age for benefit maximization.
- Breakeven Analysis: Delayed claiming becomes financially advantageous if beneficiary lives beyond age 78-80, depending on personal circumstances. This analysis helps determine the most cost-effective claiming strategy.
- Spousal Benefits: Spouse can claim up to 50% of higher earner's benefit amount at own Full Retirement Age. This strategy allows couples to optimize total household benefits.
- Survivor Benefits: Preserves higher earner's full benefit amount for widowed spouse and dependent children under specific conditions. This protects family financial security upon the primary earner's death.
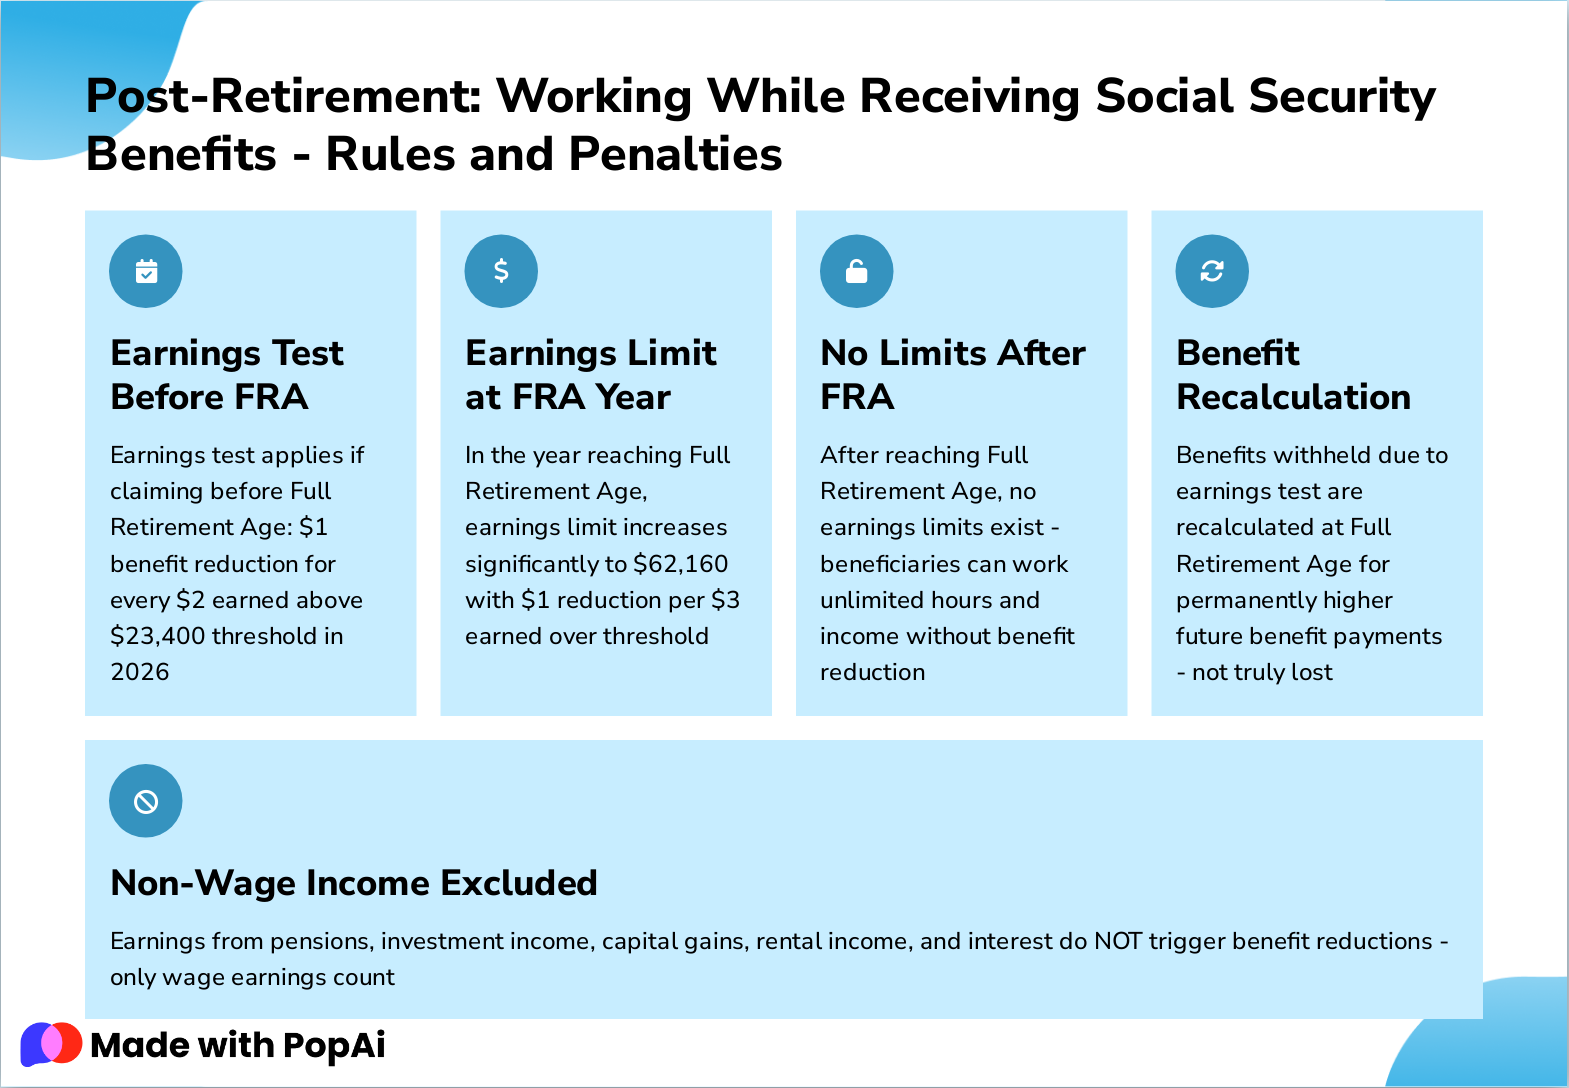
Slide 15: Post-Retirement: Working While Receiving Social Security Benefits - Rules and Penalties
- Earnings Test Before FRA: Earnings test applies if claiming before Full Retirement Age: $1 benefit reduction for every $2 earned above $23,400 threshold in 2026
- Earnings Limit at FRA Year: In the year reaching Full Retirement Age, earnings limit increases significantly to $62,160 with $1 reduction per $3 earned over threshold
- No Limits After FRA: After reaching Full Retirement Age, no earnings limits exist - beneficiaries can work unlimited hours and income without benefit reduction
- Benefit Recalculation: Benefits withheld due to earnings test are recalculated at Full Retirement Age for permanently higher future benefit payments - not truly lost
- Non-Wage Income Excluded: Earnings from pensions, investment income, capital gains, rental income, and interest do NOT trigger benefit reductions - only wage earnings count
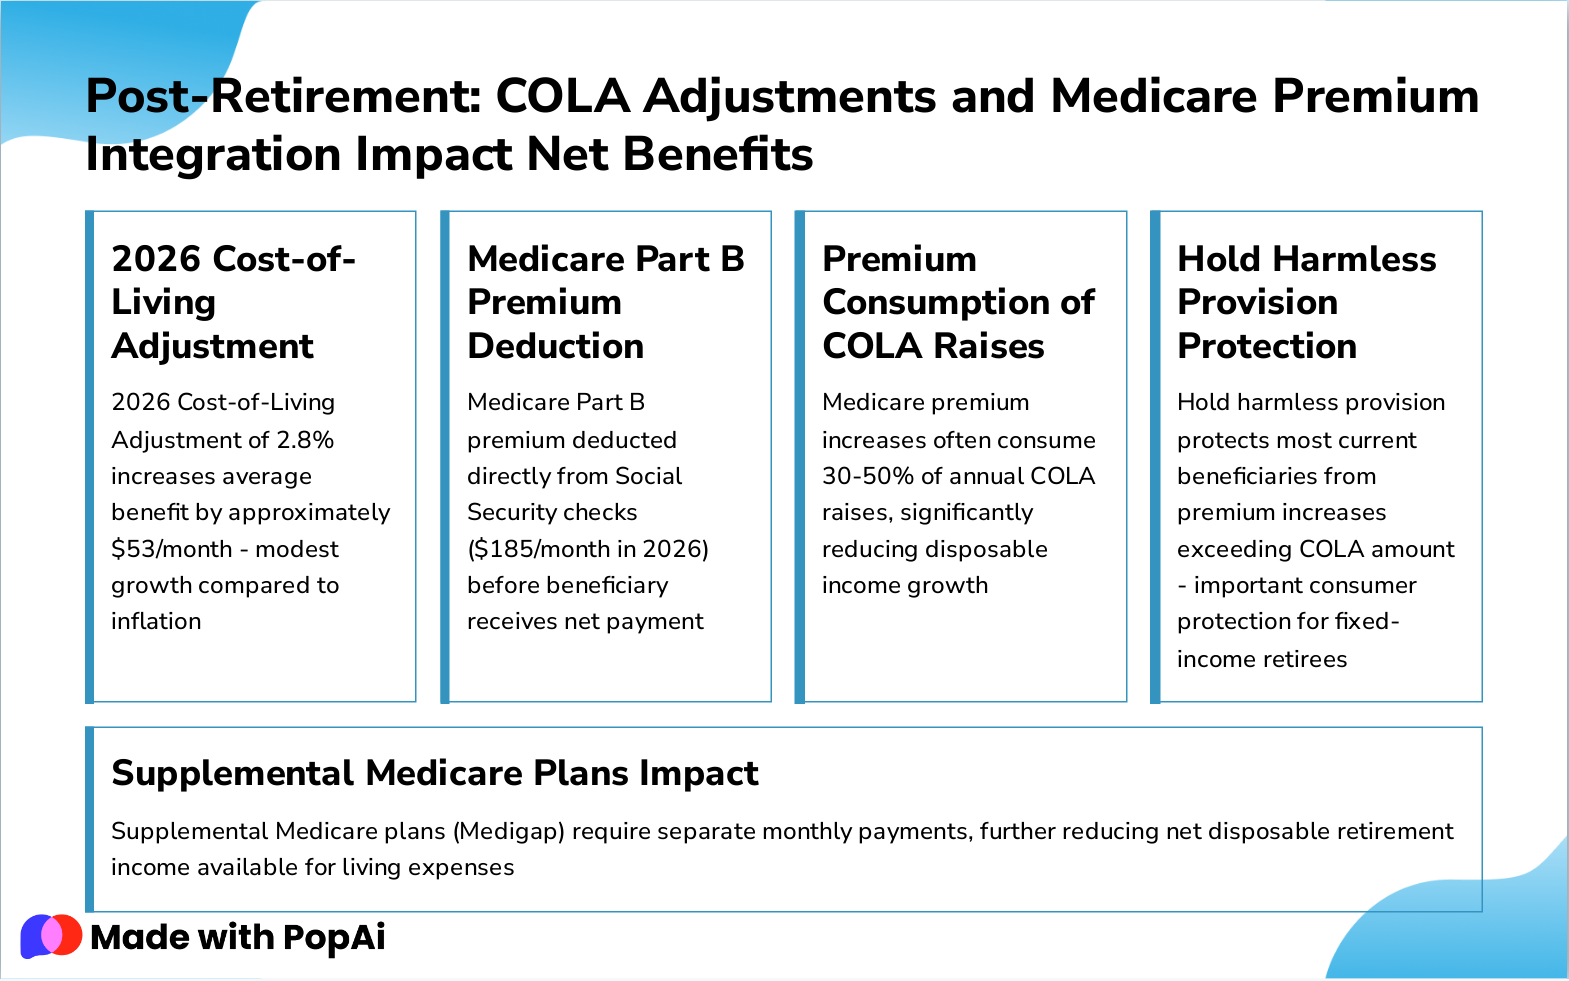
Slide 16: Post-Retirement: COLA Adjustments and Medicare Premium Integration Impact Net Benefits
- 2026 Cost-of-Living Adjustment: 2026 Cost-of-Living Adjustment of 2.8% increases average benefit by approximately $53/month - modest growth compared to inflation
- Medicare Part B Premium Deduction: Medicare Part B premium deducted directly from Social Security checks ($185/month in 2026) before beneficiary receives net payment
- Premium Consumption of COLA Raises: Medicare premium increases often consume 30-50% of annual COLA raises, significantly reducing disposable income growth
- Hold Harmless Provision Protection: Hold harmless provision protects most current beneficiaries from premium increases exceeding COLA amount - important consumer protection for fixed-income retirees
- Supplemental Medicare Plans Impact: Supplemental Medicare plans (Medigap) require separate monthly payments, further reducing net disposable retirement income available for living expenses
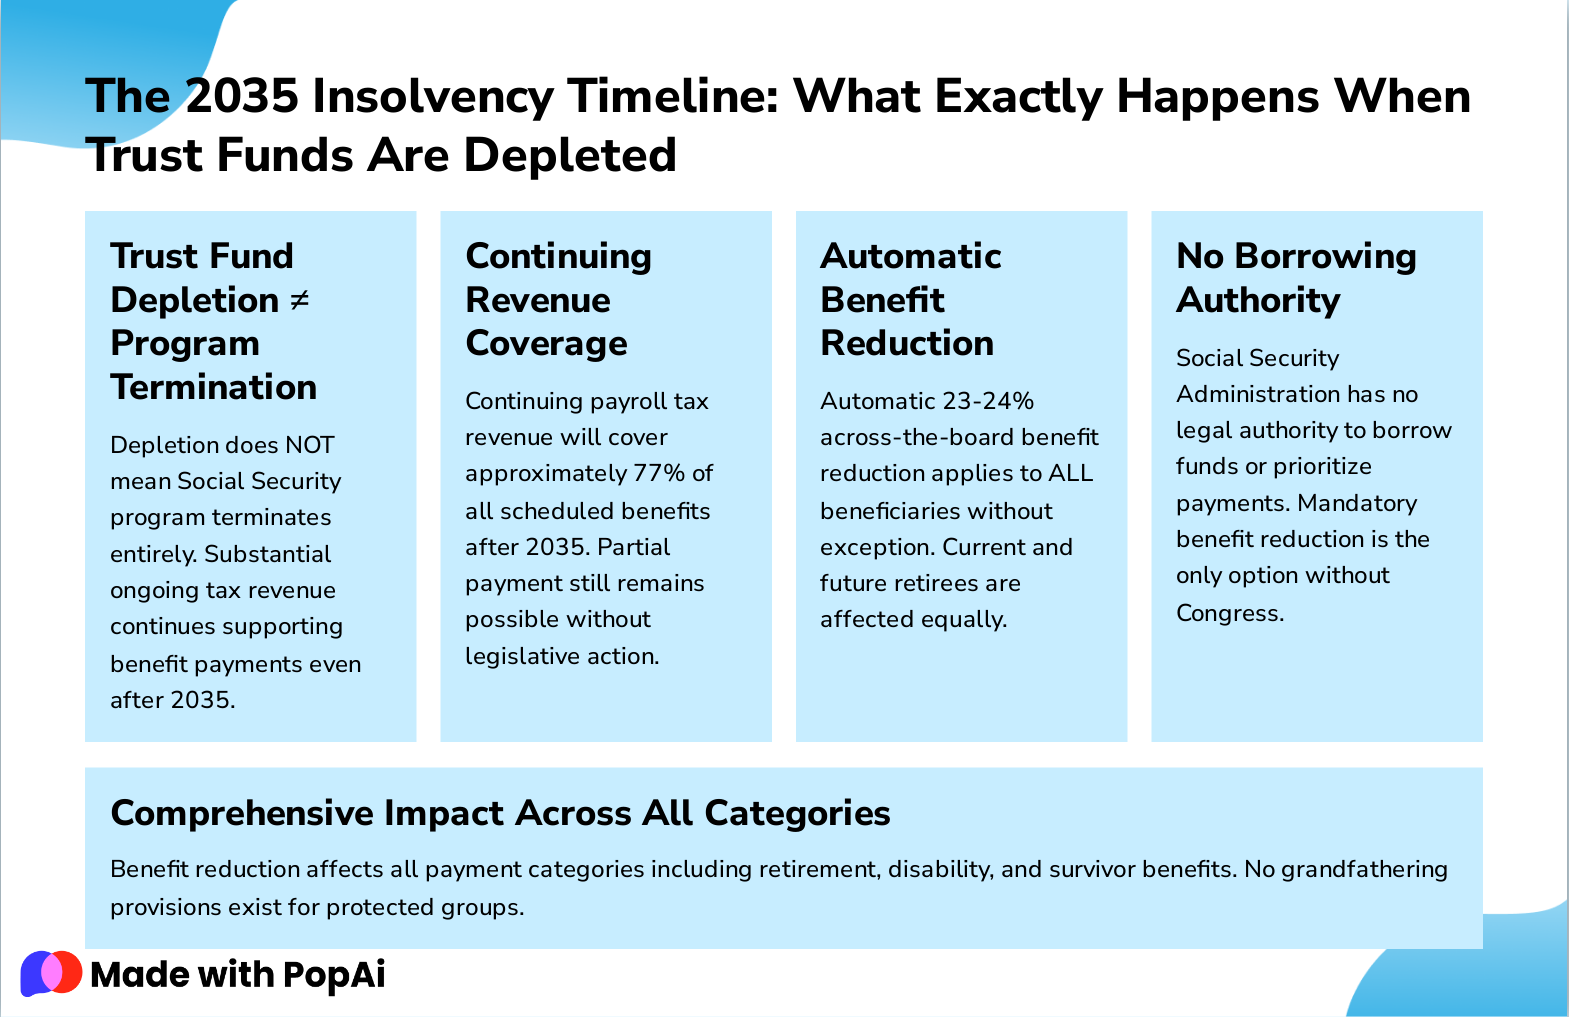
Slide 17: The 2035 Insolvency Timeline: What Exactly Happens When Trust Funds Are Depleted
- Trust Fund Depletion ≠ Program Termination: Depletion does NOT mean Social Security program terminates entirely. Substantial ongoing tax revenue continues supporting benefit payments even after 2035.
- Continuing Revenue Coverage: Continuing payroll tax revenue will cover approximately 77% of all scheduled benefits after 2035. Partial payment still remains possible without legislative action.
- Automatic Benefit Reduction: Automatic 23-24% across-the-board benefit reduction applies to ALL beneficiaries without exception. Current and future retirees are affected equally.
- No Borrowing Authority: Social Security Administration has no legal authority to borrow funds or prioritize payments. Mandatory benefit reduction is the only option without Congress.
- Comprehensive Impact Across All Categories: Benefit reduction affects all payment categories including retirement, disability, and survivor benefits. No grandfathering provisions exist for protected groups.
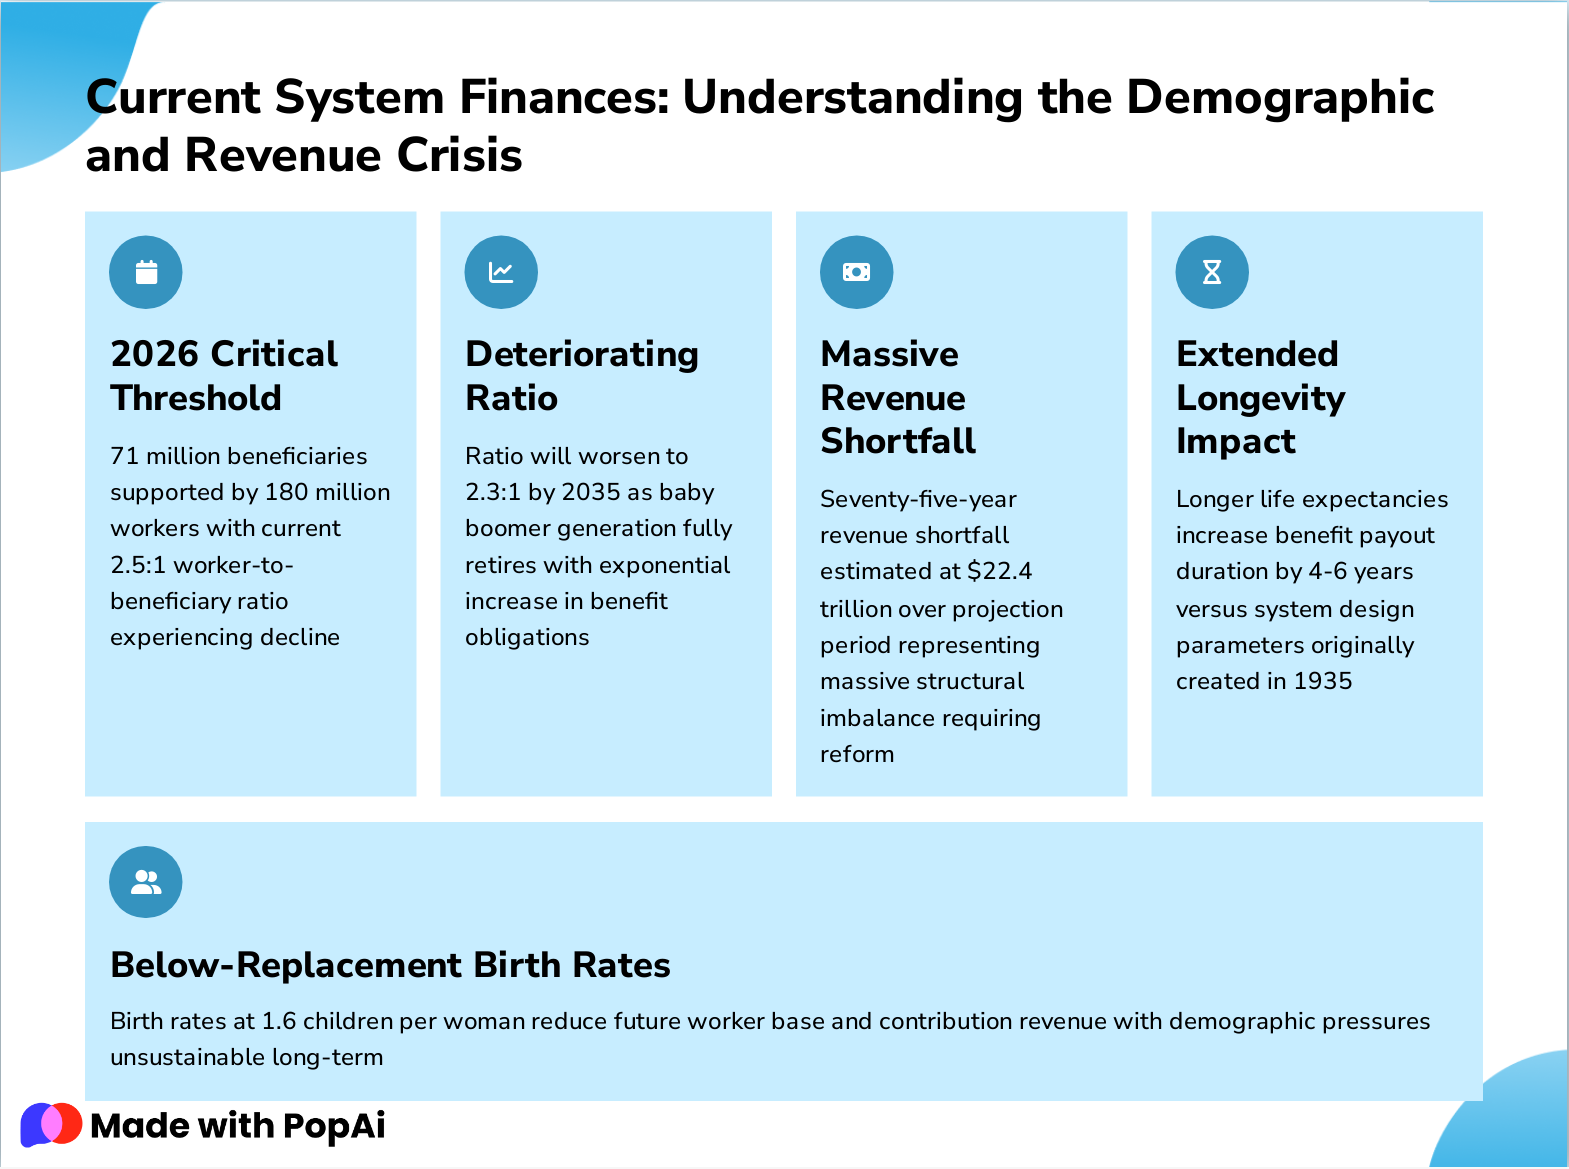
Slide 18: Current System Finances: Understanding the Demographic and Revenue Crisis
- 2026 Critical Threshold: 71 million beneficiaries supported by 180 million workers with current 2.5:1 worker-to-beneficiary ratio experiencing decline
- Deteriorating Ratio: Ratio will worsen to 2.3:1 by 2035 as baby boomer generation fully retires with exponential increase in benefit obligations
- Massive Revenue Shortfall: Seventy-five-year revenue shortfall estimated at $22.4 trillion over projection period representing massive structural imbalance requiring reform
- Extended Longevity Impact: Longer life expectancies increase benefit payout duration by 4-6 years versus system design parameters originally created in 1935
- Below-Replacement Birth Rates: Birth rates at 1.6 children per woman reduce future worker base and contribution revenue with demographic pressures unsustainable long-term
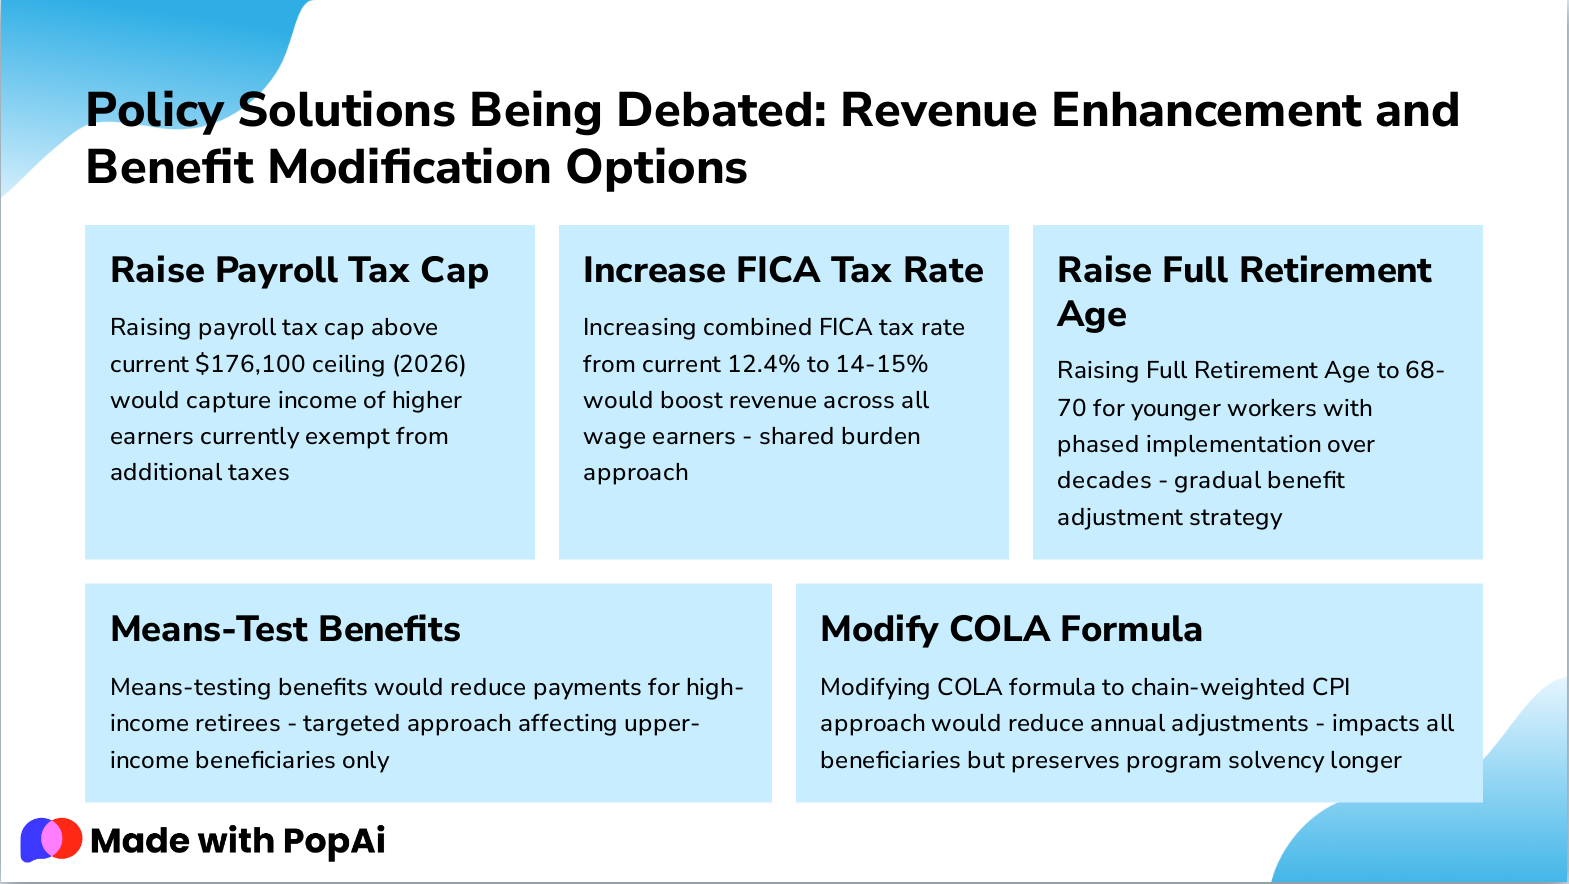
Slide 19: Policy Solutions Being Debated: Revenue Enhancement and Benefit Modification Options
- Raise Payroll Tax Cap: Raising payroll tax cap above current $176,100 ceiling (2026) would capture income of higher earners currently exempt from additional taxes
- Increase FICA Tax Rate: Increasing combined FICA tax rate from current 12.4% to 14-15% would boost revenue across all wage earners - shared burden approach
- Raise Full Retirement Age: Raising Full Retirement Age to 68-70 for younger workers with phased implementation over decades - gradual benefit adjustment strategy
- Means-Test Benefits: Means-testing benefits would reduce payments for high-income retirees - targeted approach affecting upper-income beneficiaries only
- Modify COLA Formula: Modifying COLA formula to chain-weighted CPI approach would reduce annual adjustments - impacts all beneficiaries but preserves program solvency longer
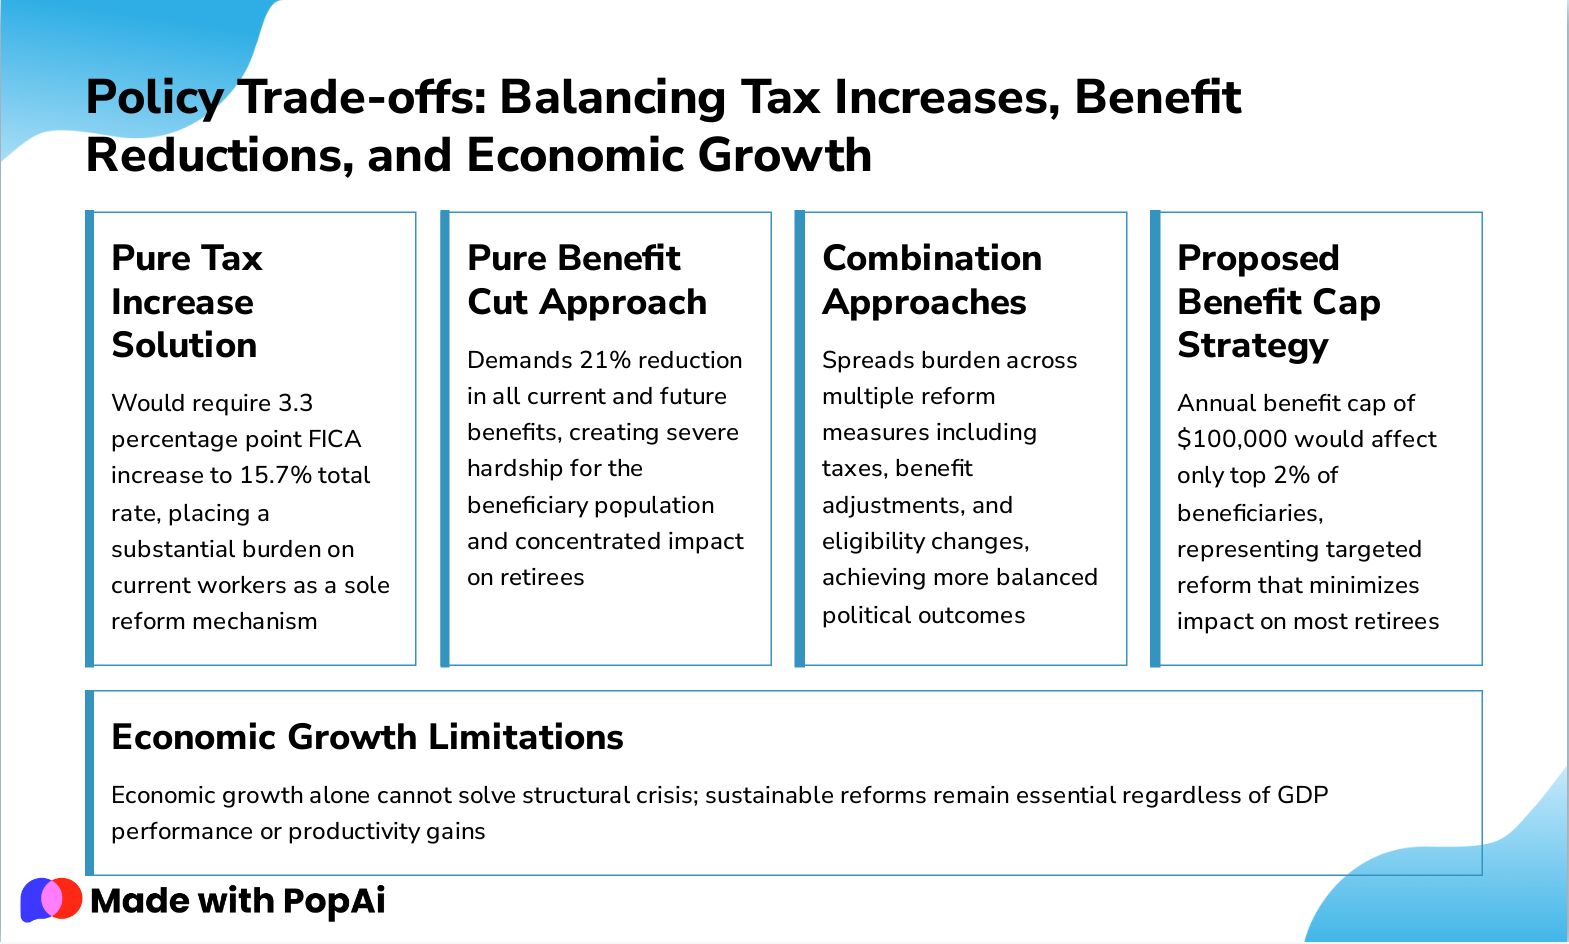
Slide 20: Policy Trade-offs: Balancing Tax Increases, Benefit Reductions, and Economic Growth
- Pure Tax Increase Solution: Would require 3.3 percentage point FICA increase to 15.7% total rate, placing a substantial burden on current workers as a sole reform mechanism
- Pure Benefit Cut Approach: Demands 21% reduction in all current and future benefits, creating severe hardship for the beneficiary population and concentrated impact on retirees
- Combination Approaches: Spreads burden across multiple reform measures including taxes, benefit adjustments, and eligibility changes, achieving more balanced political outcomes
- Proposed Benefit Cap Strategy: Annual benefit cap of $100,000 would affect only top 2% of beneficiaries, representing targeted reform that minimizes impact on most retirees
- Economic Growth Limitations: Economic growth alone cannot solve structural crisis; sustainable reforms remain essential regardless of GDP performance or productivity gains
Slide 21: Individual Planning Strategy #1: Preparing Your Portfolio for Potential 23% Benefit Cut
- Stress-Test Your Budget: Assume a 25% Social Security reduction starting 2035 and model the worst-case scenario for contingency planning to protect your financial future.
- Build Emergency Reserves: Cover 12-24 months of living expenses beyond standard savings to create a liquidity cushion that provides flexibility and security.
- Delay Social Security Claiming: Claim at age 70 if health and financial circumstances permit, maximizing your lifetime benefit amount despite insolvency risk.
- Increase Retirement Contributions: Boost 401(k) and IRA contributions by a minimum 5% of annual income to compensate for anticipated Social Security uncertainty ahead.
- Consider Part-Time Work: Work part-time during early retirement years to preserve savings accounts and delay Social Security claiming, extending portfolio longevity significantly.
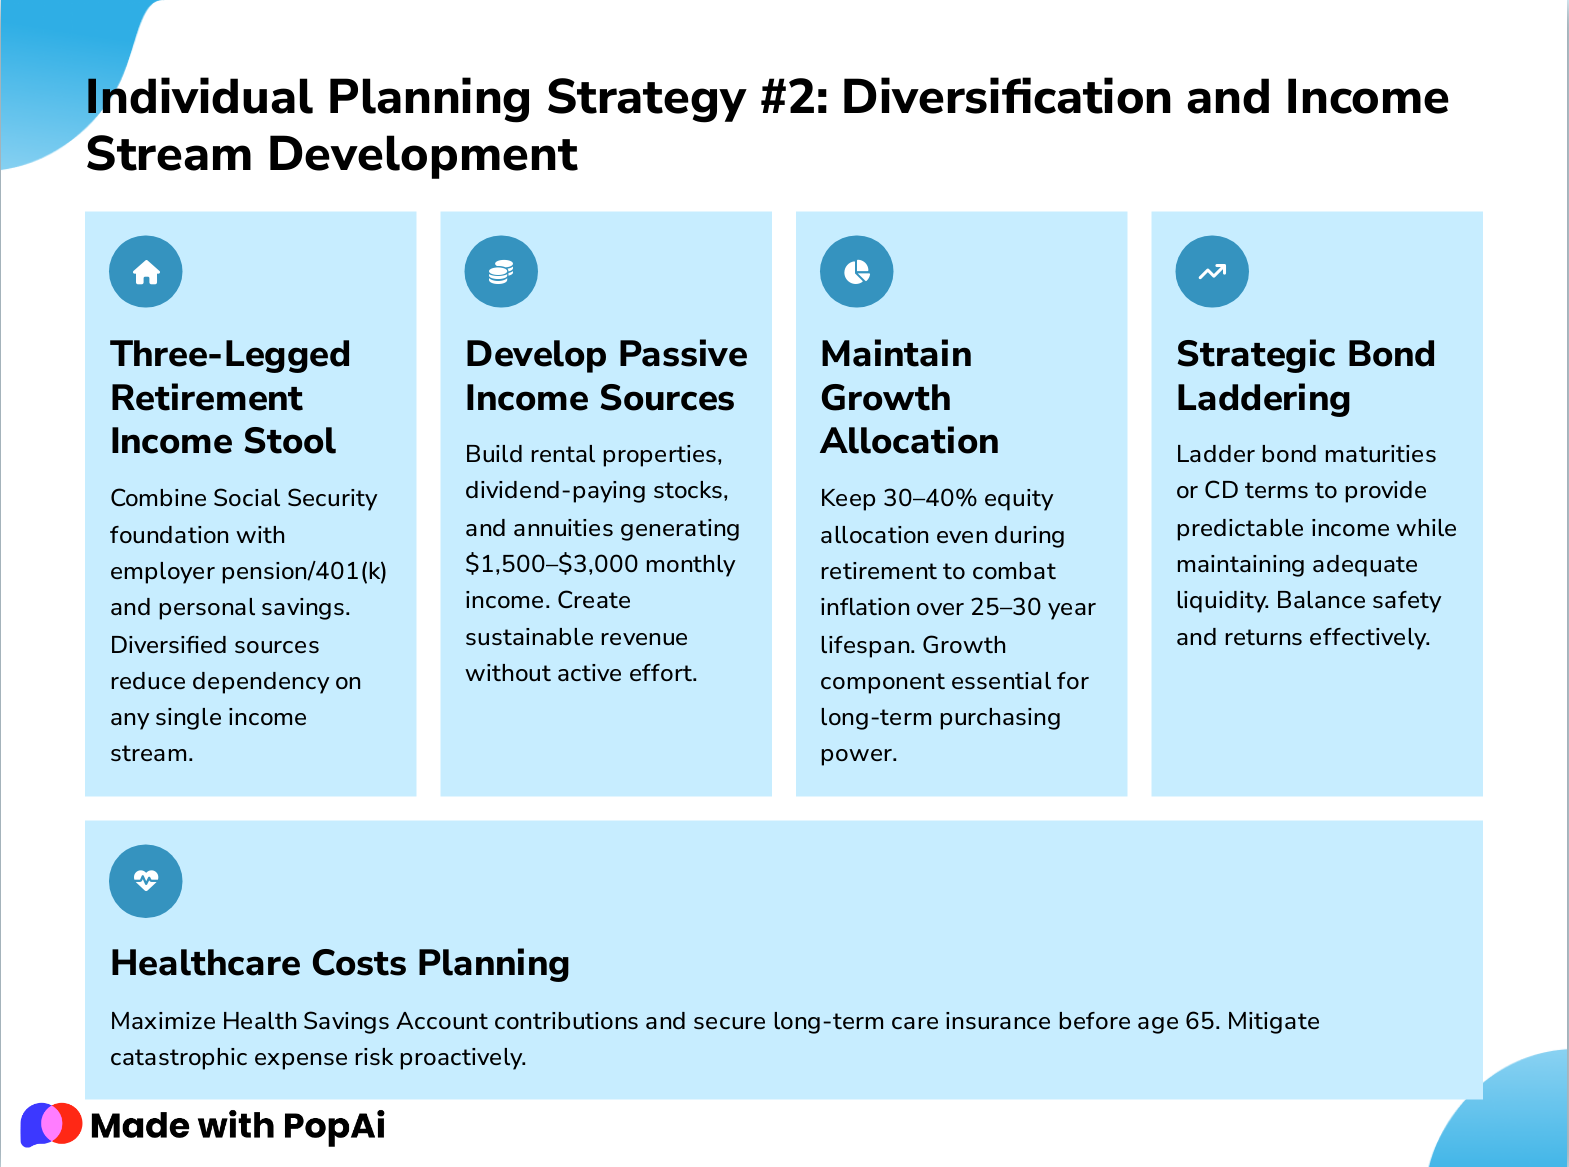
Slide 22: Individual Planning Strategy #2: Diversification and Income Stream Development
- Three-Legged Retirement Income Stool: Combine Social Security foundation with employer pension/401(k) and personal savings. Diversified sources reduce dependency on any single income stream.
- Develop Passive Income Sources: Build rental properties, dividend-paying stocks, and annuities generating $1,500–$3,000 monthly income. Create sustainable revenue without active effort.
- Maintain Growth Allocation: Keep 30–40% equity allocation even during retirement to combat inflation over 25–30 year lifespan. Growth component essential for long-term purchasing power.
- Strategic Bond Laddering: Ladder bond maturities or CD terms to provide predictable income while maintaining adequate liquidity. Balance safety and returns effectively.
- Healthcare Costs Planning: Maximize Health Savings Account contributions and secure long-term care insurance before age 65. Mitigate catastrophic expense risk proactively.
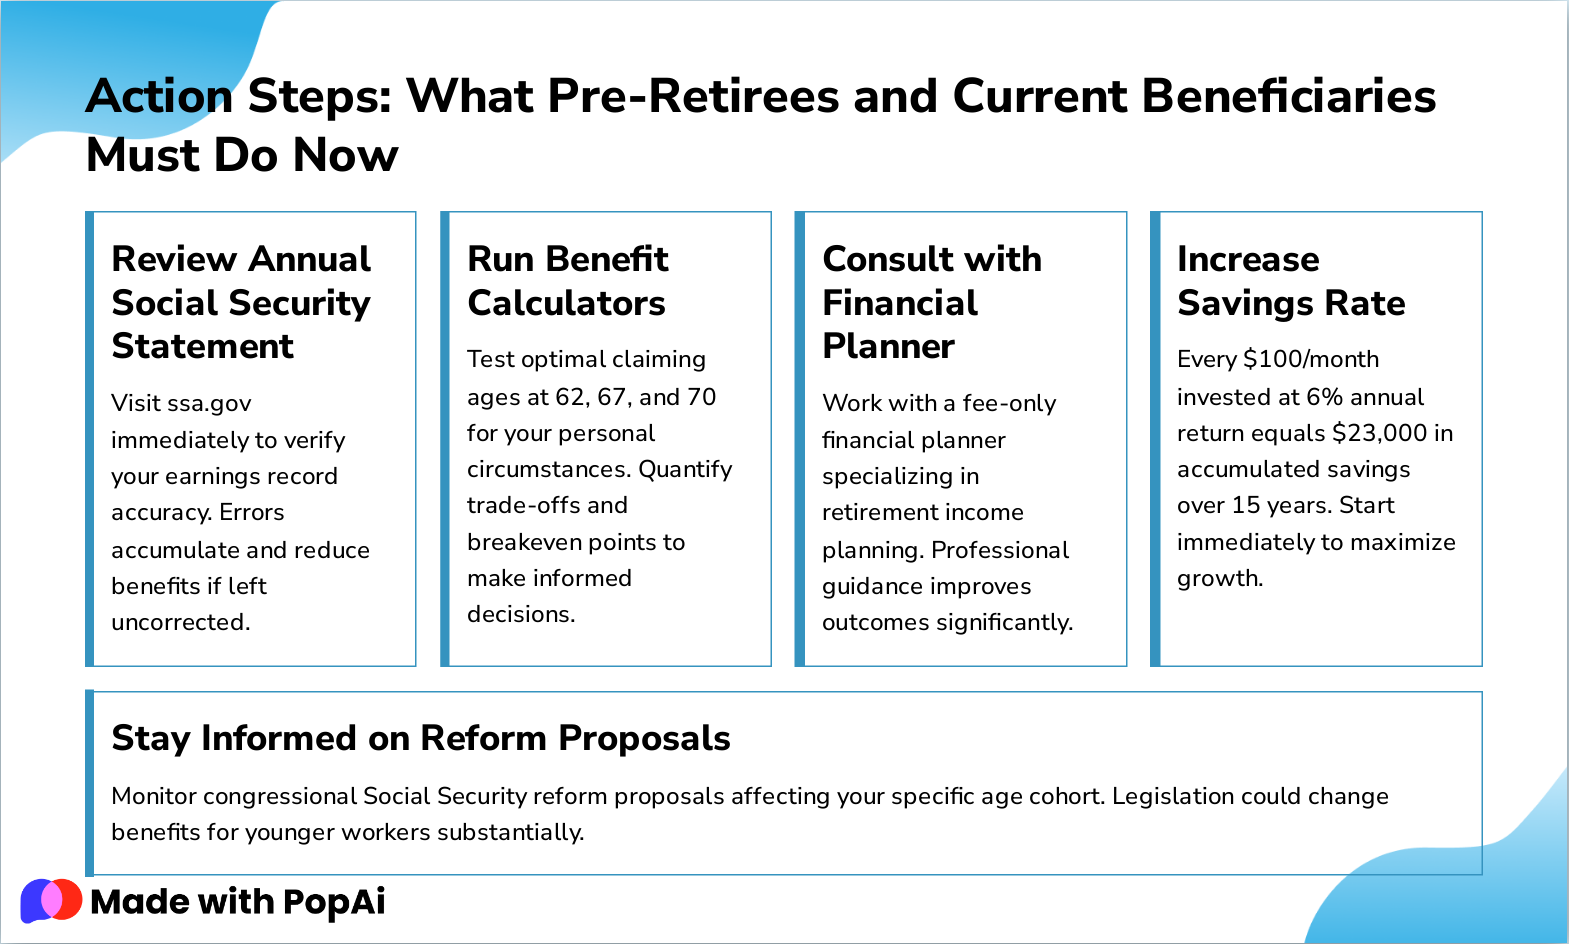
Slide 23: Action Steps: What Pre-Retirees and Current Beneficiaries Must Do Now
- Review Annual Social Security Statement: Visit ssa.gov immediately to verify your earnings record accuracy. Errors accumulate and reduce benefits if left uncorrected.
- Run Benefit Calculators: Test optimal claiming ages at 62, 67, and 70 for your personal circumstances. Quantify trade-offs and breakeven points to make informed decisions.
- Consult with Financial Planner: Work with a fee-only financial planner specializing in retirement income planning. Professional guidance improves outcomes significantly.
- Increase Savings Rate: Every $100/month invested at 6% annual return equals $23,000 in accumulated savings over 15 years. Start immediately to maximize growth.
- Stay Informed on Reform Proposals: Monitor congressional Social Security reform proposals affecting your specific age cohort. Legislation could change benefits for younger workers substantially.
Slide 24: Key Takeaways: Transforming Crisis Into Opportunity
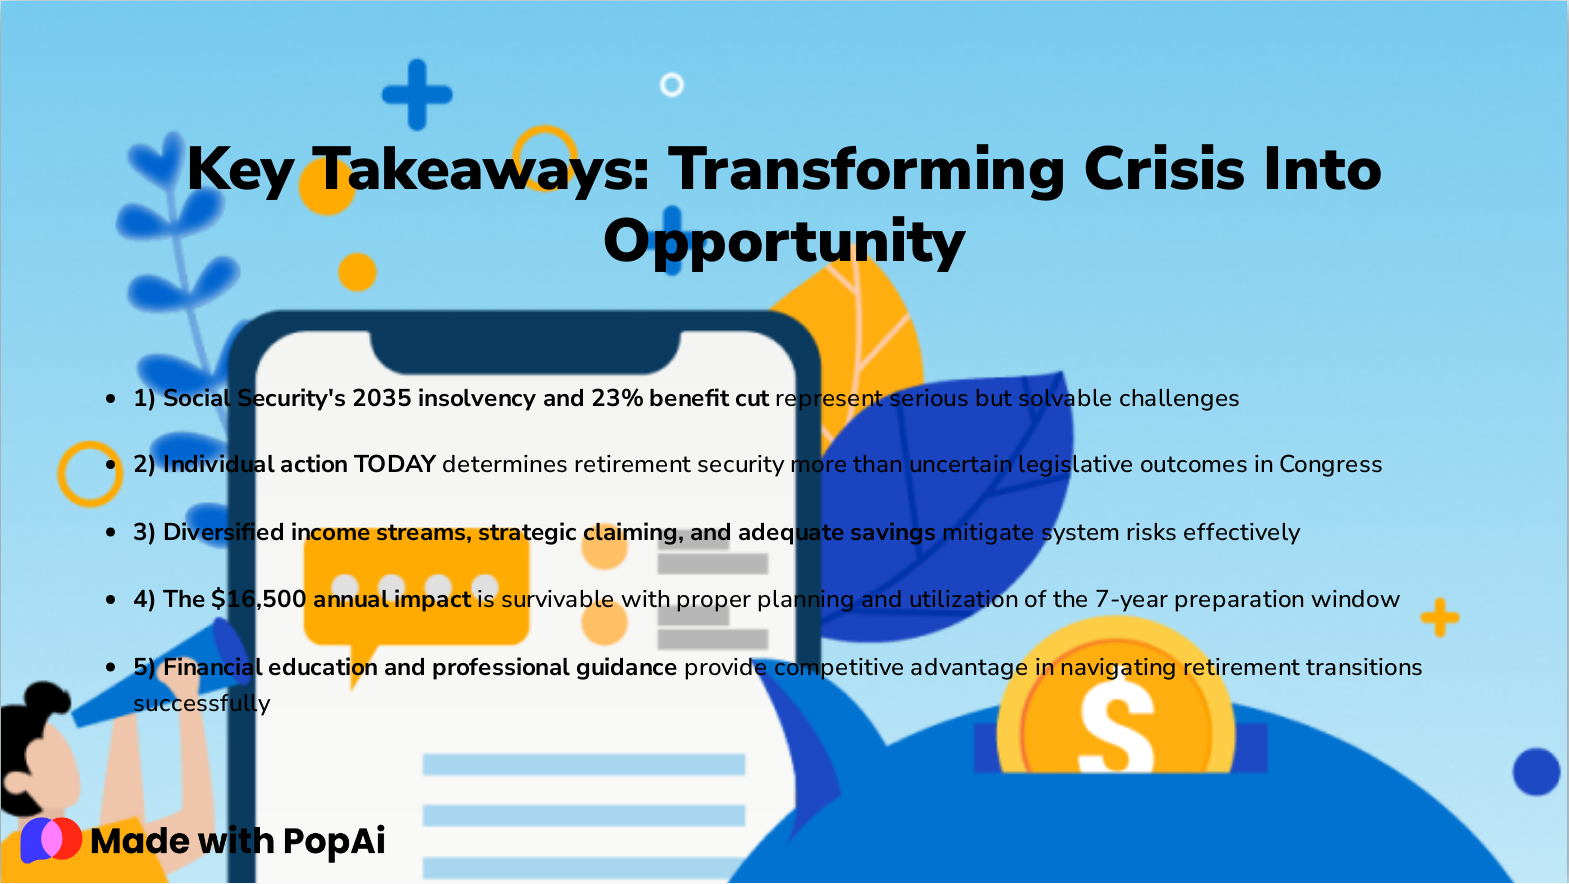
1) Social Security's 2035 insolvency and 23% benefit cut represent serious but solvable challenges
2) Individual action TODAY determines retirement security more than uncertain legislative outcomes in Congress
3) Diversified income streams, strategic claiming, and adequate savings mitigate system risks effectively
4) The $16,500 annual impact is survivable with proper planning and utilization of the 7-year preparation window
5) Financial education and professional guidance provide competitive advantage in navigating retirement transitions successfully
- 1) Social Security's 2035 insolvency and 23% benefit cut represent serious but solvable challenges
- 2) Individual action TODAY determines retirement security more than uncertain legislative outcomes in Congress
- 3) Diversified income streams, strategic claiming, and adequate savings mitigate system risks effectively
- 4) The $16,500 annual impact is survivable with proper planning and utilization of the 7-year preparation window
- 5) Financial education and professional guidance provide competitive advantage in navigating retirement transitions successfully