
Presentation Summary
Discover the global EV market transformation from 2025-2026, including market inflection points, technology innovation, environmental imperatives, and regional market dynamics.
Full Presentation Transcript
Slide 1: The Electric Vehicle Revolution: From Adoption to Mainstream Dominance
Comprehensive Analysis of Global EV Market Transformation in 2025-2026
Slide 2: Contents
- Global EV Market Inflection Point (2025-2026): Key dynamics shaping the electric vehicle market during this critical period.
- Technology Innovation & Environmental Imperative: Advancing technologies and environmental drivers for EV adoption.
- Singapore: Regulatory Excellence & Market Leadership: Singapore's strategic approach to EV market development and regulation.
- India: Scale Challenges & Premium Market Shift: India's path through market scaling challenges and premium segment evolution.
- Infrastructure, Services & Consumer Adoption Mechanics: Critical infrastructure and service factors enabling widespread consumer adoption.
Slide 3: Global EV Market Crossed Inflection Point: From Niche to Mainstream in 2025
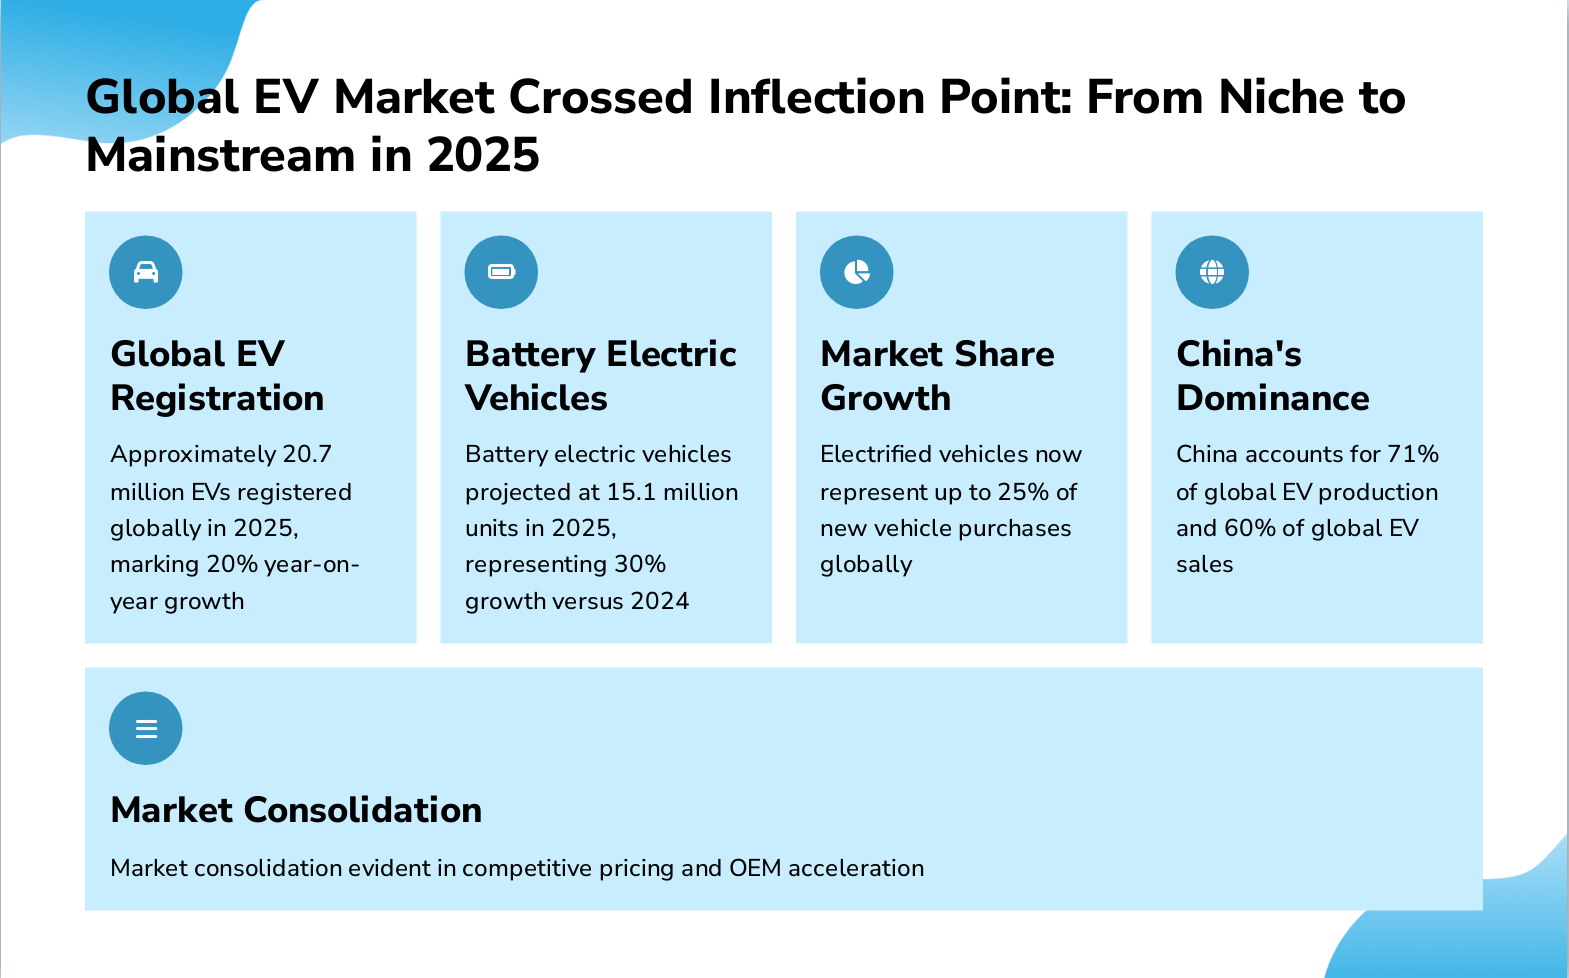
- Global EV Registration: Approximately 20.7 million EVs registered globally in 2025, marking 20% year-on-year growth
- Battery Electric Vehicles: Battery electric vehicles projected at 15.1 million units in 2025, representing 30% growth versus 2024
- Market Share Growth: Electrified vehicles now represent up to 25% of new vehicle purchases globally
- China's Dominance: China accounts for 71% of global EV production and 60% of global EV sales
- Market Consolidation: Market consolidation evident in competitive pricing and OEM acceleration
Slide 4: BYD's Global EV Leadership
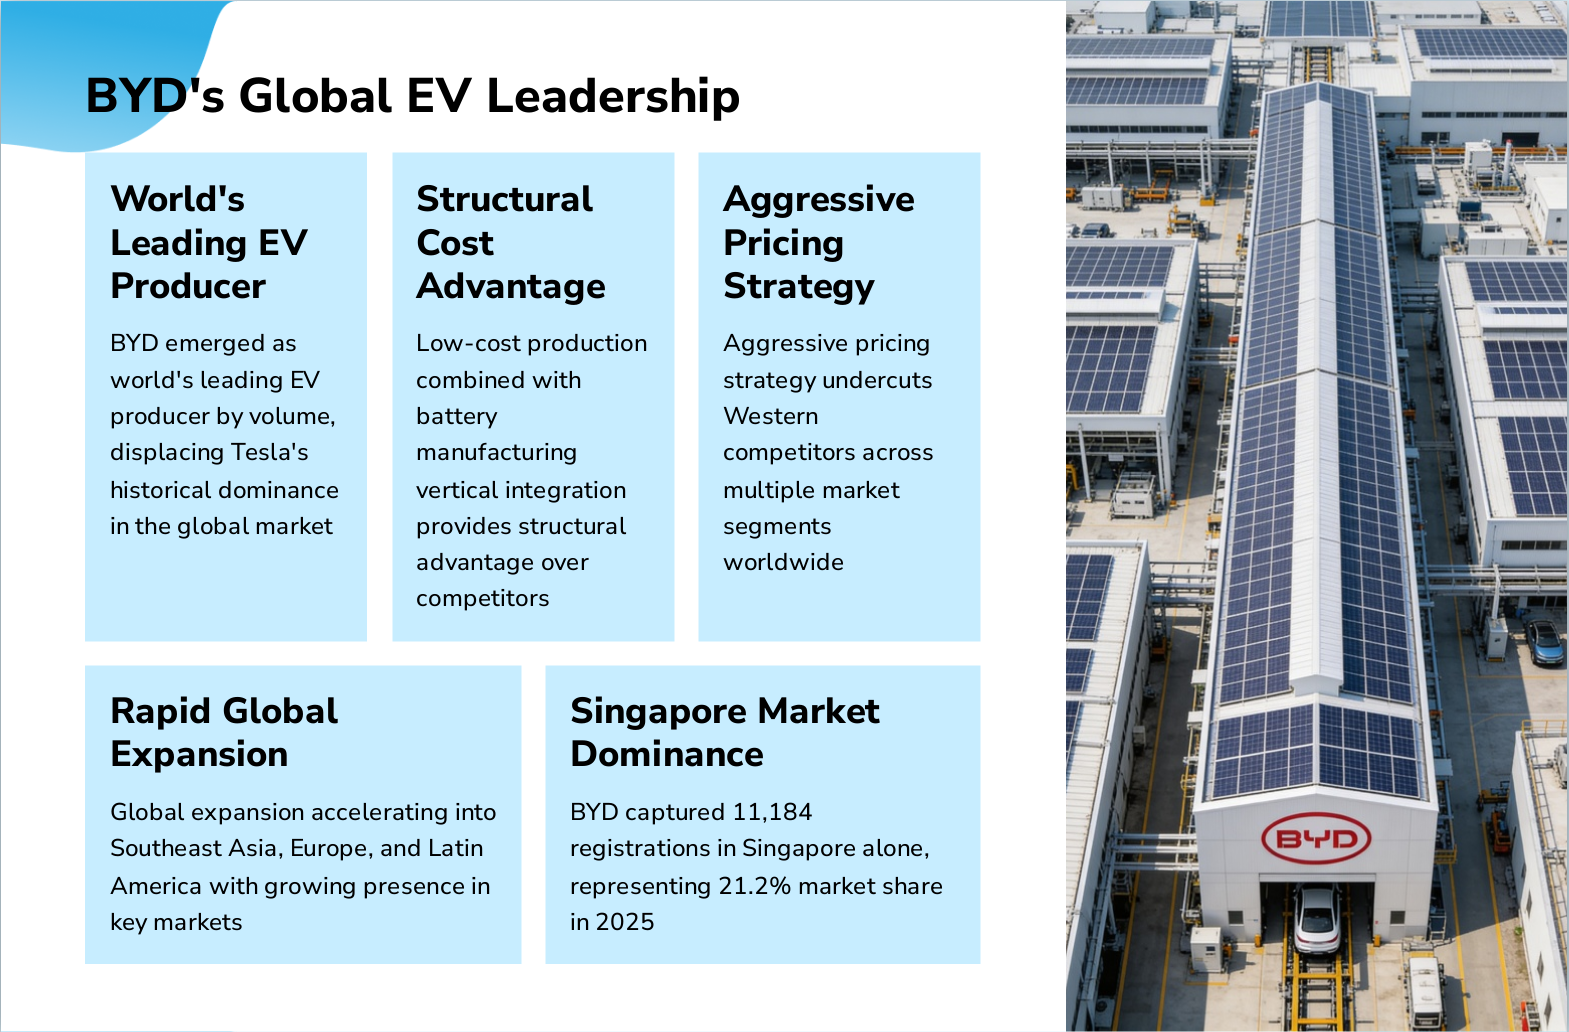
- World's Leading EV Producer: BYD emerged as world's leading EV producer by volume, displacing Tesla's historical dominance in the global market
- Structural Cost Advantage: Low-cost production combined with battery manufacturing vertical integration provides structural advantage over competitors
- Aggressive Pricing Strategy: Aggressive pricing strategy undercuts Western competitors across multiple market segments worldwide
- Rapid Global Expansion: Global expansion accelerating into Southeast Asia, Europe, and Latin America with growing presence in key markets
- Singapore Market Dominance: BYD captured 11,184 registrations in Singapore alone, representing 21.2% market share in 2025
Slide 5: Regional Divergence: China Market-Driven vs. US/Europe Incentive-Dependent Adoption
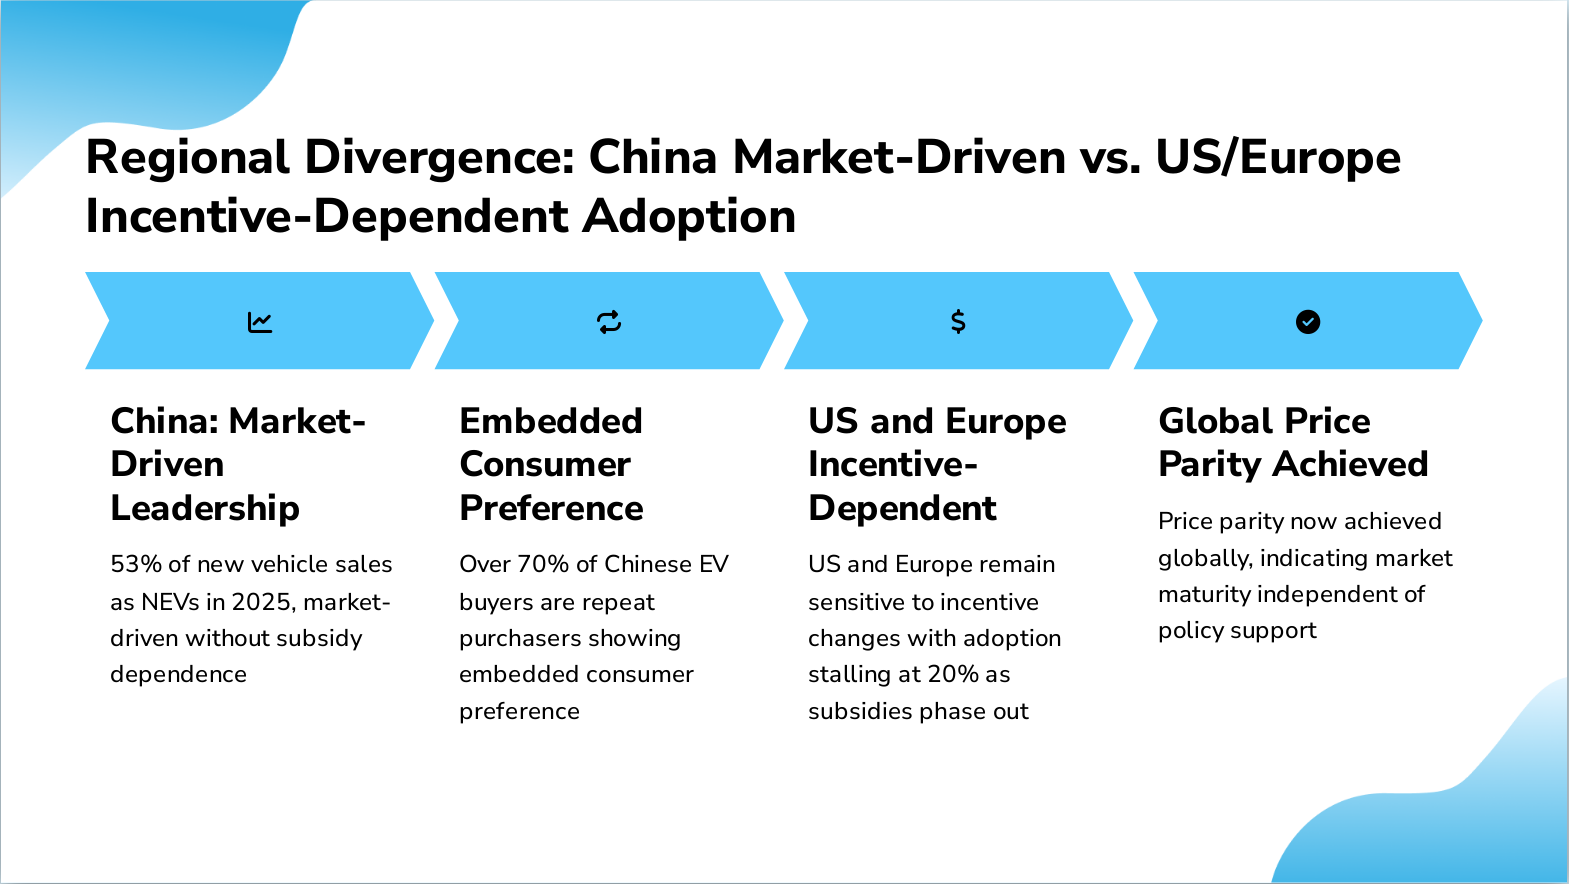
- China: Market-Driven Leadership: 53% of new vehicle sales as NEVs in 2025, market-driven without subsidy dependence
- Embedded Consumer Preference: Over 70% of Chinese EV buyers are repeat purchasers showing embedded consumer preference
- US and Europe Incentive-Dependent: US and Europe remain sensitive to incentive changes with adoption stalling at 20% as subsidies phase out
- Global Price Parity Achieved: Price parity now achieved globally, indicating market maturity independent of policy support
Slide 6: EV Innovation Highlights
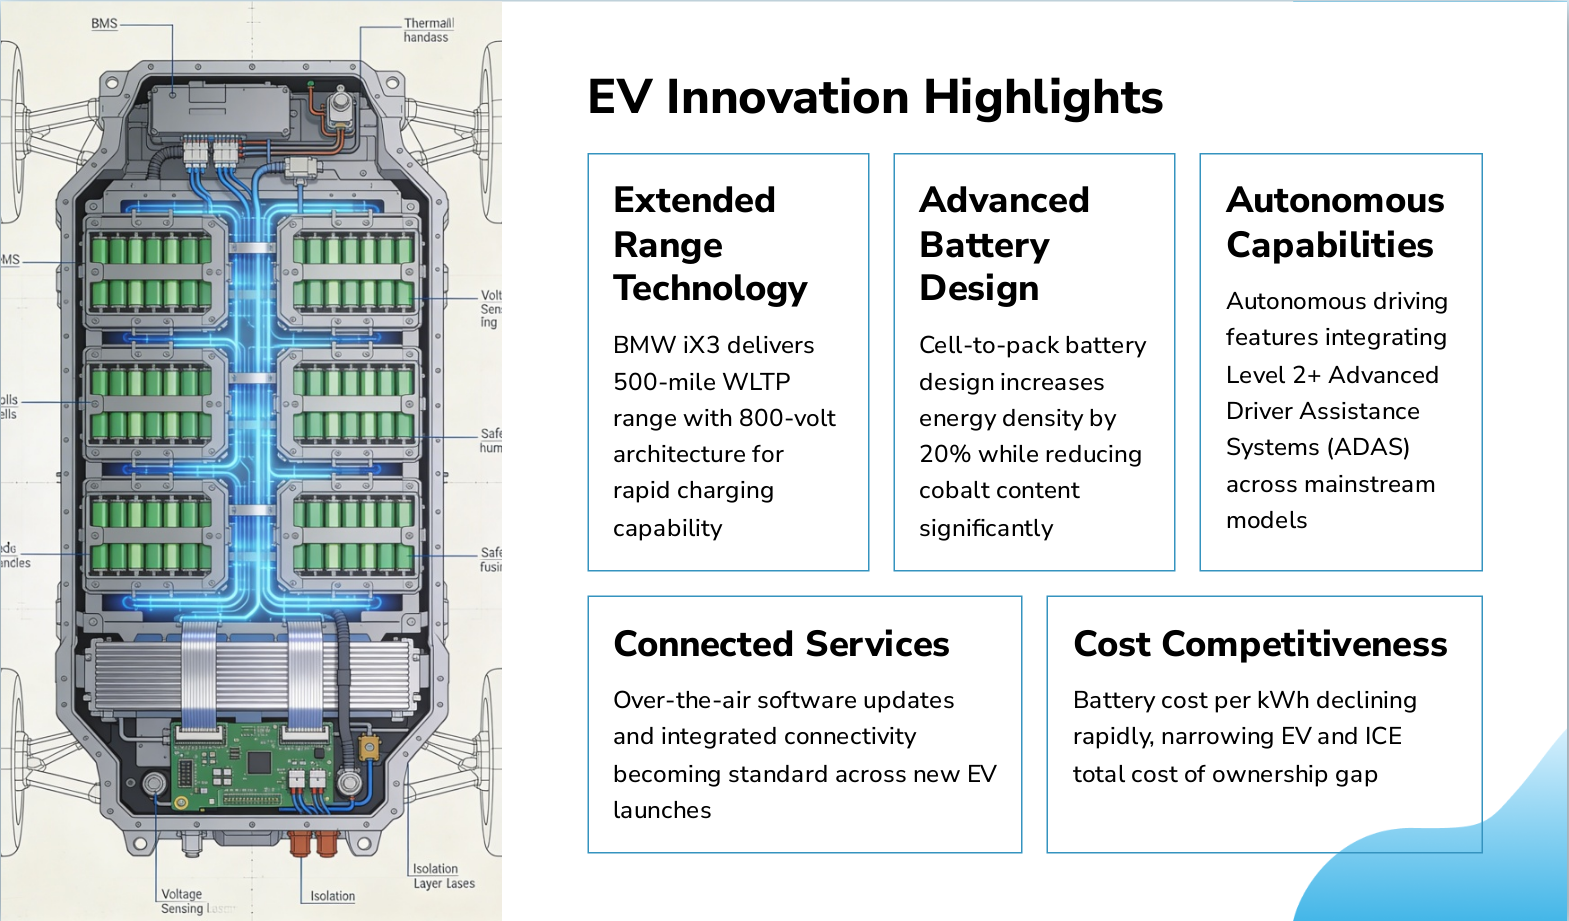
- Extended Range Technology: BMW iX3 delivers 500-mile WLTP range with 800-volt architecture for rapid charging capability
- Advanced Battery Design: Cell-to-pack battery design increases energy density by 20% while reducing cobalt content significantly
- Autonomous Capabilities: Autonomous driving features integrating Level 2+ Advanced Driver Assistance Systems (ADAS) across mainstream models
- Connected Services: Over-the-air software updates and integrated connectivity becoming standard across new EV launches
- Cost Competitiveness: Battery cost per kWh declining rapidly, narrowing EV and ICE total cost of ownership gap
Slide 7: Environmental Case Decisive: EVs Cut Lifecycle Emissions by Half vs. Gasoline Vehicles
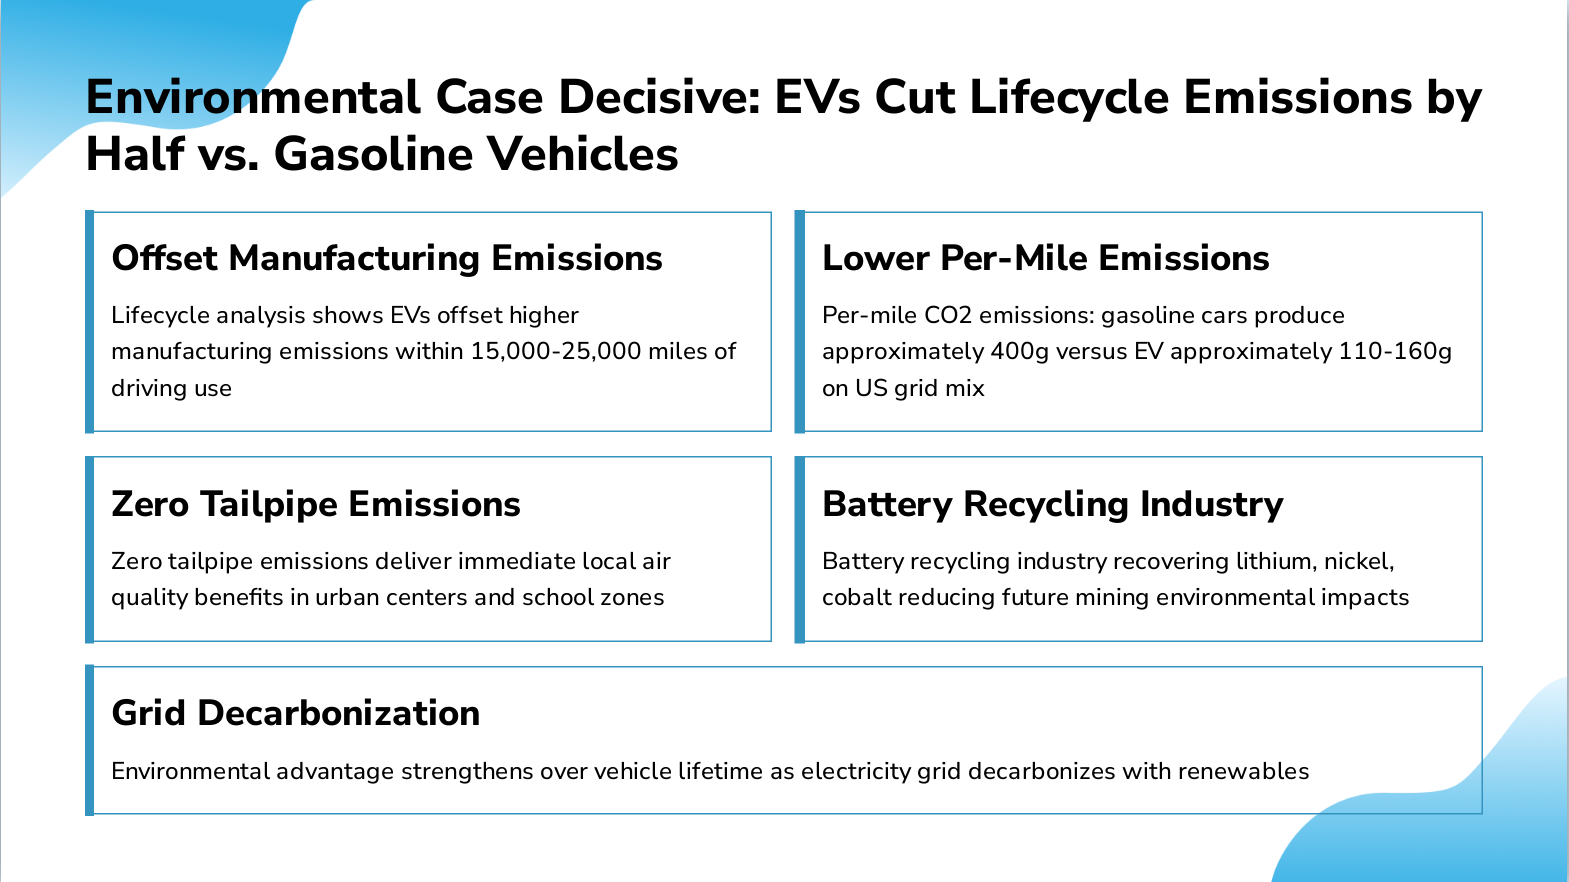
- Offset Manufacturing Emissions: Lifecycle analysis shows EVs offset higher manufacturing emissions within 15,000-25,000 miles of driving use
- Lower Per-Mile Emissions: Per-mile CO2 emissions: gasoline cars produce approximately 400g versus EV approximately 110-160g on US grid mix
- Zero Tailpipe Emissions: Zero tailpipe emissions deliver immediate local air quality benefits in urban centers and school zones
- Battery Recycling Industry: Battery recycling industry recovering lithium, nickel, cobalt reducing future mining environmental impacts
- Grid Decarbonization: Environmental advantage strengthens over vehicle lifetime as electricity grid decarbonizes with renewables
Slide 8: Manufacturing Carbon Debt: EVs Start Higher but Cross Breakeven Quickly
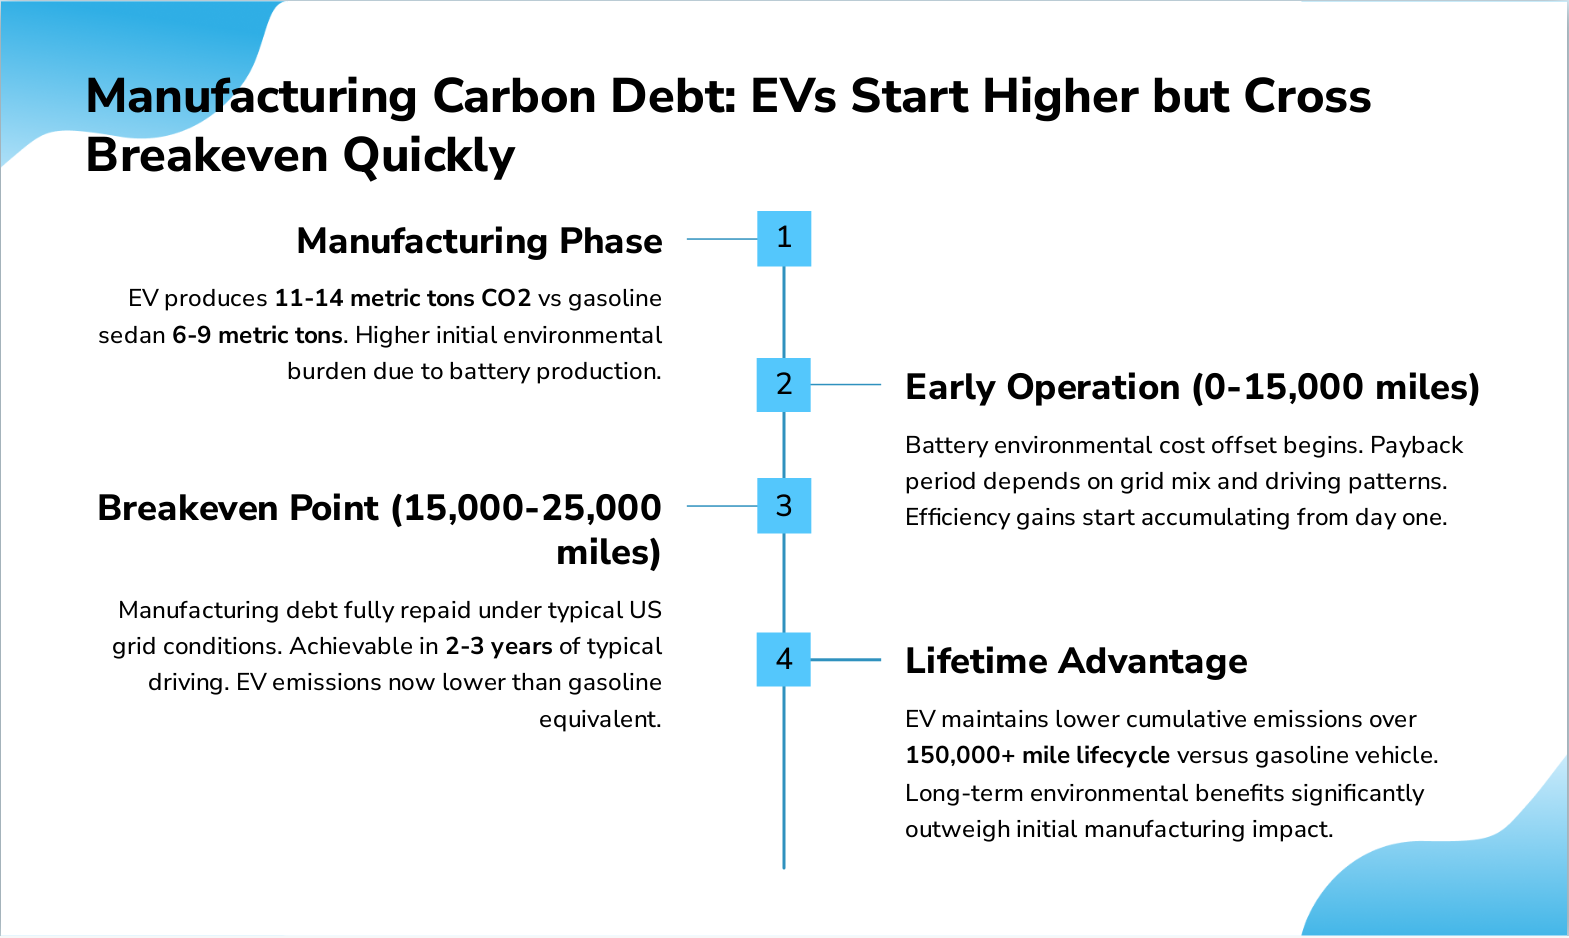
- Manufacturing Phase: EV produces 11-14 metric tons CO2 vs gasoline sedan 6-9 metric tons . Higher initial environmental burden due to battery production.
- Early Operation (0-15,000 miles): Battery environmental cost offset begins. Payback period depends on grid mix and driving patterns. Efficiency gains start accumulating from day one.
- Breakeven Point (15,000-25,000 miles): Manufacturing debt fully repaid under typical US grid conditions. Achievable in 2-3 years of typical driving. EV emissions now lower than gasoline equivalent.
- Lifetime Advantage: EV maintains lower cumulative emissions over 150,000+ mile lifecycle versus gasoline vehicle. Long-term environmental benefits significantly outweigh initial manufacturing impact.
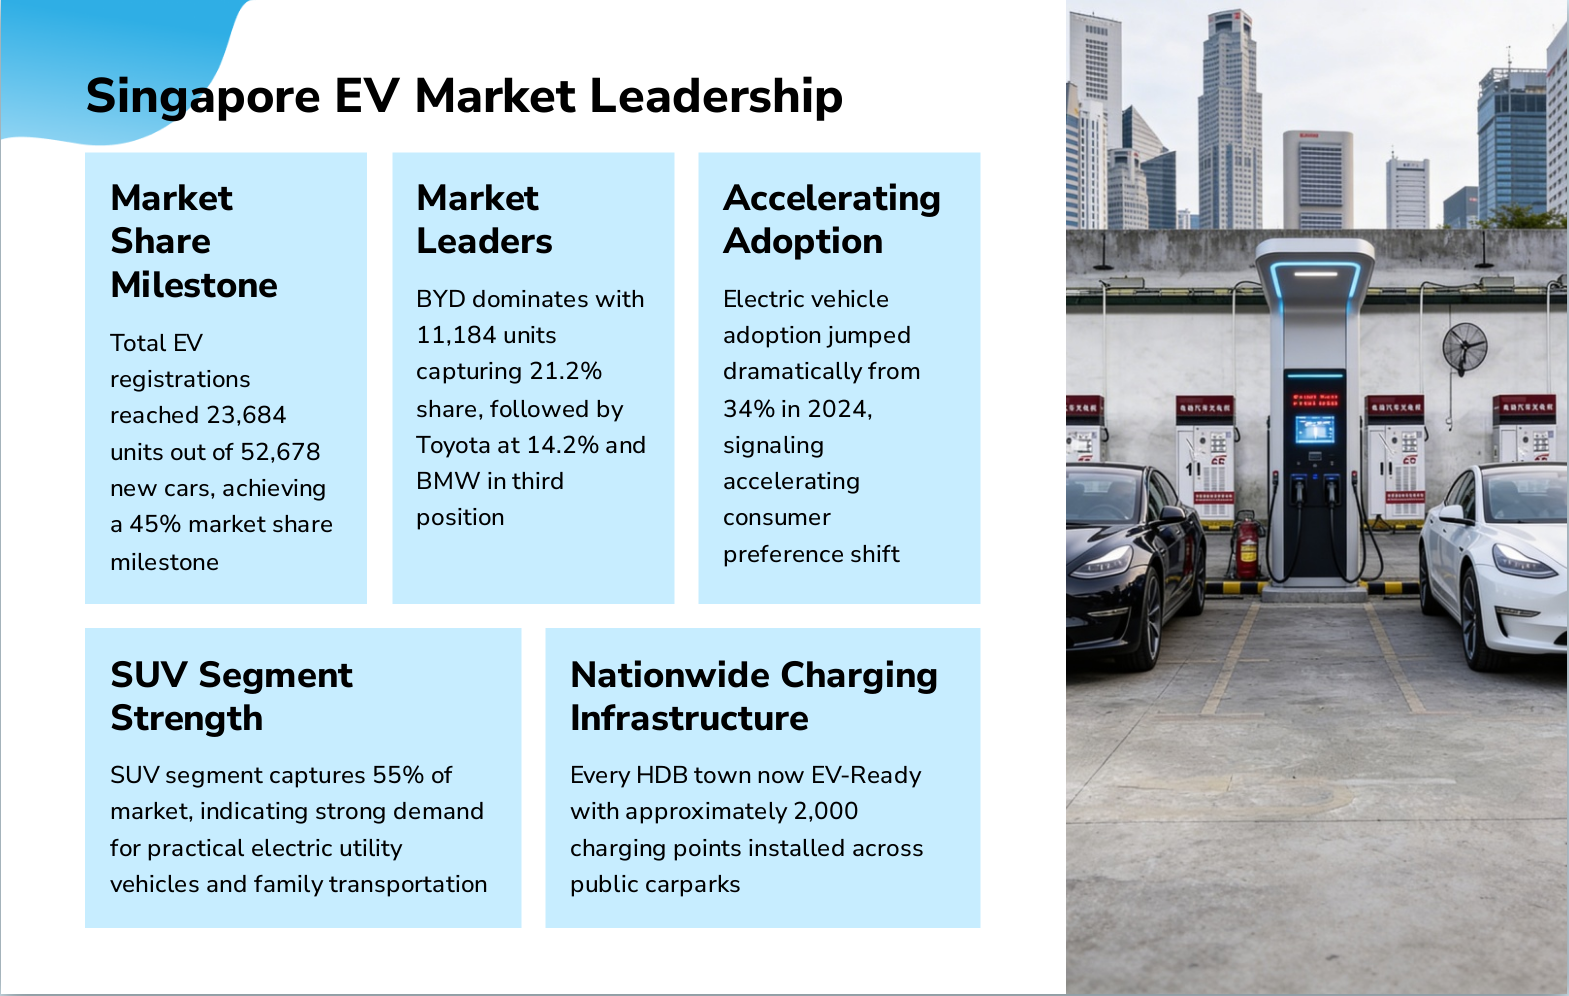
Slide 9: Singapore EV Market Leadership
- Market Share Milestone: Total EV registrations reached 23,684 units out of 52,678 new cars, achieving a 45% market share milestone
- Market Leaders: BYD dominates with 11,184 units capturing 21.2% share, followed by Toyota at 14.2% and BMW in third position
- Accelerating Adoption: Electric vehicle adoption jumped dramatically from 34% in 2024, signaling accelerating consumer preference shift
- SUV Segment Strength: SUV segment captures 55% of market, indicating strong demand for practical electric utility vehicles and family transportation
- Nationwide Charging Infrastructure: Every HDB town now EV-Ready with approximately 2,000 charging points installed across public carparks
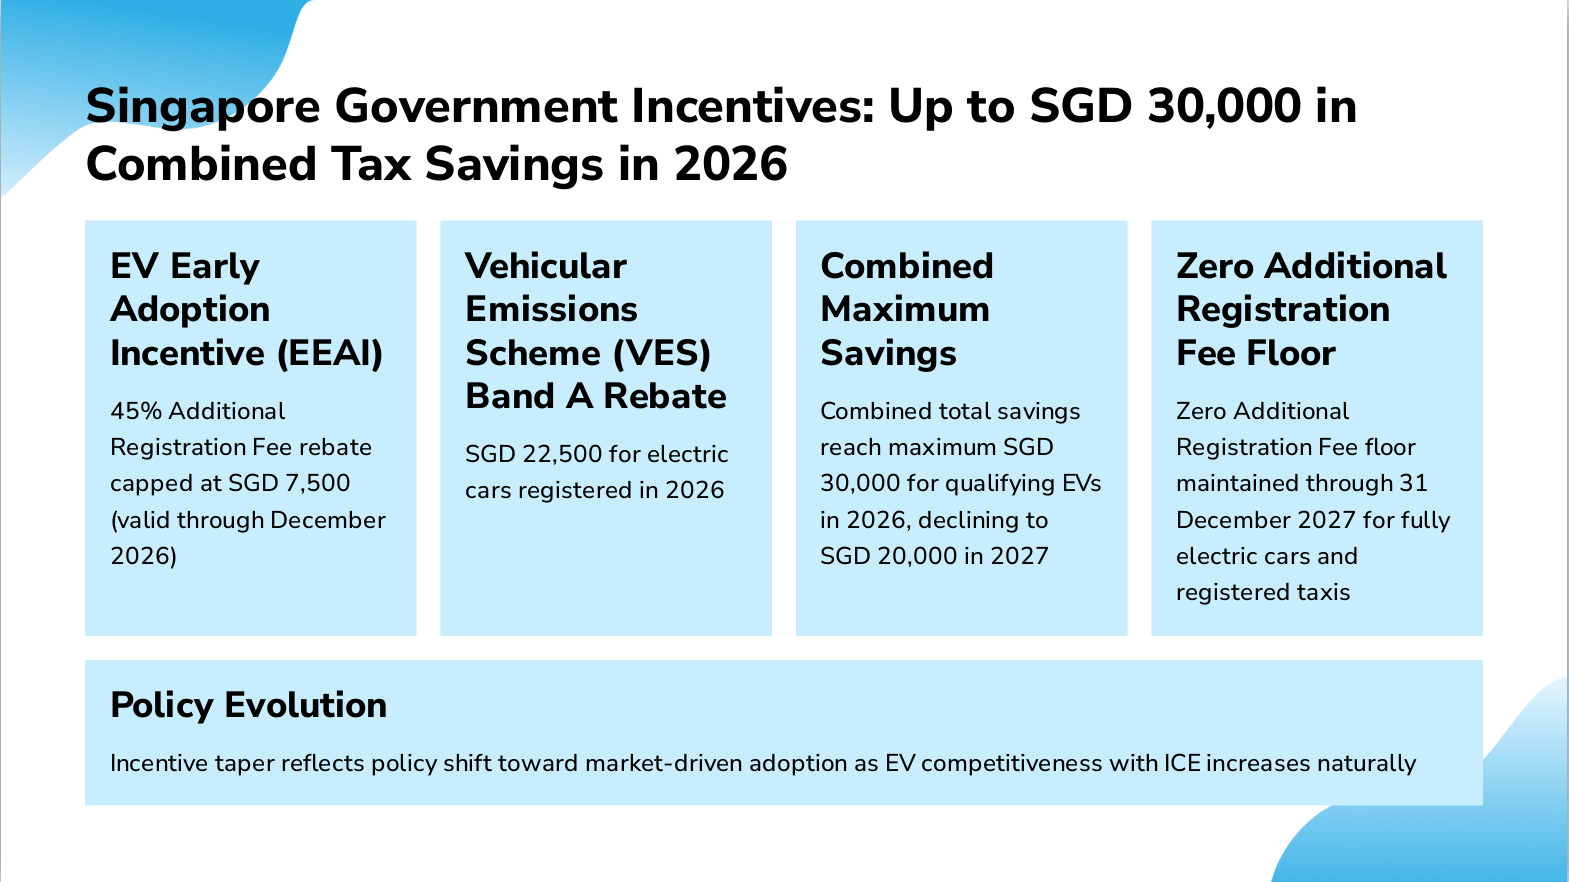
Slide 10: Singapore Government Incentives: Up to SGD 30,000 in Combined Tax Savings in 2026
- EV Early Adoption Incentive (EEAI): 45% Additional Registration Fee rebate capped at SGD 7,500 (valid through December 2026)
- Vehicular Emissions Scheme (VES) Band A Rebate: SGD 22,500 for electric cars registered in 2026
- Combined Maximum Savings: Combined total savings reach maximum SGD 30,000 for qualifying EVs in 2026, declining to SGD 20,000 in 2027
- Zero Additional Registration Fee Floor: Zero Additional Registration Fee floor maintained through 31 December 2027 for fully electric cars and registered taxis
- Policy Evolution: Incentive taper reflects policy shift toward market-driven adoption as EV competitiveness with ICE increases naturally
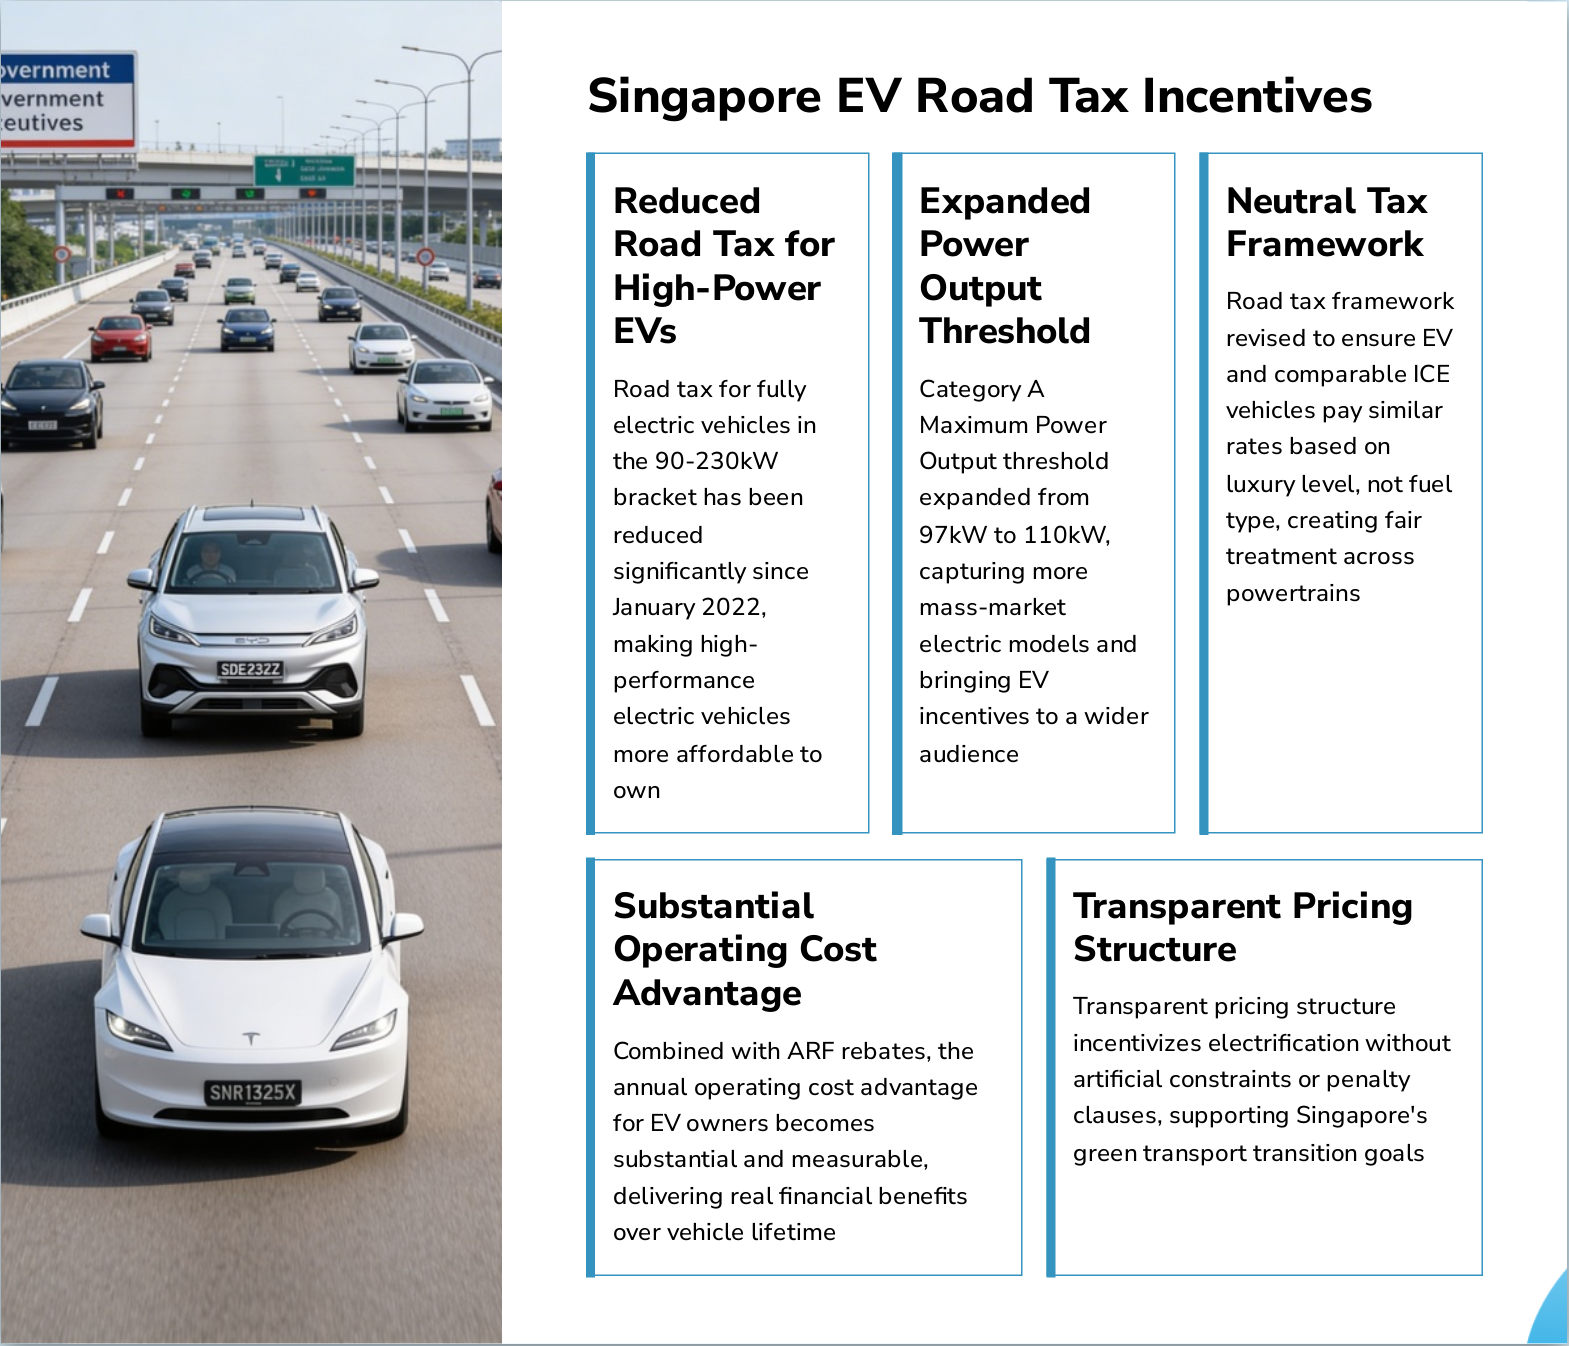
Slide 11: Singapore EV Road Tax Incentives
- Reduced Road Tax for High-Power EVs: Road tax for fully electric vehicles in the 90-230kW bracket has been reduced significantly since January 2022, making high-performance electric vehicles more affordable to own
- Expanded Power Output Threshold: Category A Maximum Power Output threshold expanded from 97kW to 110kW, capturing more mass-market electric models and bringing EV incentives to a wider audience
- Neutral Tax Framework: Road tax framework revised to ensure EV and comparable ICE vehicles pay similar rates based on luxury level, not fuel type, creating fair treatment across powertrains
- Substantial Operating Cost Advantage: Combined with ARF rebates, the annual operating cost advantage for EV owners becomes substantial and measurable, delivering real financial benefits over vehicle lifetime
- Transparent Pricing Structure: Transparent pricing structure incentivizes electrification without artificial constraints or penalty clauses, supporting Singapore's green transport transition goals
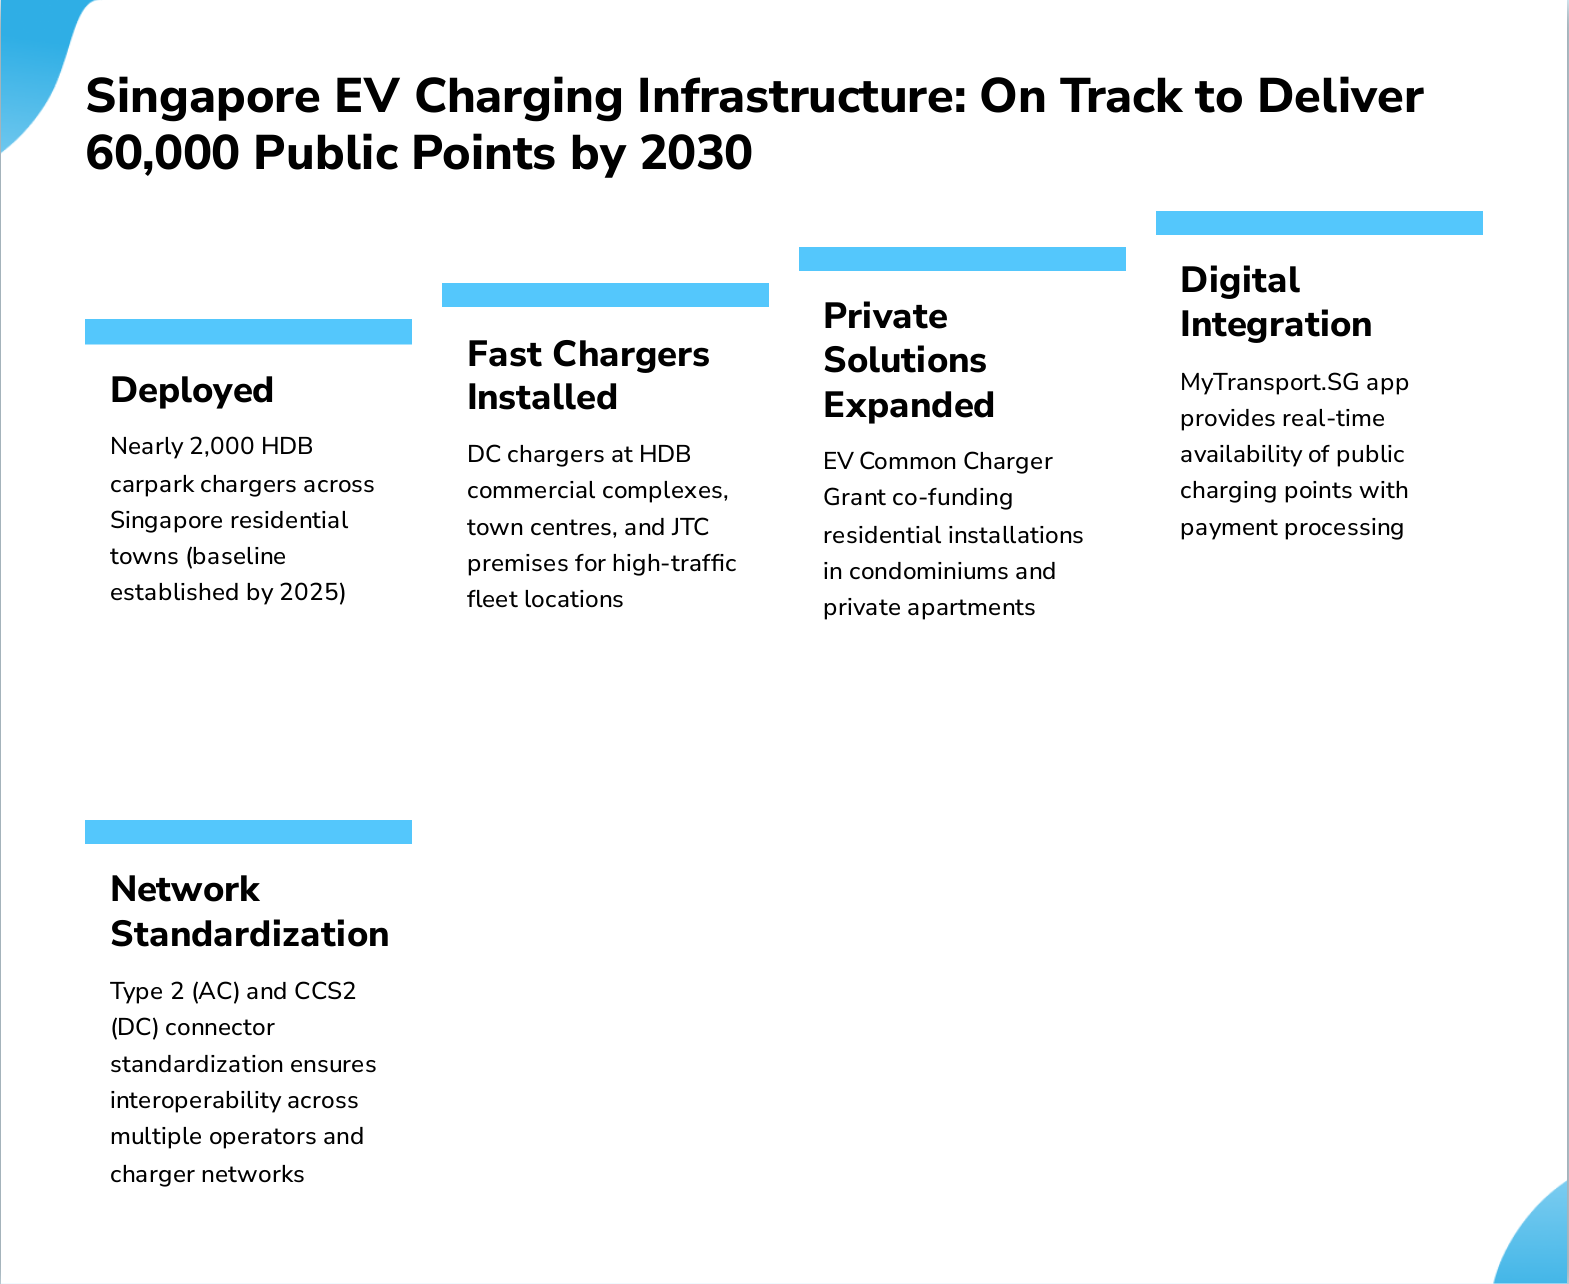
Slide 12: Singapore EV Charging Infrastructure: On Track to Deliver 60,000 Public Points by 2030
- Deployed: Nearly 2,000 HDB carpark chargers across Singapore residential towns (baseline established by 2025)
- Fast Chargers Installed: DC chargers at HDB commercial complexes, town centres, and JTC premises for high-traffic fleet locations
- Private Solutions Expanded: EV Common Charger Grant co-funding residential installations in condominiums and private apartments
- Digital Integration: MyTransport.SG app provides real-time availability of public charging points with payment processing
- Network Standardization: Type 2 (AC) and CCS2 (DC) connector standardization ensures interoperability across multiple operators and charger networks
Slide 13: Singapore EV Rental Services
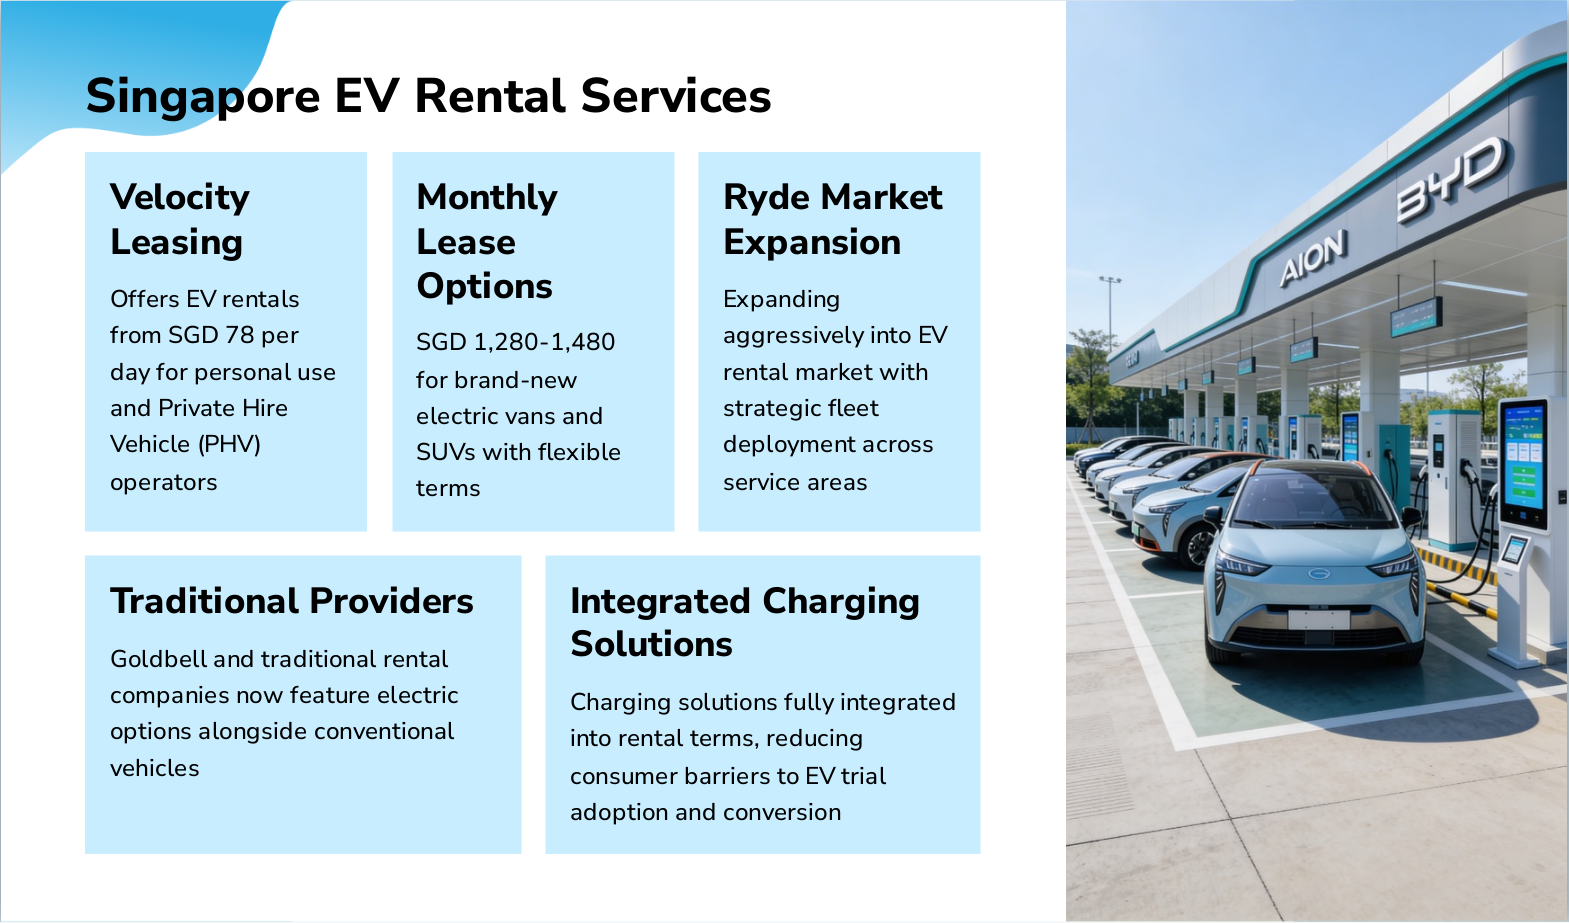
- Velocity Leasing: Offers EV rentals from SGD 78 per day for personal use and Private Hire Vehicle (PHV) operators
- Monthly Lease Options: SGD 1,280-1,480 for brand-new electric vans and SUVs with flexible terms
- Ryde Market Expansion: Expanding aggressively into EV rental market with strategic fleet deployment across service areas
- Traditional Providers: Goldbell and traditional rental companies now feature electric options alongside conventional vehicles
- Integrated Charging Solutions: Charging solutions fully integrated into rental terms, reducing consumer barriers to EV trial adoption and conversion
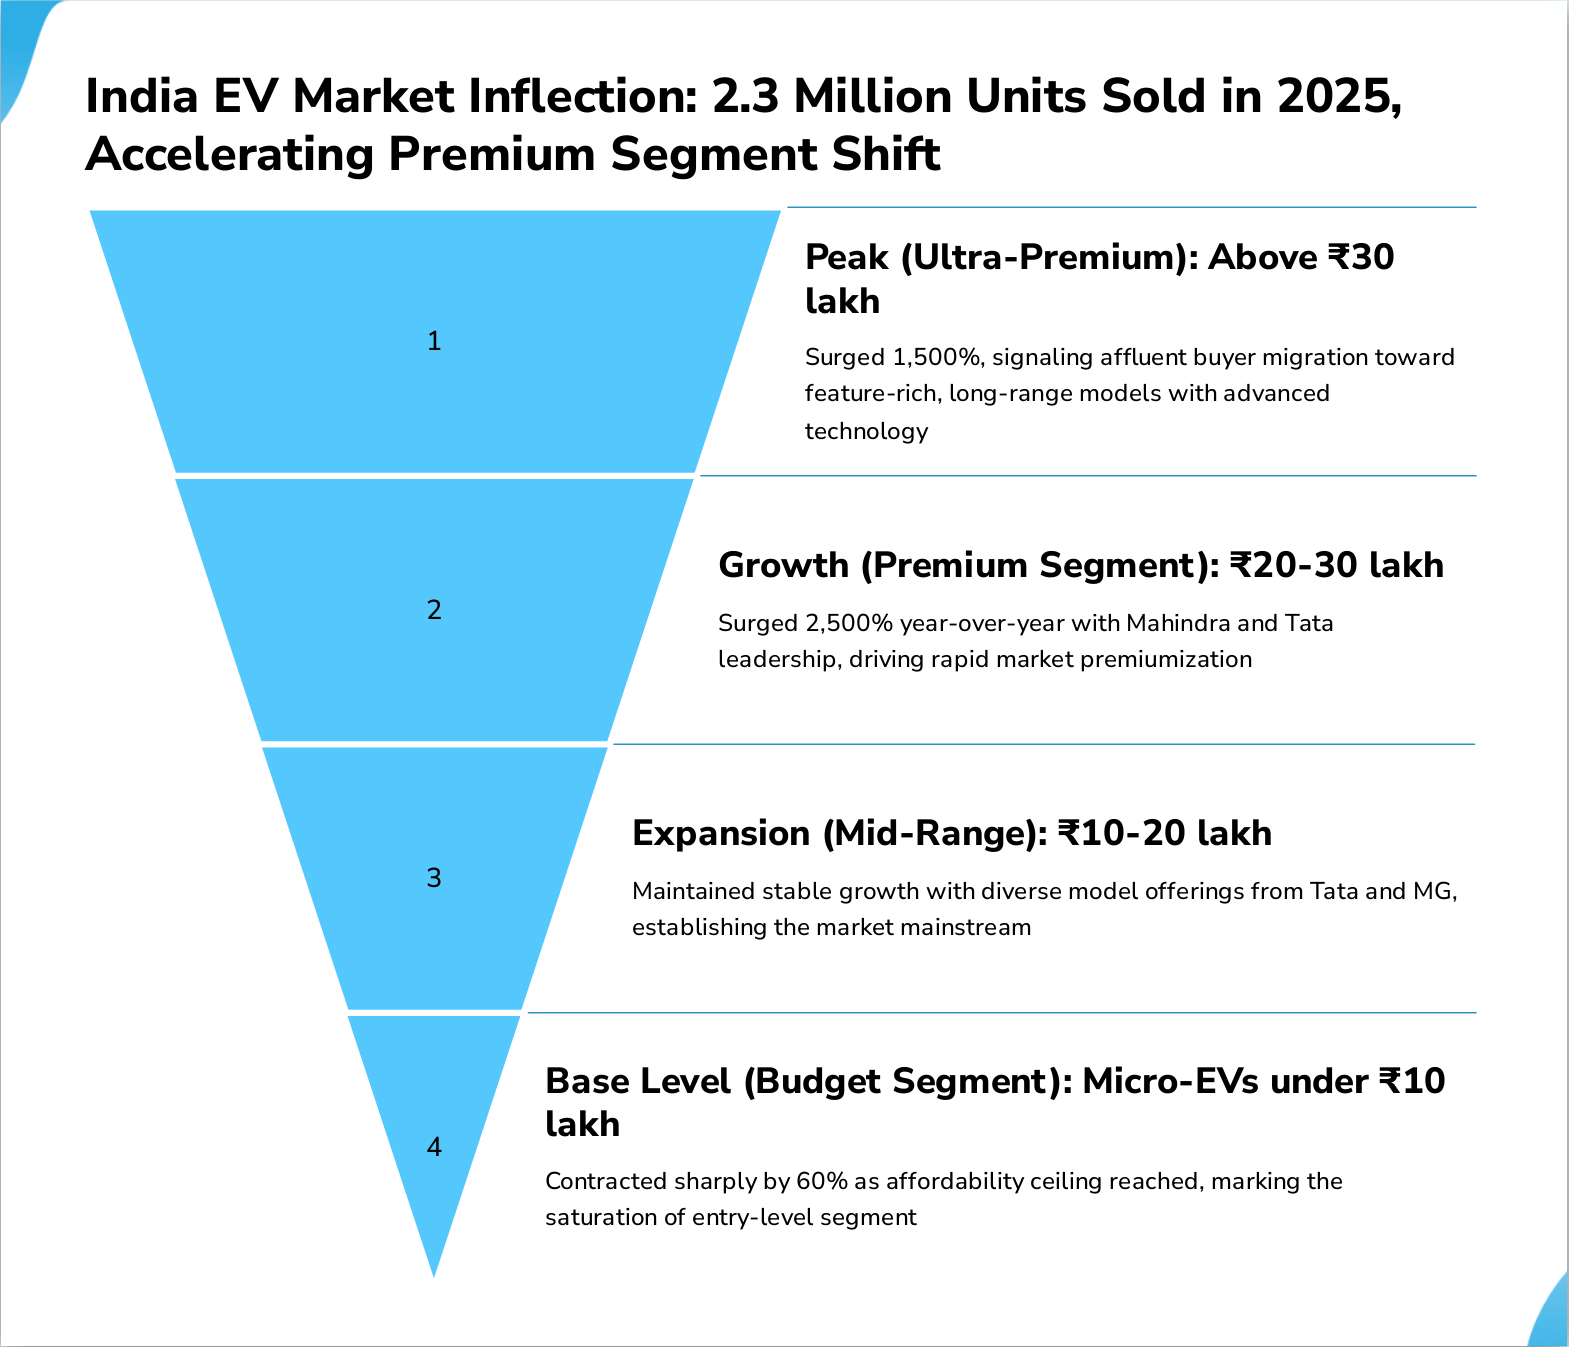
Slide 14: India EV Market Inflection: 2.3 Million Units Sold in 2025, Accelerating Premium Segment Shift
- Peak (Ultra-Premium): Above ₹30 lakh: Surged 1,500%, signaling affluent buyer migration toward feature-rich, long-range models with advanced technology
- Growth (Premium Segment): ₹20-30 lakh: Surged 2,500% year-over-year with Mahindra and Tata leadership, driving rapid market premiumization
- Expansion (Mid-Range): ₹10-20 lakh: Maintained stable growth with diverse model offerings from Tata and MG, establishing the market mainstream
- Base Level (Budget Segment): Micro-EVs under ₹10 lakh: Contracted sharply by 60% as affordability ceiling reached, marking the saturation of entry-level segment
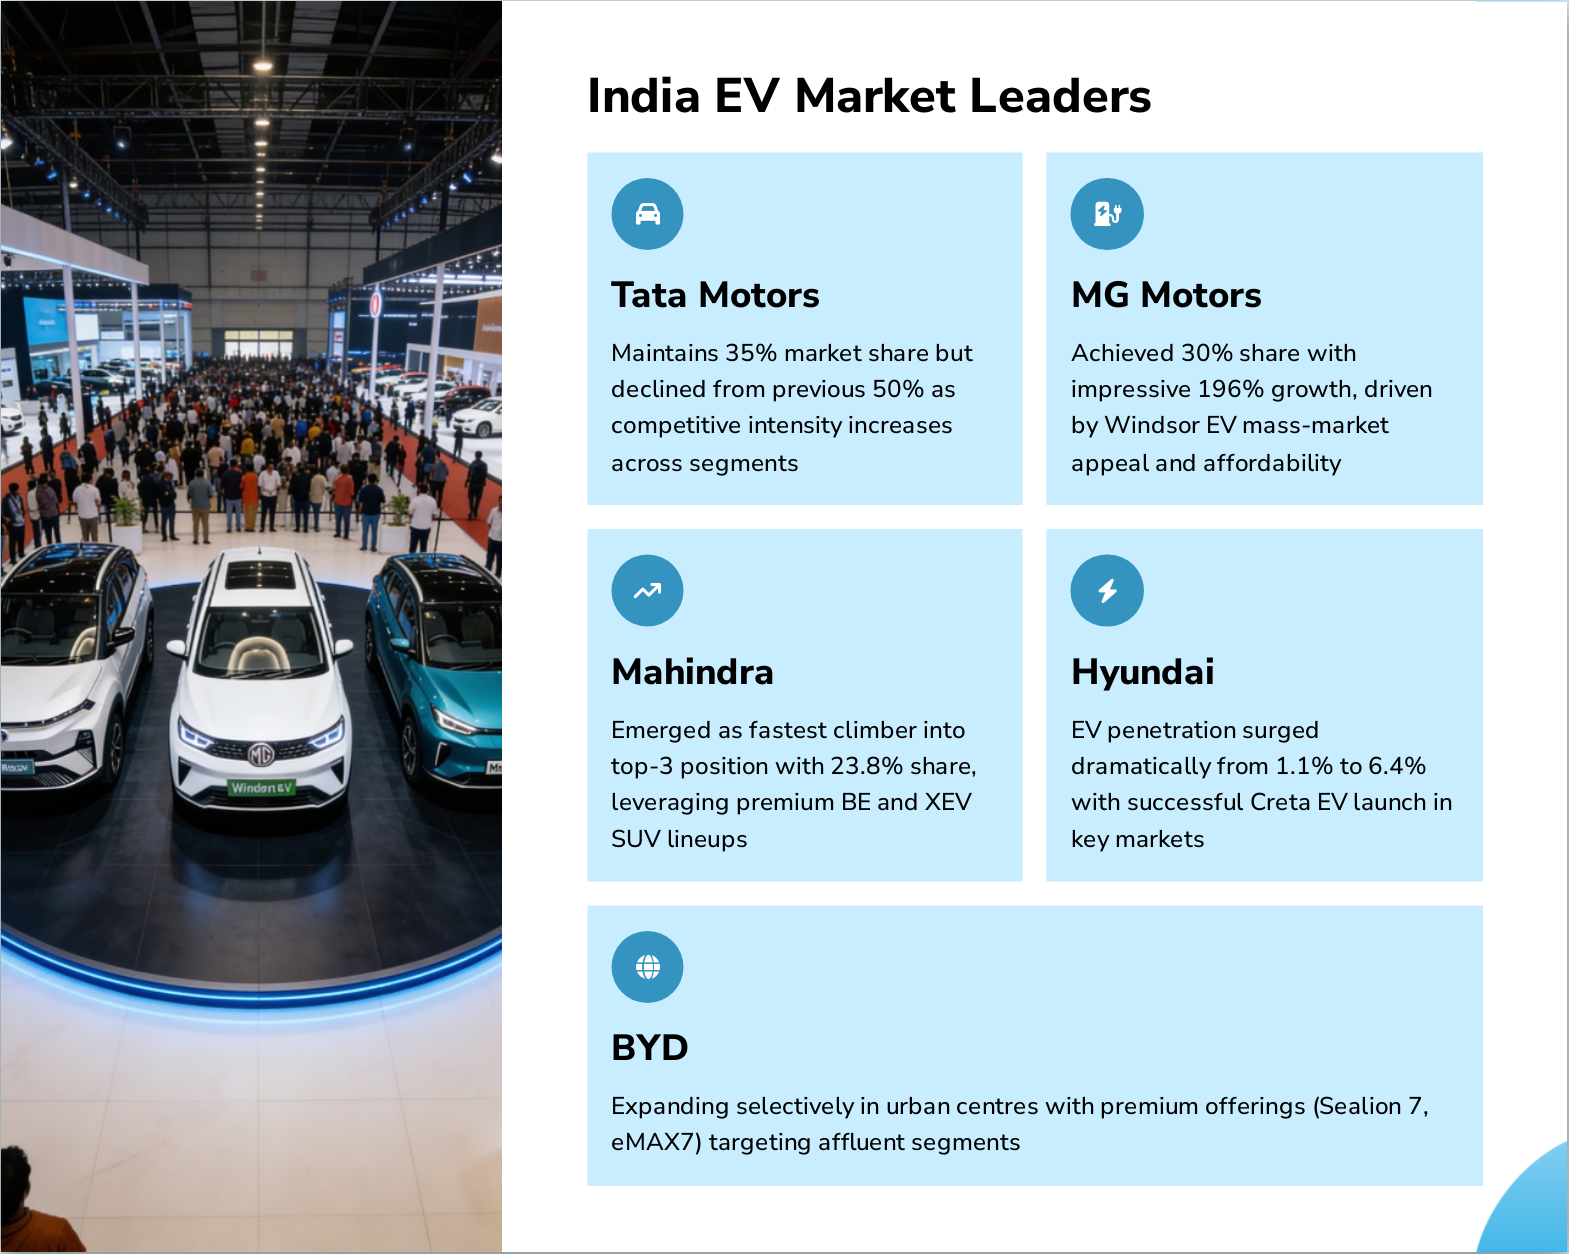
Slide 15: India EV Market Leaders
- Tata Motors: Maintains 35% market share but declined from previous 50% as competitive intensity increases across segments
- MG Motors: Achieved 30% share with impressive 196% growth, driven by Windsor EV mass-market appeal and affordability
- Mahindra: Emerged as fastest climber into top-3 position with 23.8% share, leveraging premium BE and XEV SUV lineups
- Hyundai: EV penetration surged dramatically from 1.1% to 6.4% with successful Creta EV launch in key markets
- BYD: Expanding selectively in urban centres with premium offerings (Sealion 7, eMAX7) targeting affluent segments
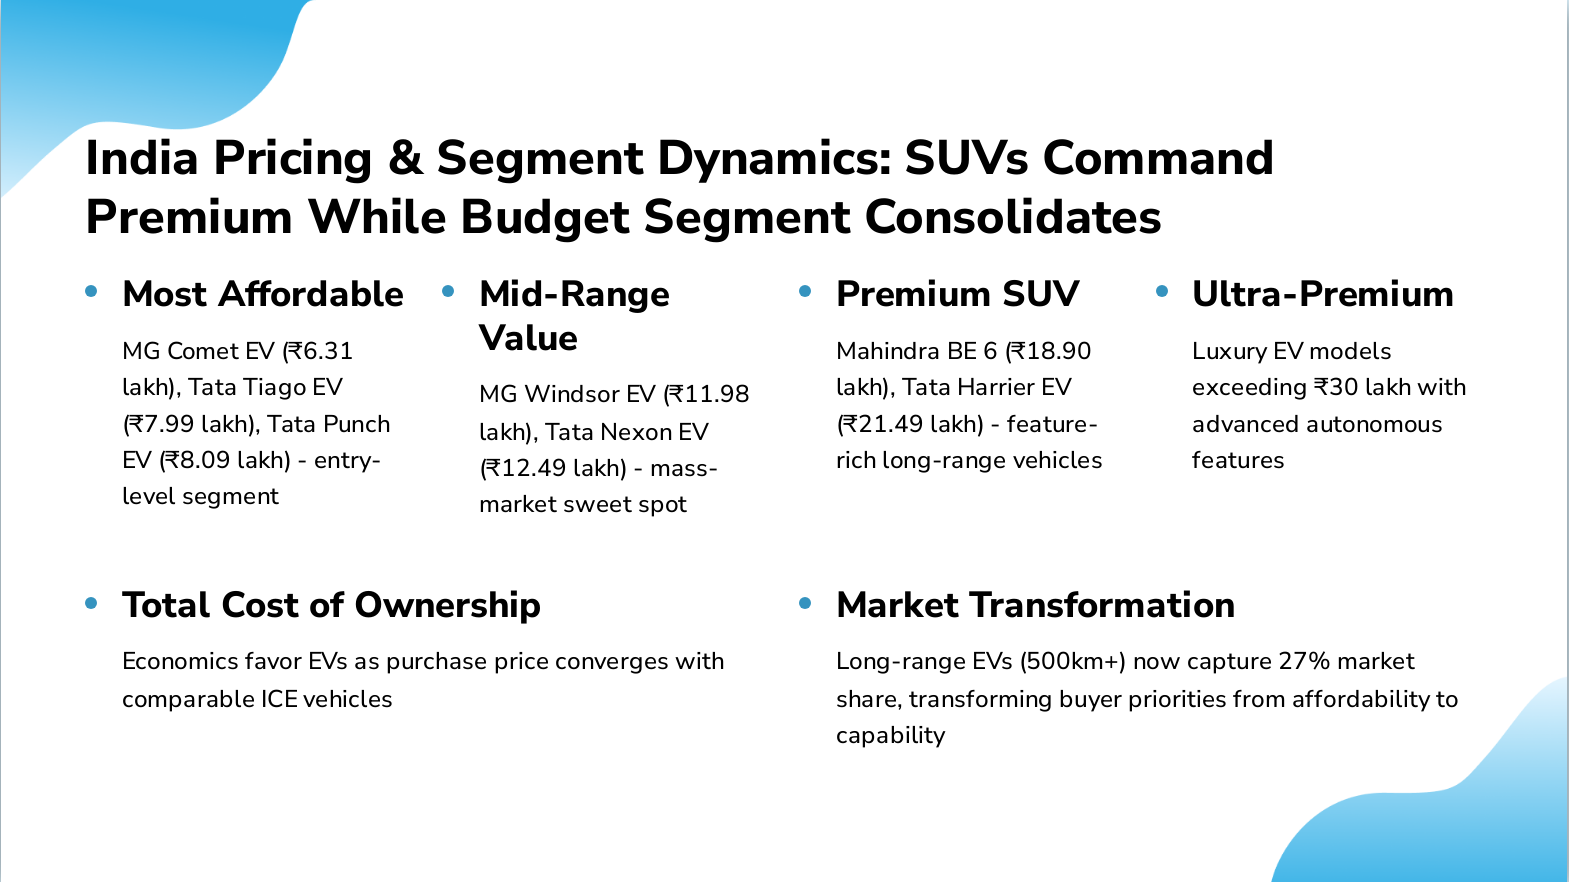
Slide 16: India Pricing & Segment Dynamics: SUVs Command Premium While Budget Segment Consolidates
- Most Affordable: MG Comet EV (₹6.31 lakh), Tata Tiago EV (₹7.99 lakh), Tata Punch EV (₹8.09 lakh) - entry-level segment
- Mid-Range Value: MG Windsor EV (₹11.98 lakh), Tata Nexon EV (₹12.49 lakh) - mass-market sweet spot
- Premium SUV: Mahindra BE 6 (₹18.90 lakh), Tata Harrier EV (₹21.49 lakh) - feature-rich long-range vehicles
- Ultra-Premium: Luxury EV models exceeding ₹30 lakh with advanced autonomous features
- Total Cost of Ownership: Economics favor EVs as purchase price converges with comparable ICE vehicles
- Market Transformation: Long-range EVs (500km+) now capture 27% market share, transforming buyer priorities from affordability to capability
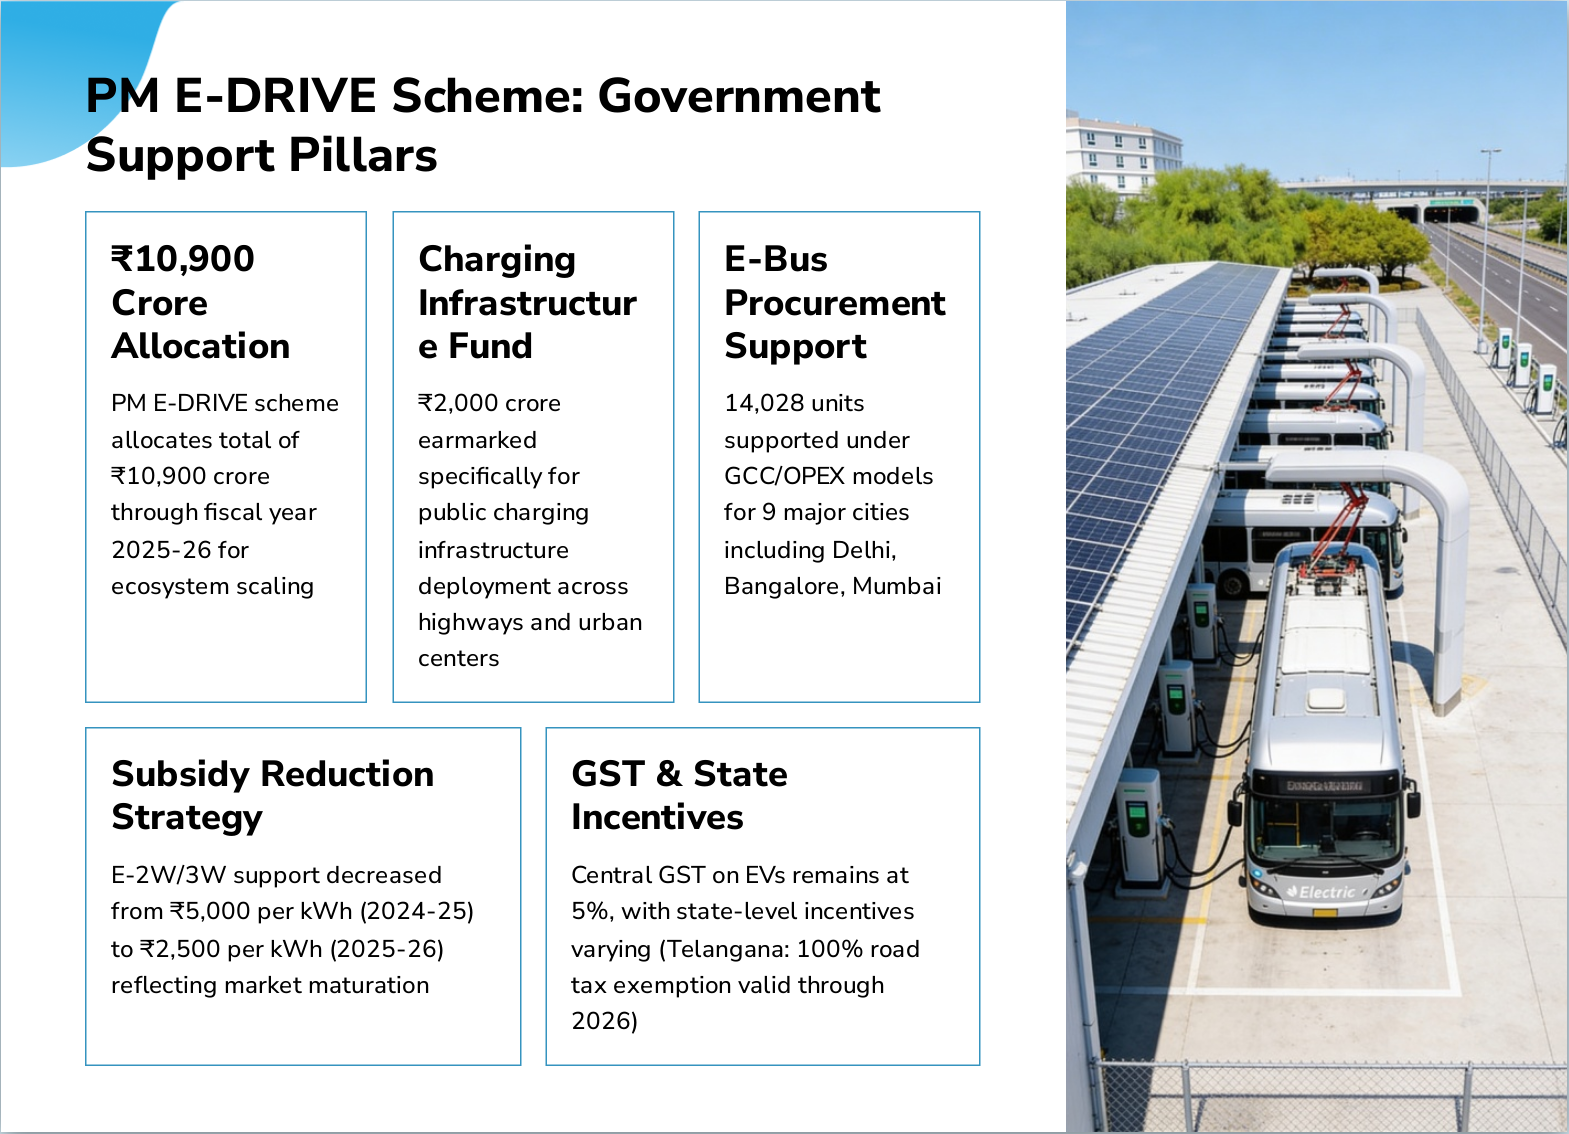
Slide 17: PM E-DRIVE Scheme: Government Support Pillars
- ₹10,900 Crore Allocation: PM E-DRIVE scheme allocates total of ₹10,900 crore through fiscal year 2025-26 for ecosystem scaling
- Charging Infrastructure Fund: ₹2,000 crore earmarked specifically for public charging infrastructure deployment across highways and urban centers
- E-Bus Procurement Support: 14,028 units supported under GCC/OPEX models for 9 major cities including Delhi, Bangalore, Mumbai
- Subsidy Reduction Strategy: E-2W/3W support decreased from ₹5,000 per kWh (2024-25) to ₹2,500 per kWh (2025-26) reflecting market maturation
- GST & State Incentives: Central GST on EVs remains at 5%, with state-level incentives varying (Telangana: 100% road tax exemption valid through 2026)
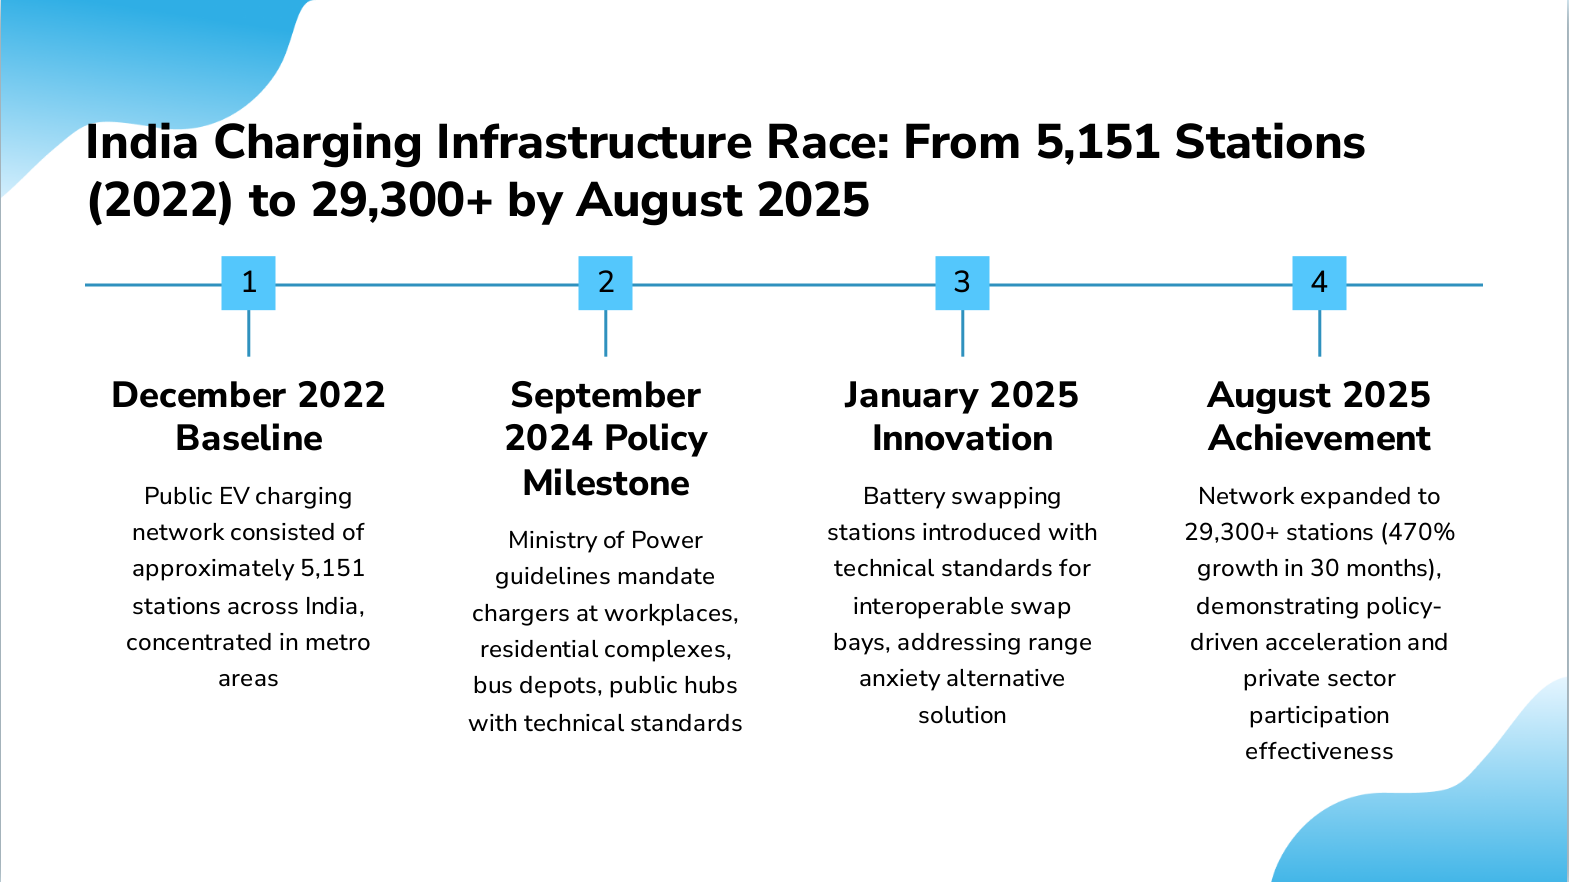
Slide 18: India Charging Infrastructure Race: From 5,151 Stations (2022) to 29,300+ by August 2025
- December 2022 Baseline: Public EV charging network consisted of approximately 5,151 stations across India, concentrated in metro areas
- September 2024 Policy Milestone: Ministry of Power guidelines mandate chargers at workplaces, residential complexes, bus depots, public hubs with technical standards
- January 2025 Innovation: Battery swapping stations introduced with technical standards for interoperable swap bays, addressing range anxiety alternative solution
- August 2025 Achievement: Network expanded to 29,300+ stations (470% growth in 30 months), demonstrating policy-driven acceleration and private sector participation effectiveness
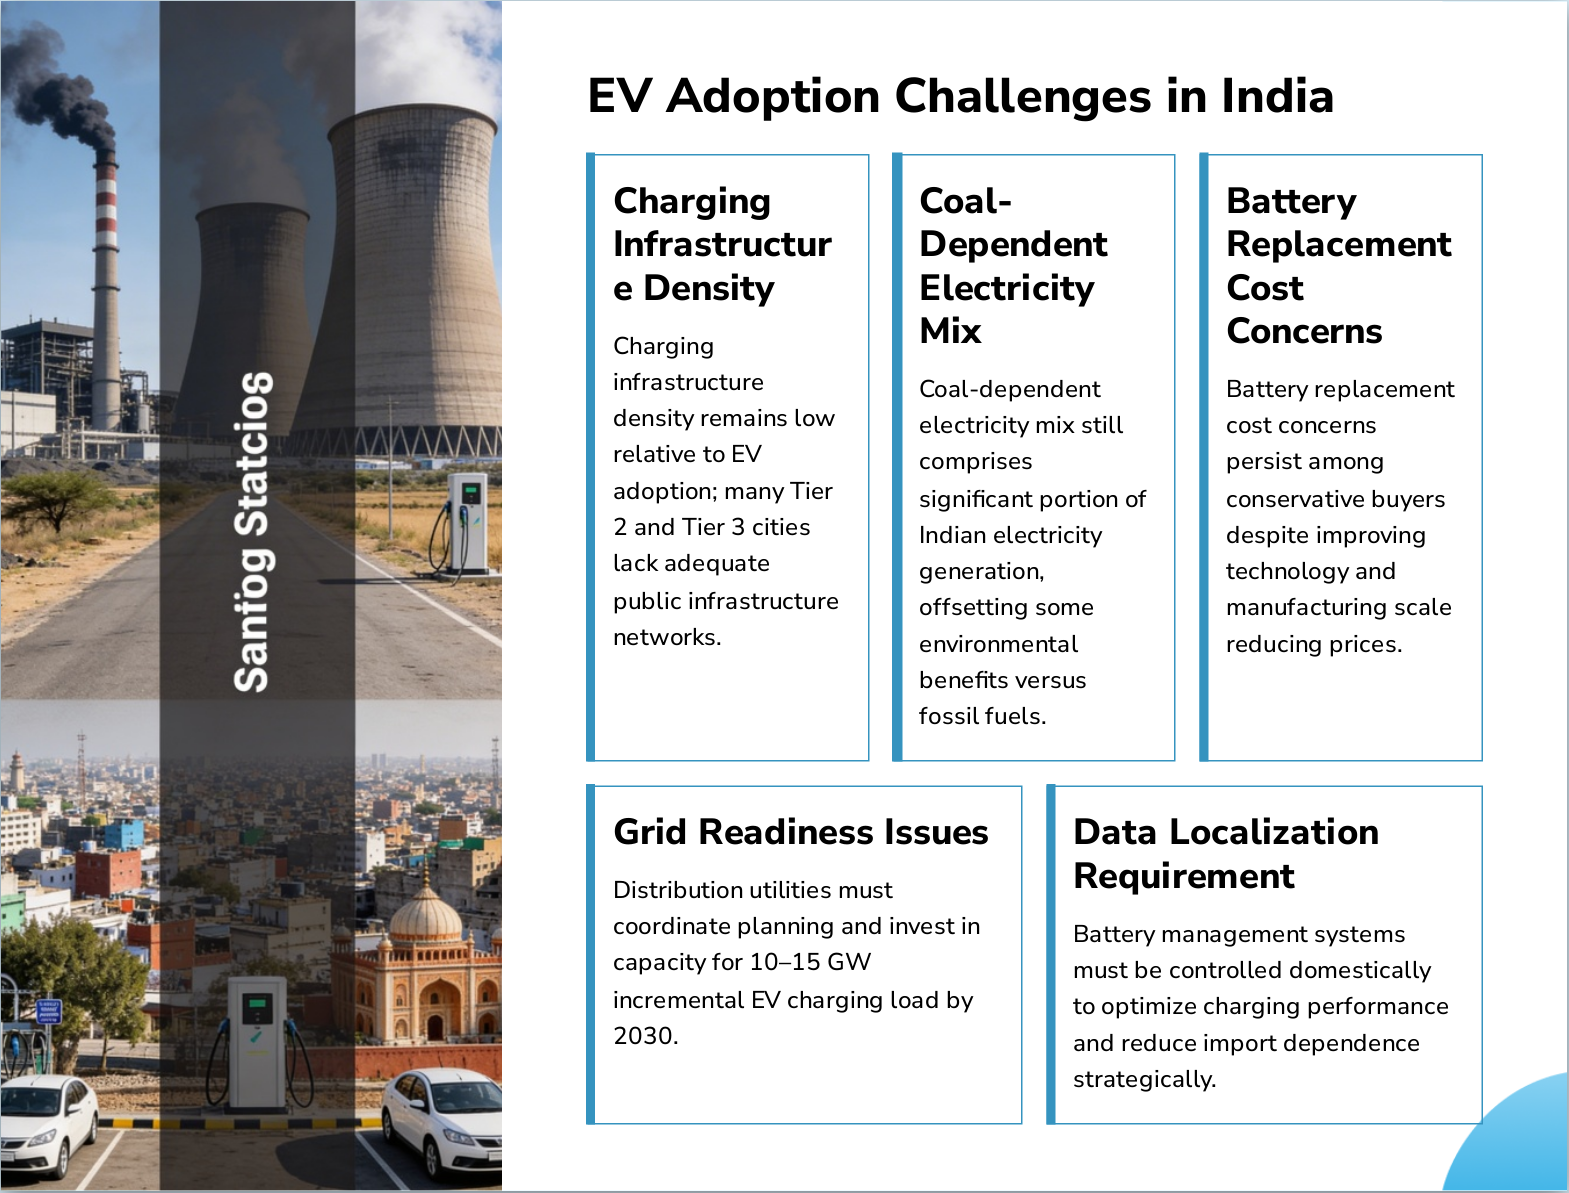
Slide 19: EV Adoption Challenges in India
- Charging Infrastructure Density: Charging infrastructure density remains low relative to EV adoption; many Tier 2 and Tier 3 cities lack adequate public infrastructure networks.
- Coal-Dependent Electricity Mix: Coal-dependent electricity mix still comprises significant portion of Indian electricity generation, offsetting some environmental benefits versus fossil fuels.
- Battery Replacement Cost Concerns: Battery replacement cost concerns persist among conservative buyers despite improving technology and manufacturing scale reducing prices.
- Grid Readiness Issues: Distribution utilities must coordinate planning and invest in capacity for 10–15 GW incremental EV charging load by 2030.
- Data Localization Requirement: Battery management systems must be controlled domestically to optimize charging performance and reduce import dependence strategically.
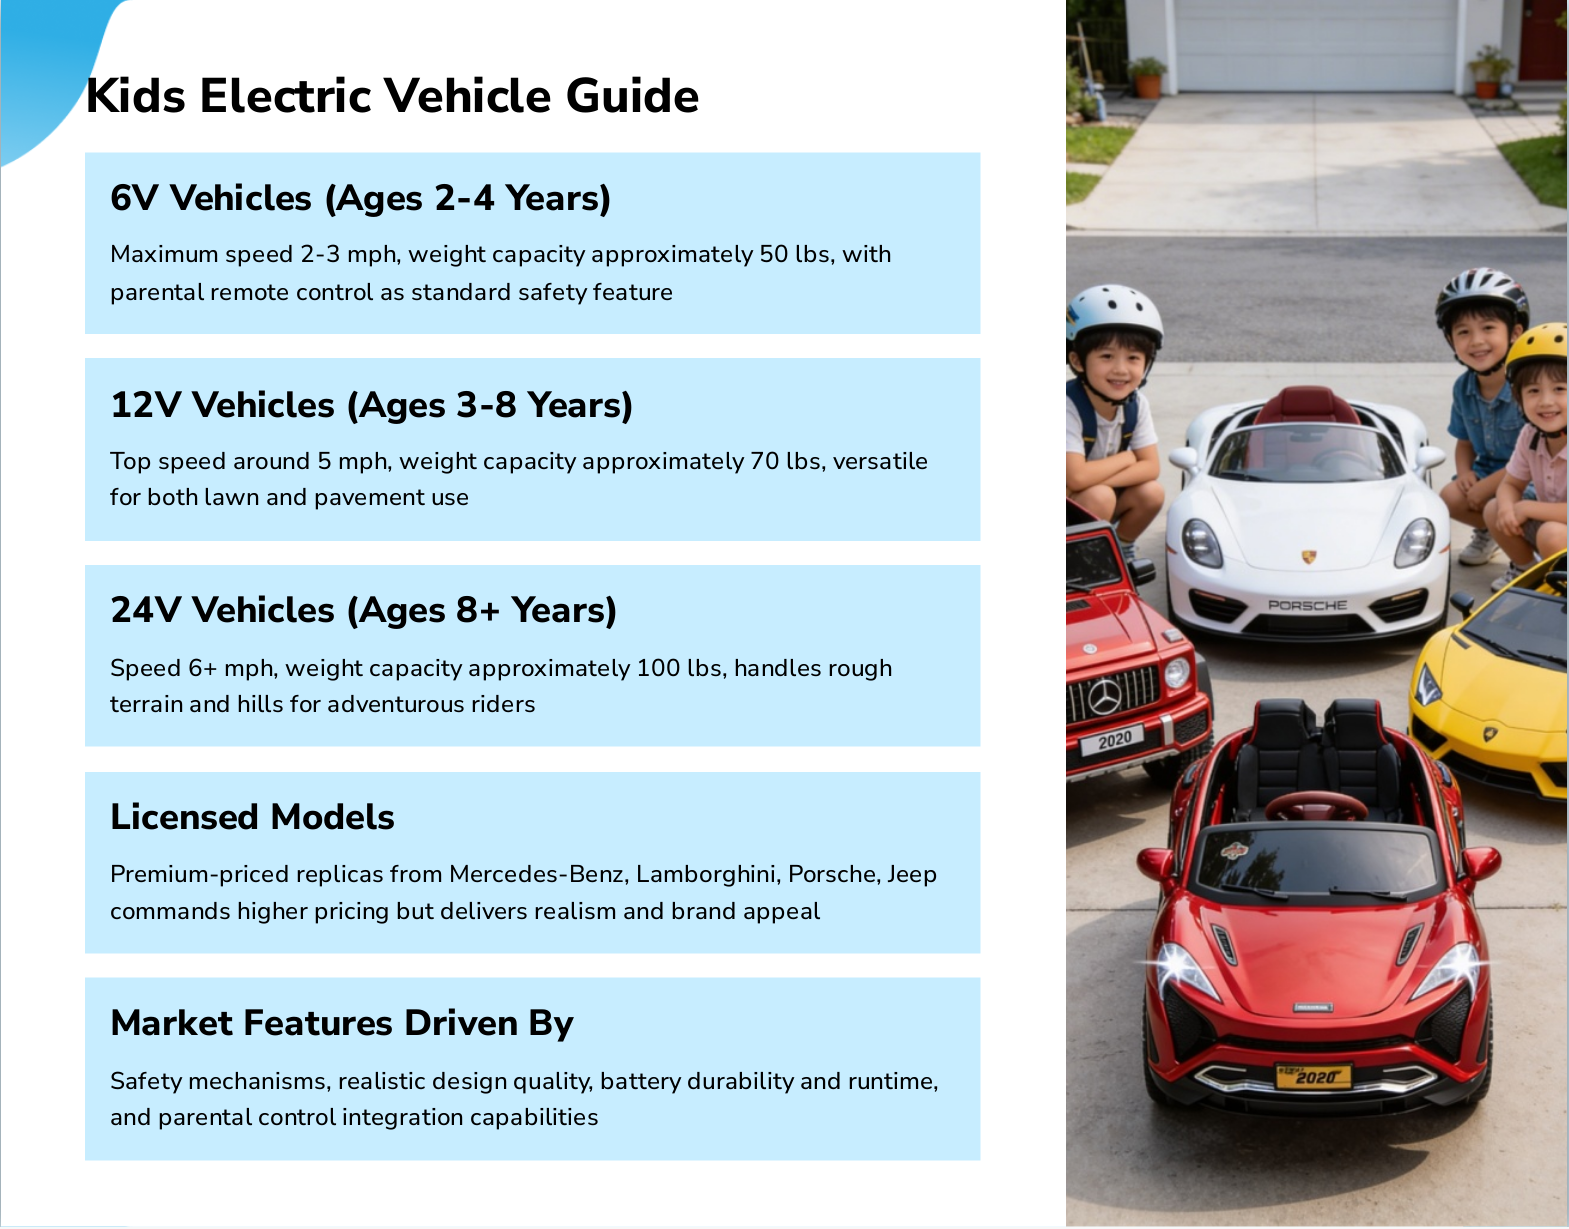
Slide 20: Kids Electric Vehicle Guide
- 6V Vehicles (Ages 2-4 Years): Maximum speed 2-3 mph, weight capacity approximately 50 lbs, with parental remote control as standard safety feature
- 12V Vehicles (Ages 3-8 Years): Top speed around 5 mph, weight capacity approximately 70 lbs, versatile for both lawn and pavement use
- 24V Vehicles (Ages 8+ Years): Speed 6+ mph, weight capacity approximately 100 lbs, handles rough terrain and hills for adventurous riders
- Licensed Models: Premium-priced replicas from Mercedes-Benz, Lamborghini, Porsche, Jeep commands higher pricing but delivers realism and brand appeal
- Market Features Driven By: Safety mechanisms, realistic design quality, battery durability and runtime, and parental control integration capabilities
Slide 21: Safety Standards for Electric Ride-On Cars
- Parental Remote Override: Essential for children under 6 years old, enabling immediate stop or directional correction, providing critical control during emergencies
- Progressive Independence Model: Matches developmental stages, gradually transferring control from parent to child as skills develop, ensuring age-appropriate autonomy
- Seatbelts and Harness Systems: Prevent ejection during sudden stops or uneven terrain navigation, keeping children securely positioned throughout the ride
- Soft-Start Technology: Prevents jerky acceleration that could startle younger riders or cause loss of control, ensuring smooth and safe acceleration
- Battery Isolation and Locked Charging Ports: Mandatory to prevent child contact with electrical hazards and prevent unauthorized access, protecting children from dangerous electrical components
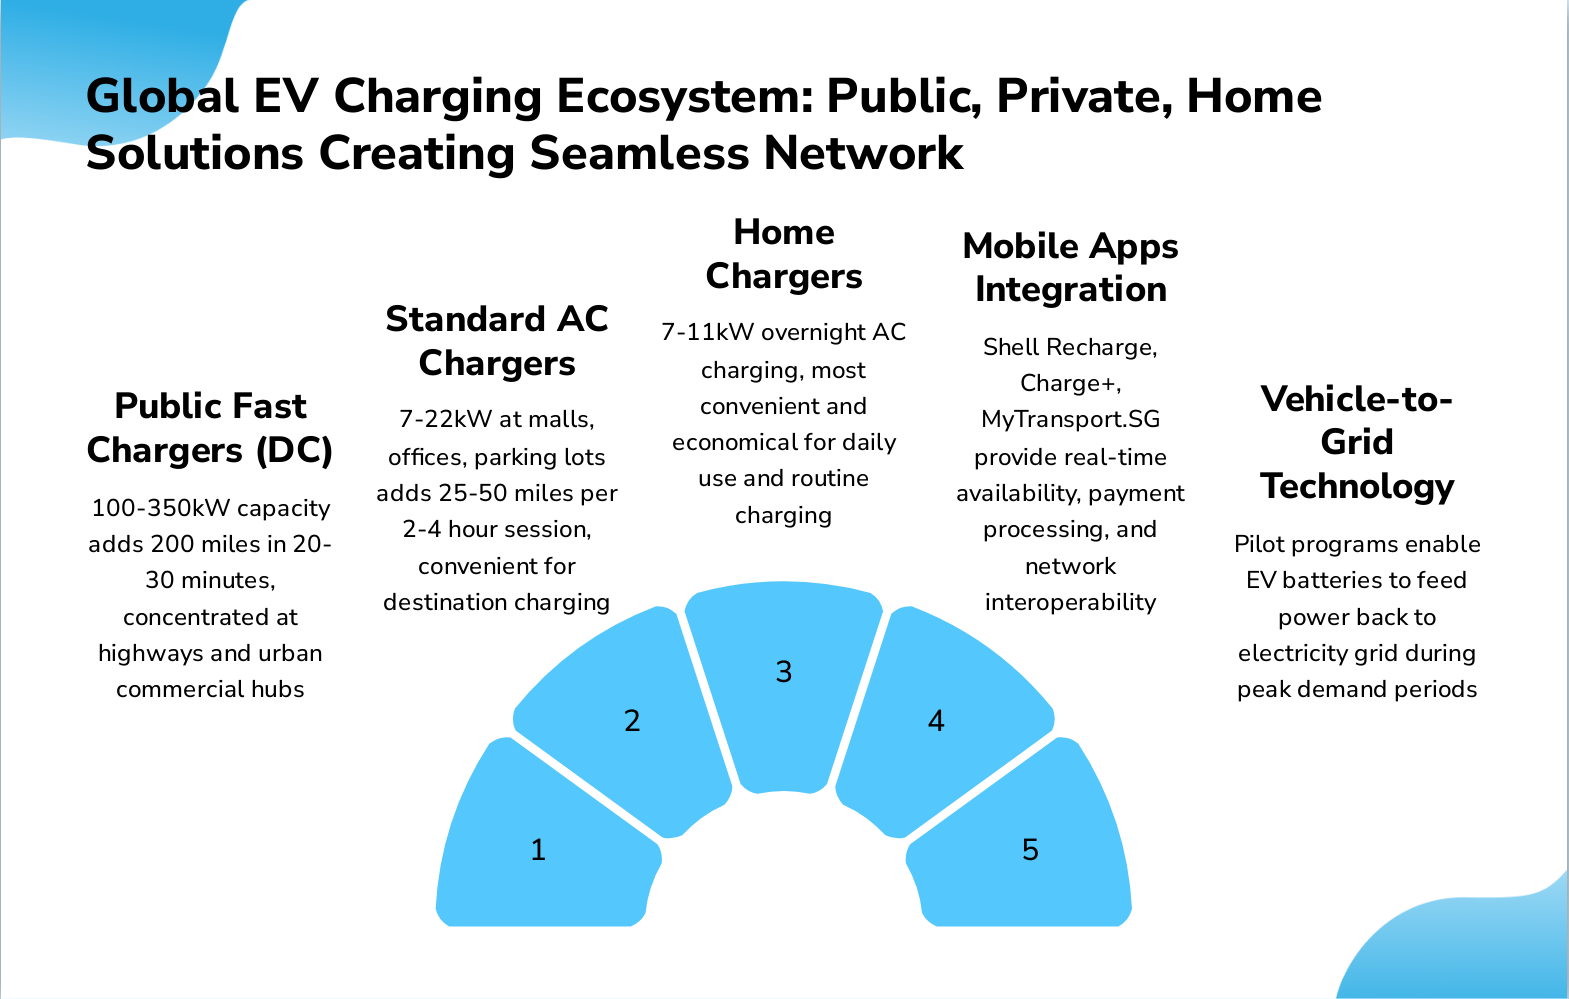
Slide 22: Global EV Charging Ecosystem: Public, Private, Home Solutions Creating Seamless Network
- Public Fast Chargers (DC): 100-350kW capacity adds 200 miles in 20-30 minutes, concentrated at highways and urban commercial hubs
- Standard AC Chargers: 7-22kW at malls, offices, parking lots adds 25-50 miles per 2-4 hour session, convenient for destination charging
- Home Chargers: 7-11kW overnight AC charging, most convenient and economical for daily use and routine charging
- Mobile Apps Integration: Shell Recharge, Charge+, MyTransport.SG provide real-time availability, payment processing, and network interoperability
- Vehicle-to-Grid Technology: Pilot programs enable EV batteries to feed power back to electricity grid during peak demand periods
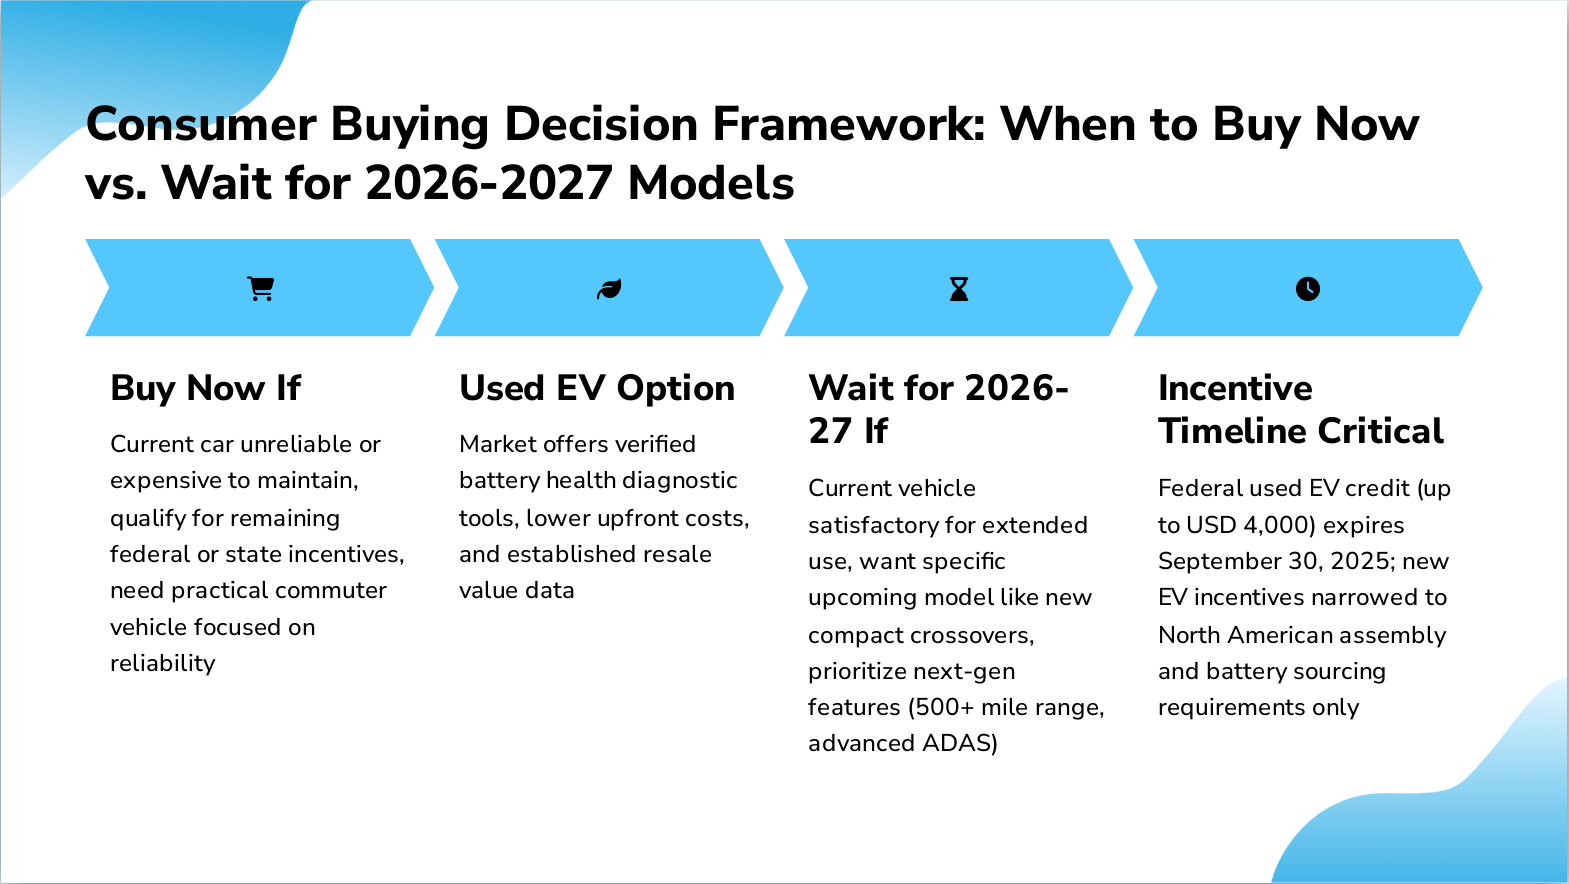
Slide 23: Consumer Buying Decision Framework: When to Buy Now vs. Wait for 2026-2027 Models
- Buy Now If: Current car unreliable or expensive to maintain, qualify for remaining federal or state incentives, need practical commuter vehicle focused on reliability
- Used EV Option: Market offers verified battery health diagnostic tools, lower upfront costs, and established resale value data
- Wait for 2026-27 If: Current vehicle satisfactory for extended use, want specific upcoming model like new compact crossovers, prioritize next-gen features (500+ mile range, advanced ADAS)
- Incentive Timeline Critical: Federal used EV credit (up to USD 4,000) expires September 30, 2025; new EV incentives narrowed to North American assembly and battery sourcing requirements only
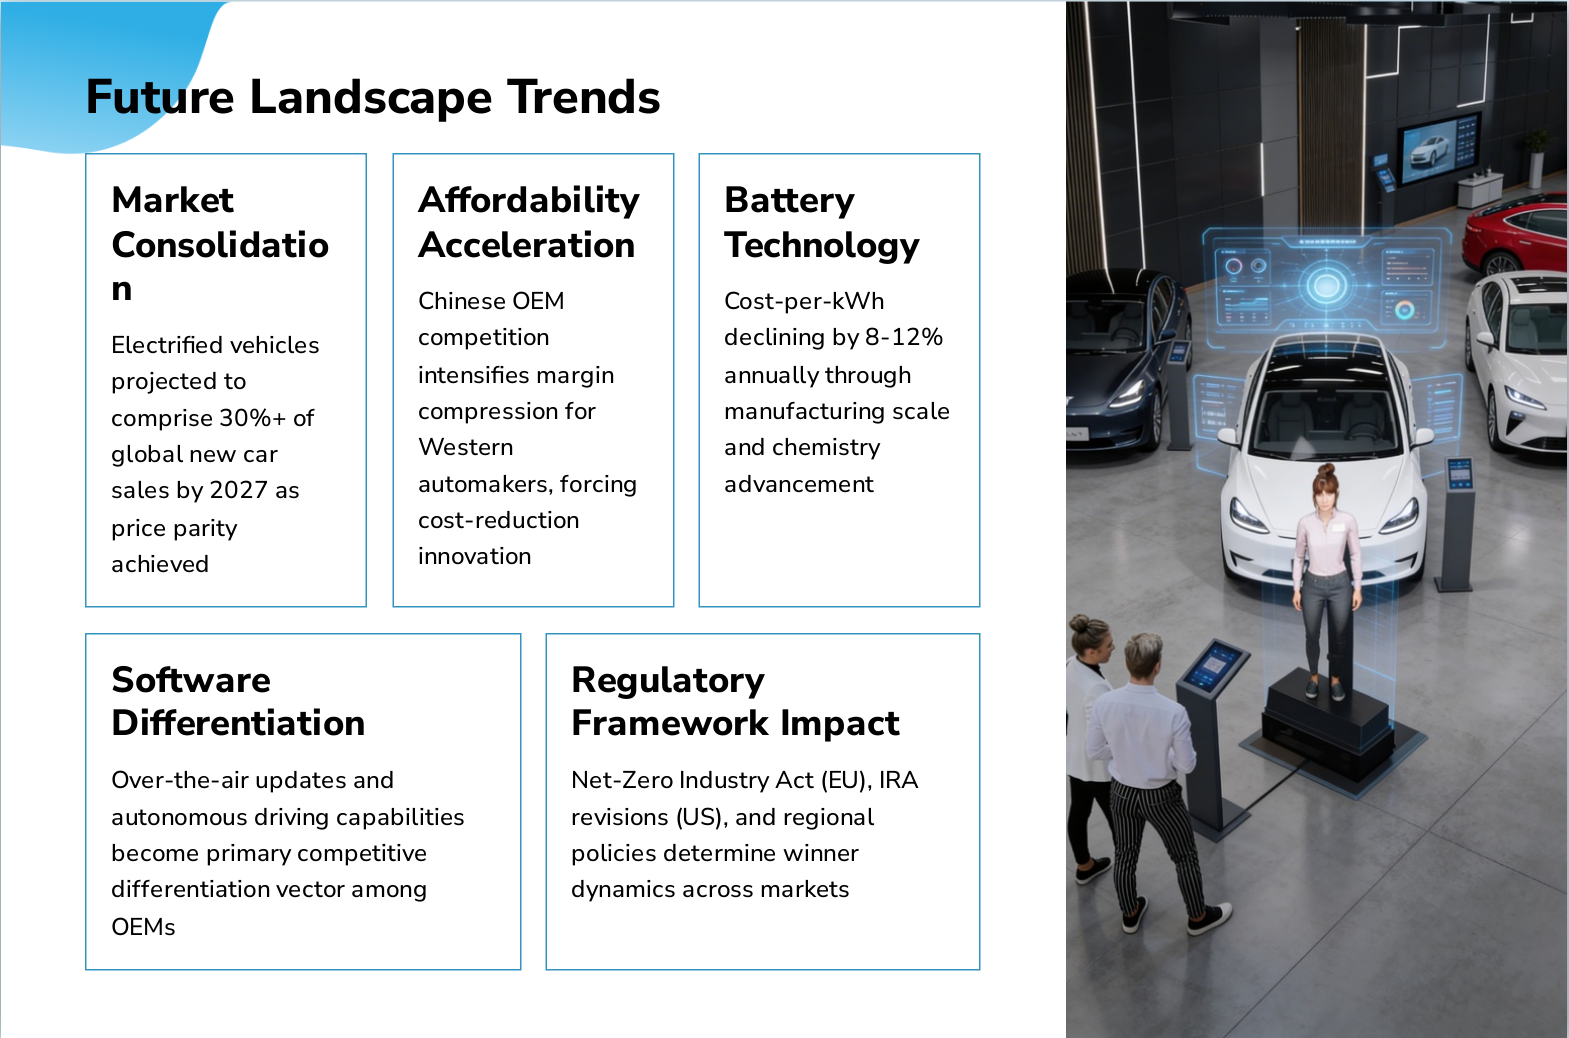
Slide 24: Future Landscape Trends
- Market Consolidation: Electrified vehicles projected to comprise 30%+ of global new car sales by 2027 as price parity achieved
- Affordability Acceleration: Chinese OEM competition intensifies margin compression for Western automakers, forcing cost-reduction innovation
- Battery Technology: Cost-per-kWh declining by 8-12% annually through manufacturing scale and chemistry advancement
- Software Differentiation: Over-the-air updates and autonomous driving capabilities become primary competitive differentiation vector among OEMs
- Regulatory Framework Impact: Net-Zero Industry Act (EU), IRA revisions (US), and regional policies determine winner dynamics across markets
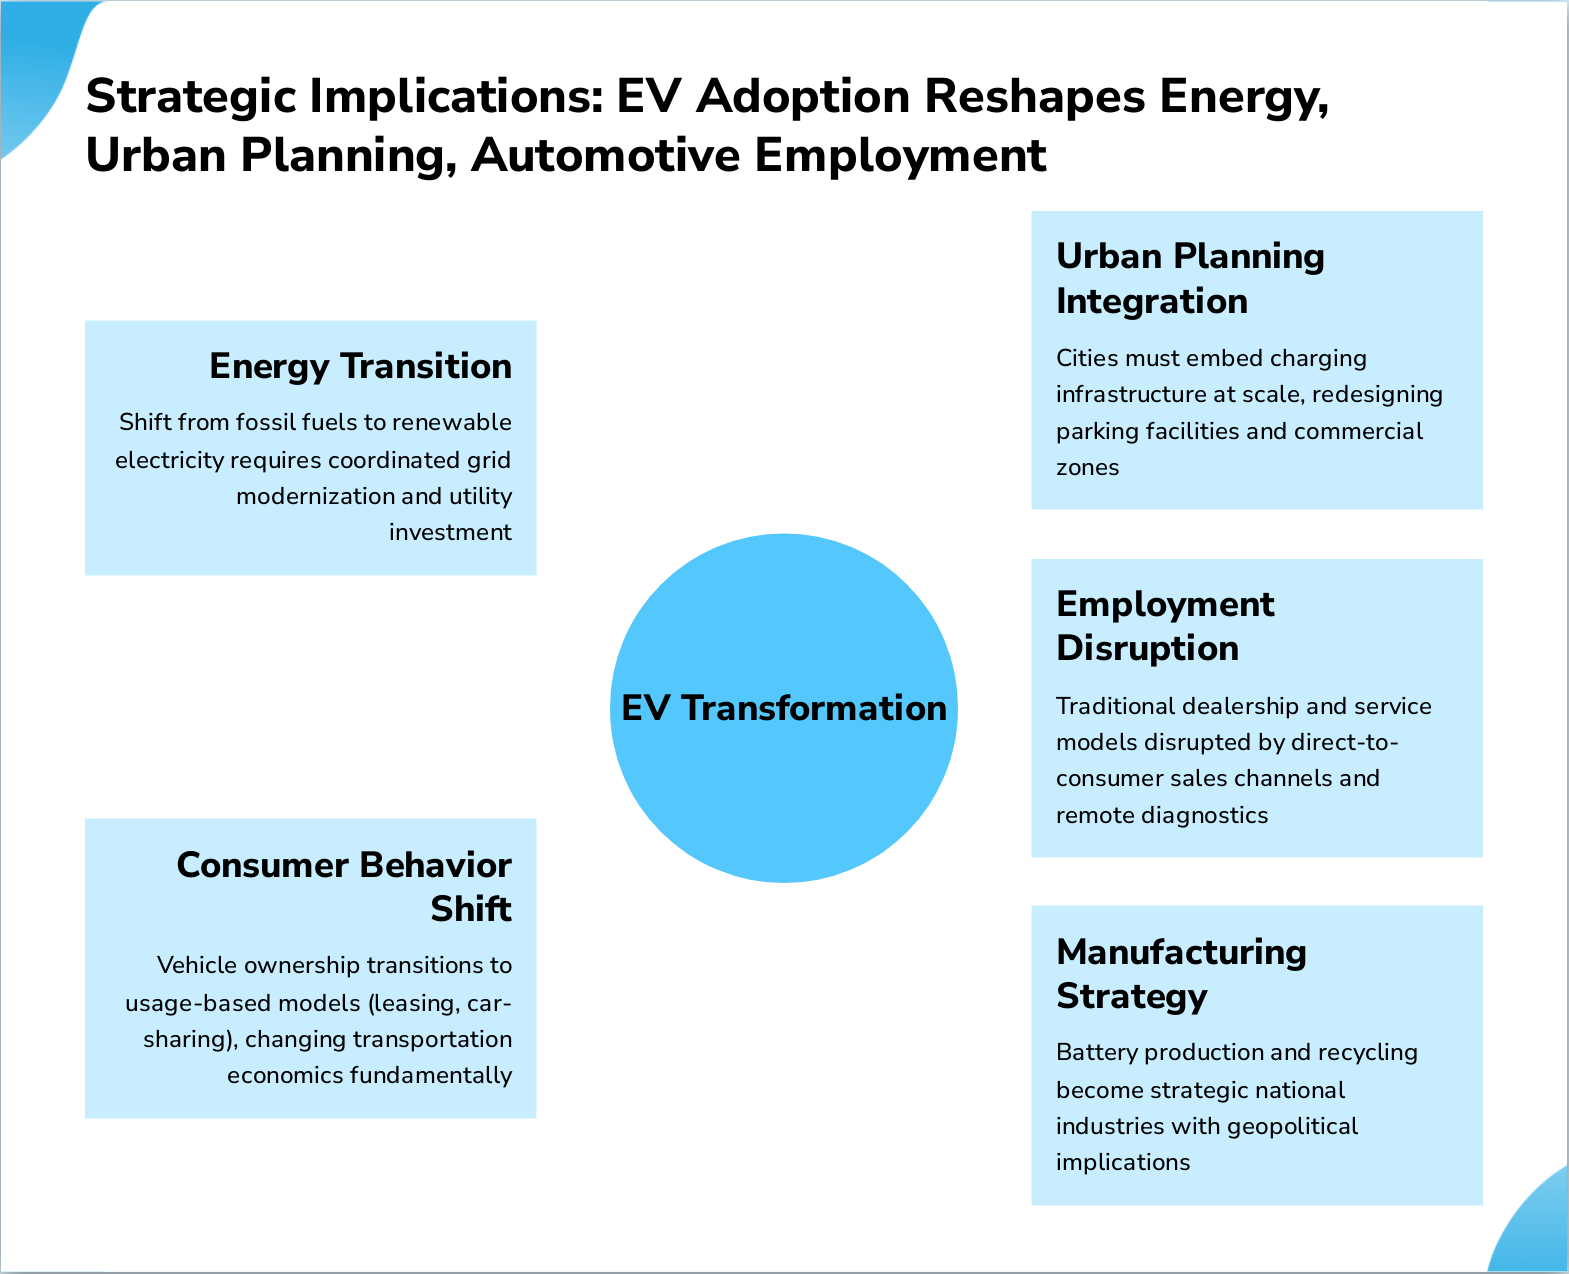
Slide 25: Strategic Implications: EV Adoption Reshapes Energy, Urban Planning, Automotive Employment
- Energy Transition: Shift from fossil fuels to renewable electricity requires coordinated grid modernization and utility investment
- Urban Planning Integration: Cities must embed charging infrastructure at scale, redesigning parking facilities and commercial zones
- Employment Disruption: Traditional dealership and service models disrupted by direct-to-consumer sales channels and remote diagnostics
- Manufacturing Strategy: Battery production and recycling become strategic national industries with geopolitical implications
- Consumer Behavior Shift: Vehicle ownership transitions to usage-based models (leasing, car-sharing), changing transportation economics fundamentally
Slide 26: Key Takeaway: Electric Vehicles Transition from Adoption Phase to Viability Phase Globally
Key Takeaway: Electric Vehicles Transition from Adoption Phase to Viability Phase Globally Market fundamentals now support EV growth independent of subsidies in mature markets. Infrastructure expansion enabling mass adoption. Technology innovation reaching cost parity. Environmental case decisive. C...