

Presentation Summary
Explore the Dow Jones Industrial Average, America's premier stock market benchmark, covering its history, structure, trading mechanisms, investment vehicles, and strategic application.
Full Presentation Transcript
Slide 1: The Dow Jones Industrial Average - America's Premier Stock Market Benchmark
Comprehensive Analysis of Structure, Mechanics, and Investment Opportunities
Slide 2: Contents
- I. Foundation and History: Origins, definition, and market significance
- II. Index Structure: Composition, calculation methodology, and blue-chip companies
- III. Trading Mechanisms: Futures contracts, E-mini specifications, and strategies
- IV. Investment Vehicles: ETF options, expense ratios, and performance
- V. Strategic Application: Sector analysis, portfolio strategies, and market outlook
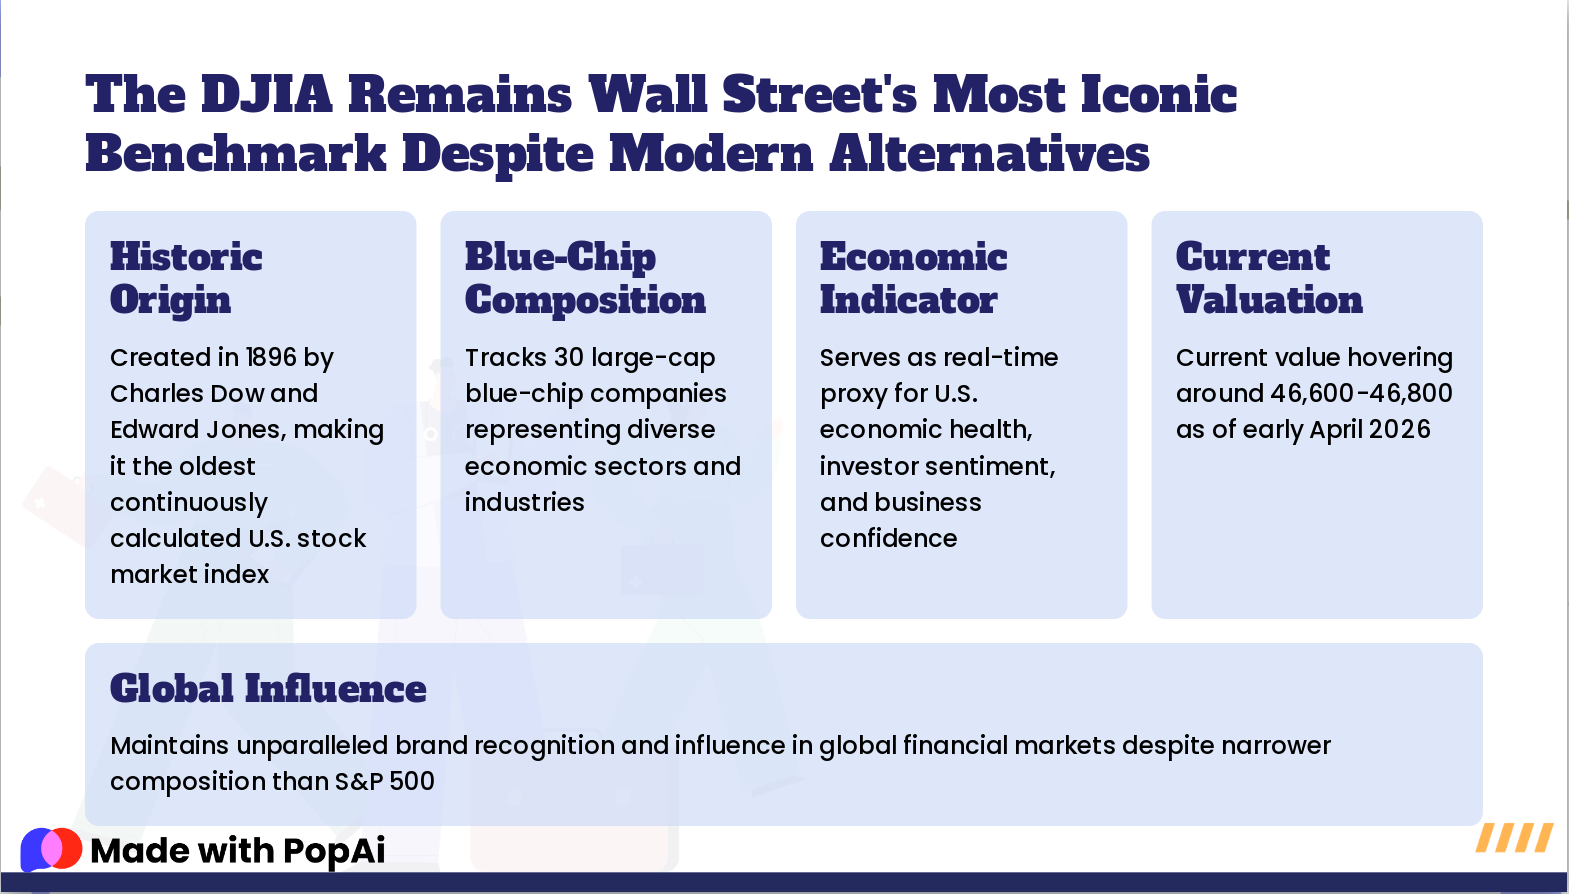
Slide 3: The DJIA Remains Wall Street's Most Iconic Benchmark Despite Modern Alternatives
- Historic Origin: Created in 1896 by Charles Dow and Edward Jones, making it the oldest continuously calculated U.S. stock market index
- Blue-Chip Composition: Tracks 30 large-cap blue-chip companies representing diverse economic sectors and industries
- Economic Indicator: Serves as real-time proxy for U.S. economic health, investor sentiment, and business confidence
- Current Valuation: Current value hovering around 46,600-46,800 as of early April 2026
- Global Influence: Maintains unparalleled brand recognition and influence in global financial markets despite narrower composition than S&P 500
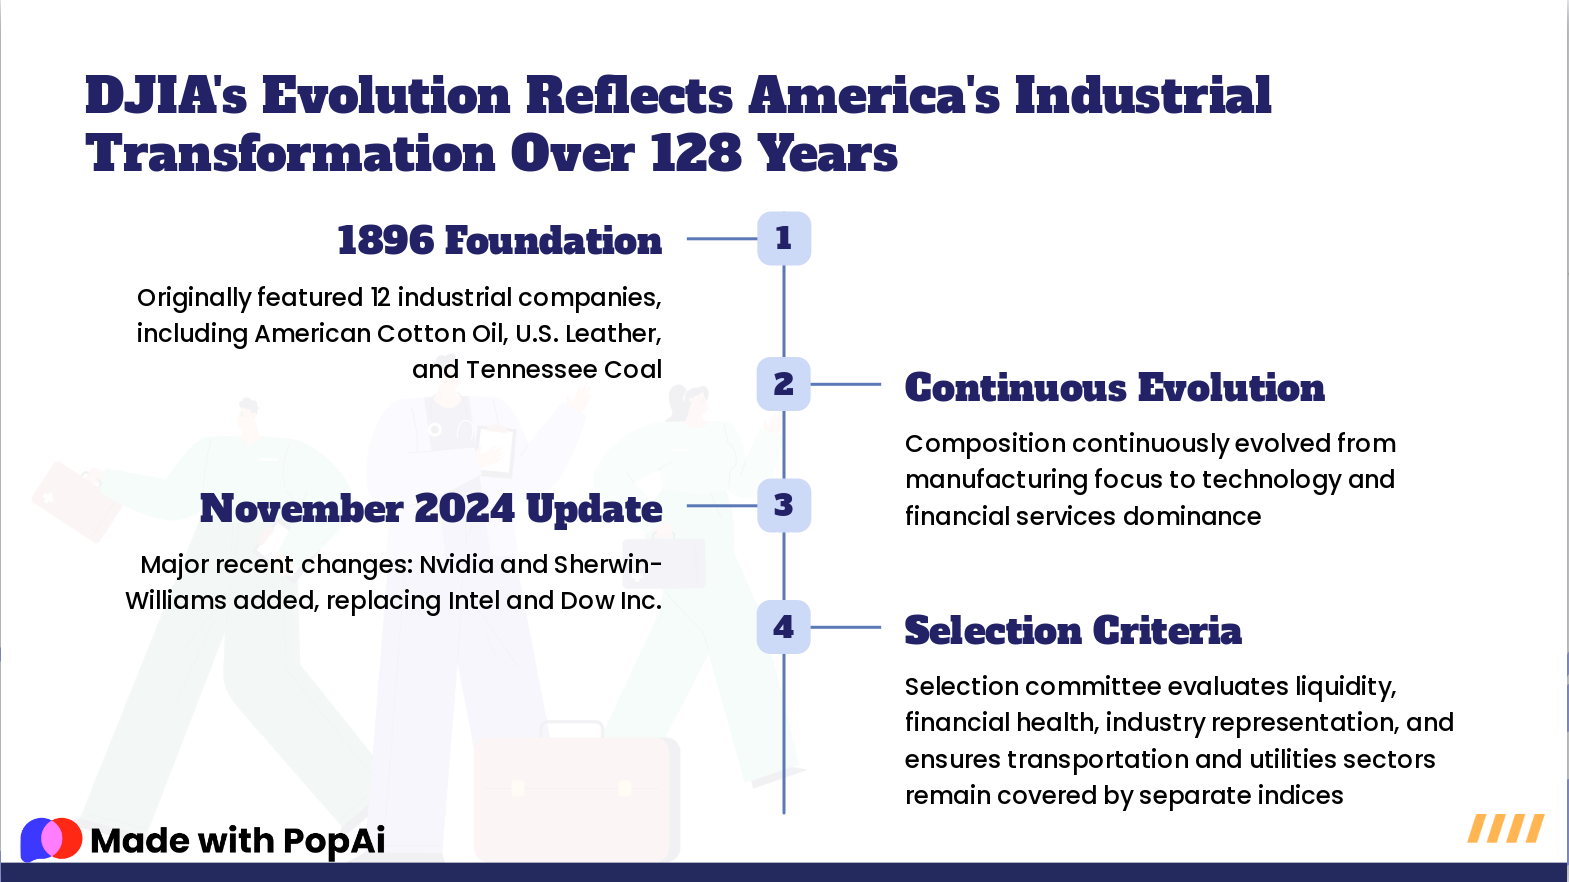
Slide 4: DJIA's Evolution Reflects America's Industrial Transformation Over 128 Years
- 1896 Foundation: Originally featured 12 industrial companies, including American Cotton Oil, U.S. Leather, and Tennessee Coal
- Continuous Evolution: Composition continuously evolved from manufacturing focus to technology and financial services dominance
- November 2024 Update: Major recent changes: Nvidia and Sherwin-Williams added, replacing Intel and Dow Inc.
- Selection Criteria: Selection committee evaluates liquidity, financial health, industry representation, and ensures transportation and utilities sectors remain covered by separate indices
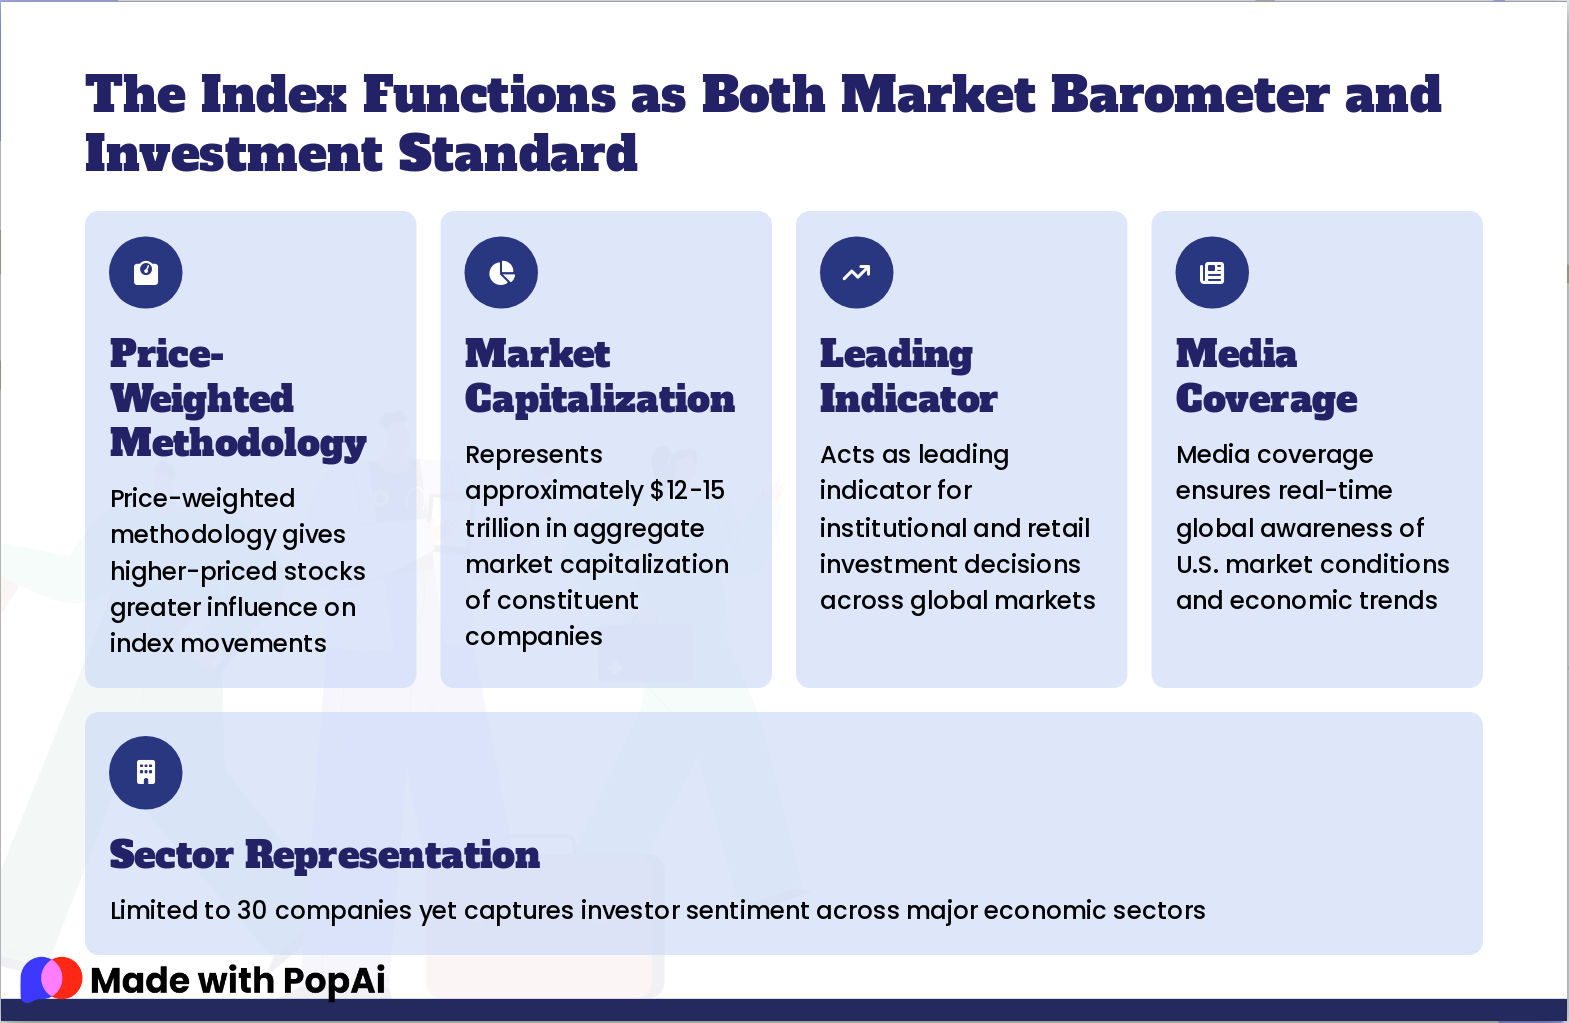
Slide 5: The Index Functions as Both Market Barometer and Investment Standard
- Price-Weighted Methodology: Price-weighted methodology gives higher-priced stocks greater influence on index movements
- Market Capitalization: Represents approximately $12-15 trillion in aggregate market capitalization of constituent companies
- Leading Indicator: Acts as leading indicator for institutional and retail investment decisions across global markets
- Media Coverage: Media coverage ensures real-time global awareness of U.S. market conditions and economic trends
- Sector Representation: Limited to 30 companies yet captures investor sentiment across major economic sectors
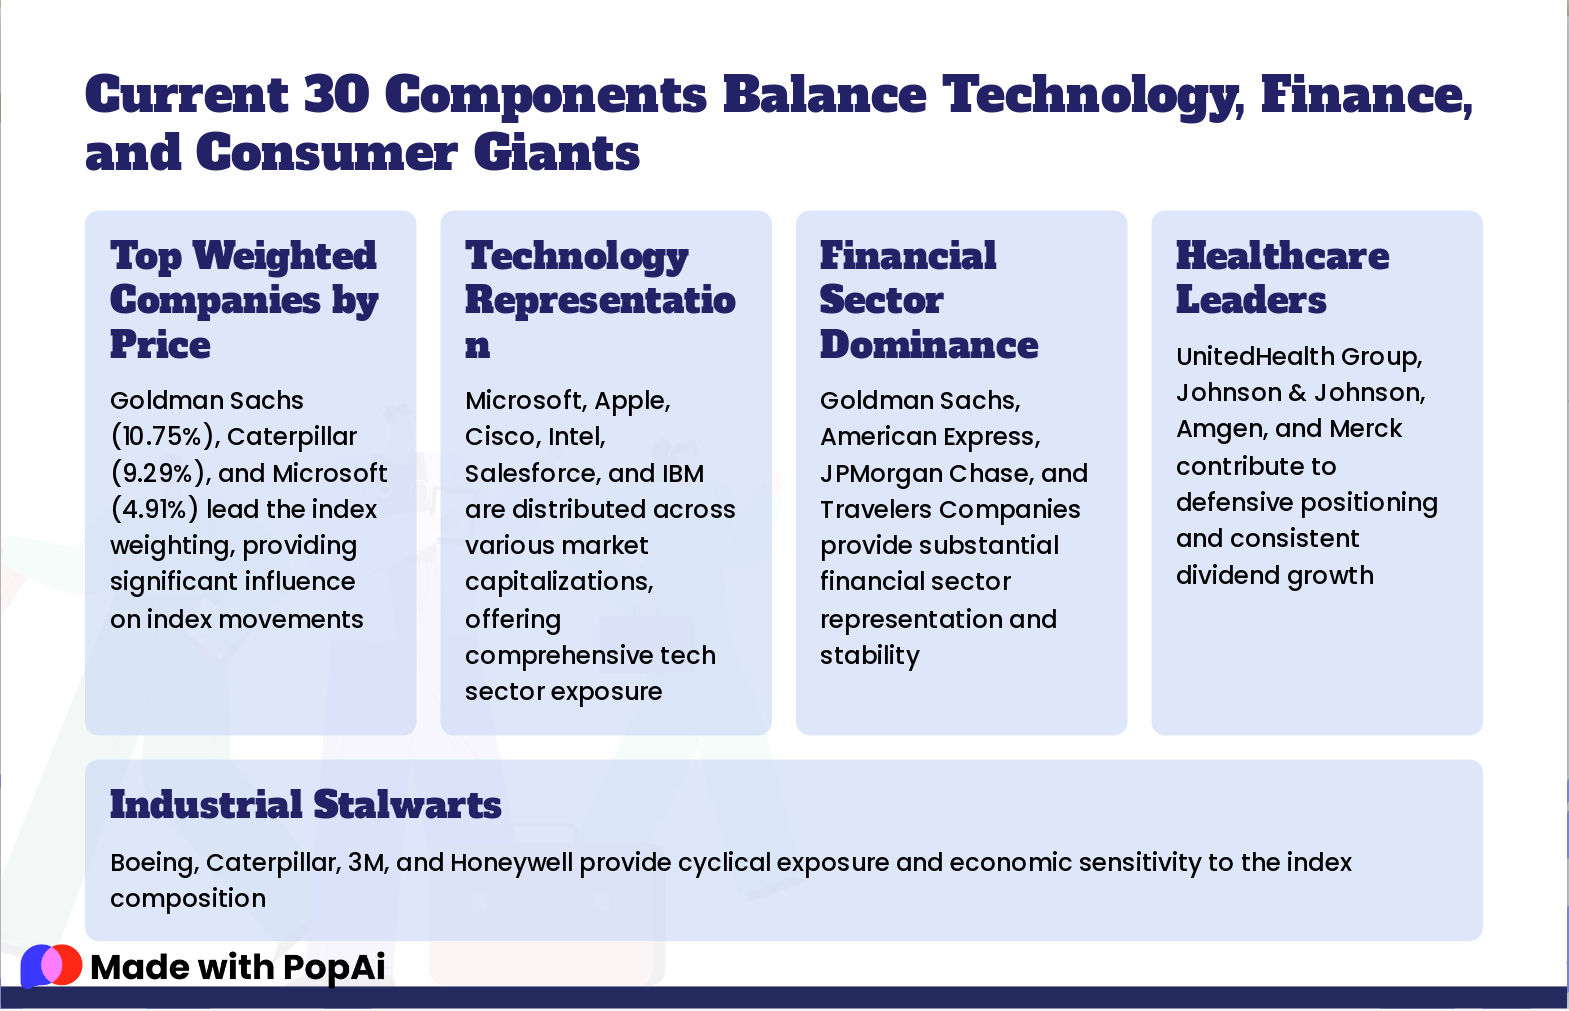
Slide 6: Current 30 Components Balance Technology, Finance, and Consumer Giants
- Top Weighted Companies by Price: Goldman Sachs (10.75%), Caterpillar (9.29%), and Microsoft (4.91%) lead the index weighting, providing significant influence on index movements
- Technology Representation: Microsoft, Apple, Cisco, Intel, Salesforce, and IBM are distributed across various market capitalizations, offering comprehensive tech sector exposure
- Financial Sector Dominance: Goldman Sachs, American Express, JPMorgan Chase, and Travelers Companies provide substantial financial sector representation and stability
- Healthcare Leaders: UnitedHealth Group, Johnson & Johnson, Amgen, and Merck contribute to defensive positioning and consistent dividend growth
- Industrial Stalwarts: Boeing, Caterpillar, 3M, and Honeywell provide cyclical exposure and economic sensitivity to the index composition
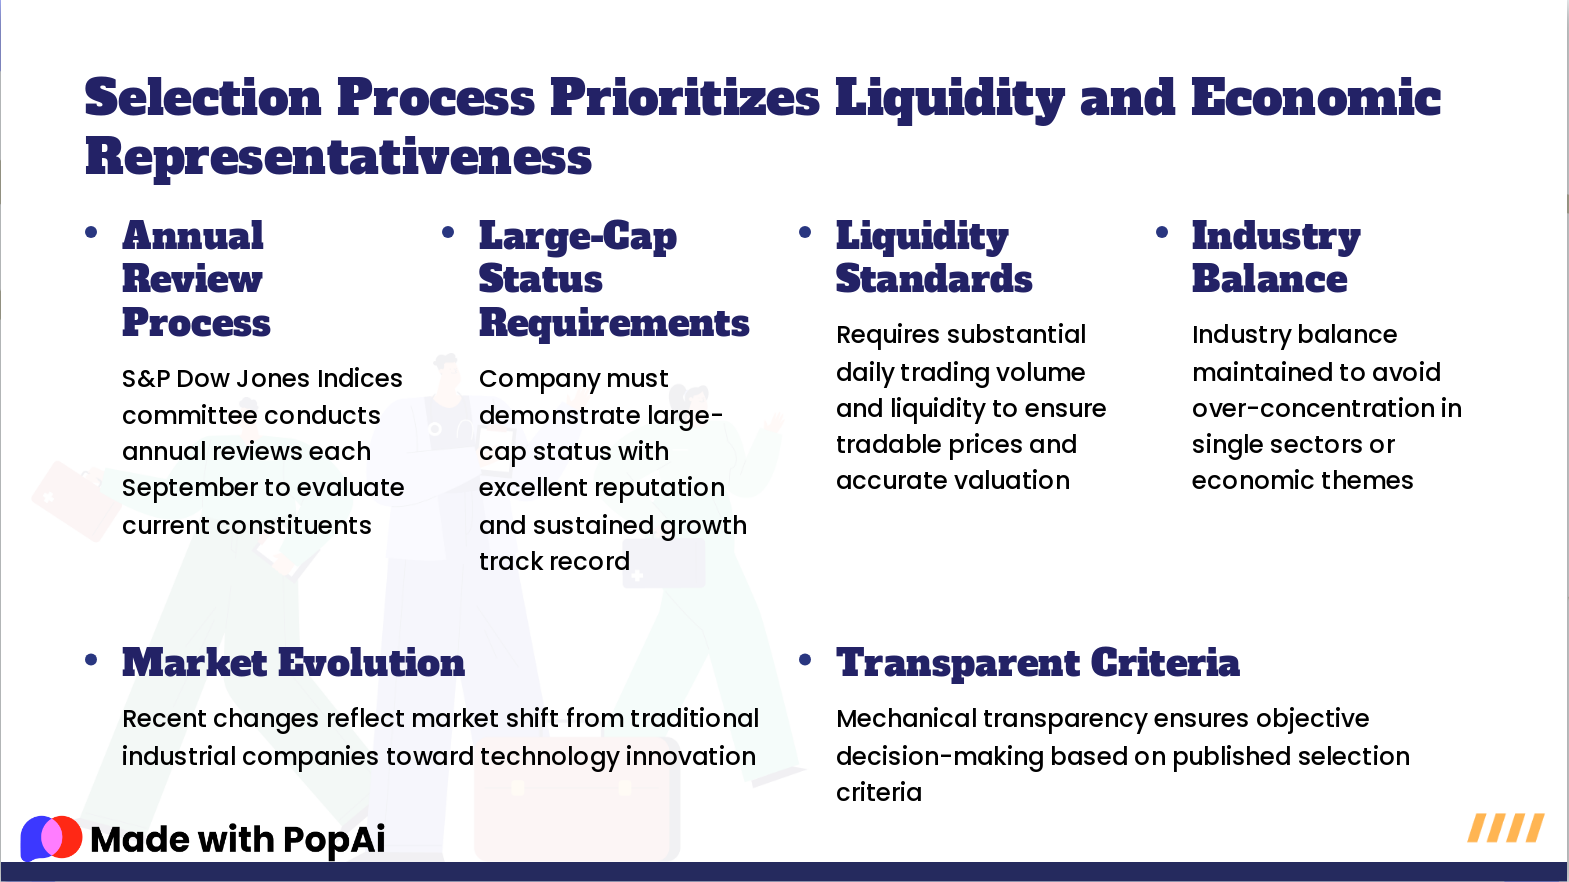
Slide 7: Selection Process Prioritizes Liquidity and Economic Representativeness
- Annual Review Process: S&P Dow Jones Indices committee conducts annual reviews each September to evaluate current constituents
- Large-Cap Status Requirements: Company must demonstrate large-cap status with excellent reputation and sustained growth track record
- Liquidity Standards: Requires substantial daily trading volume and liquidity to ensure tradable prices and accurate valuation
- Industry Balance: Industry balance maintained to avoid over-concentration in single sectors or economic themes
- Market Evolution: Recent changes reflect market shift from traditional industrial companies toward technology innovation
- Transparent Criteria: Mechanical transparency ensures objective decision-making based on published selection criteria
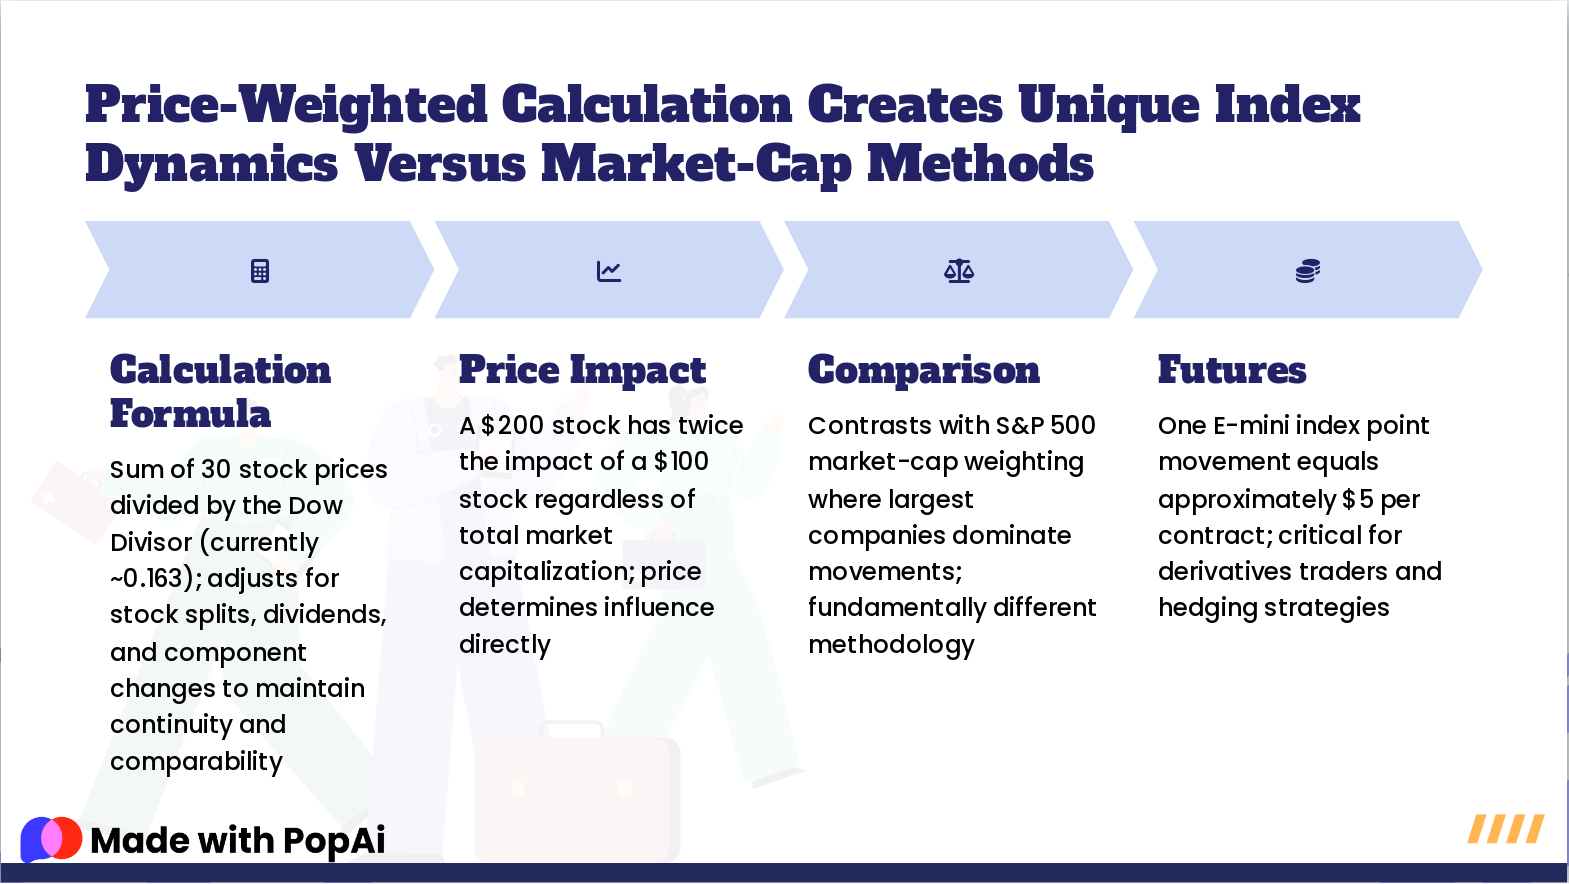
Slide 8: Price-Weighted Calculation Creates Unique Index Dynamics Versus Market-Cap Methods
- Calculation Formula: Sum of 30 stock prices divided by the Dow Divisor (currently ~0.163); adjusts for stock splits, dividends, and component changes to maintain continuity and comparability
- Price Impact: A $200 stock has twice the impact of a $100 stock regardless of total market capitalization; price determines influence directly
- Comparison: Contrasts with S&P 500 market-cap weighting where largest companies dominate movements; fundamentally different methodology
- Futures: One E-mini index point movement equals approximately $5 per contract; critical for derivatives traders and hedging strategies
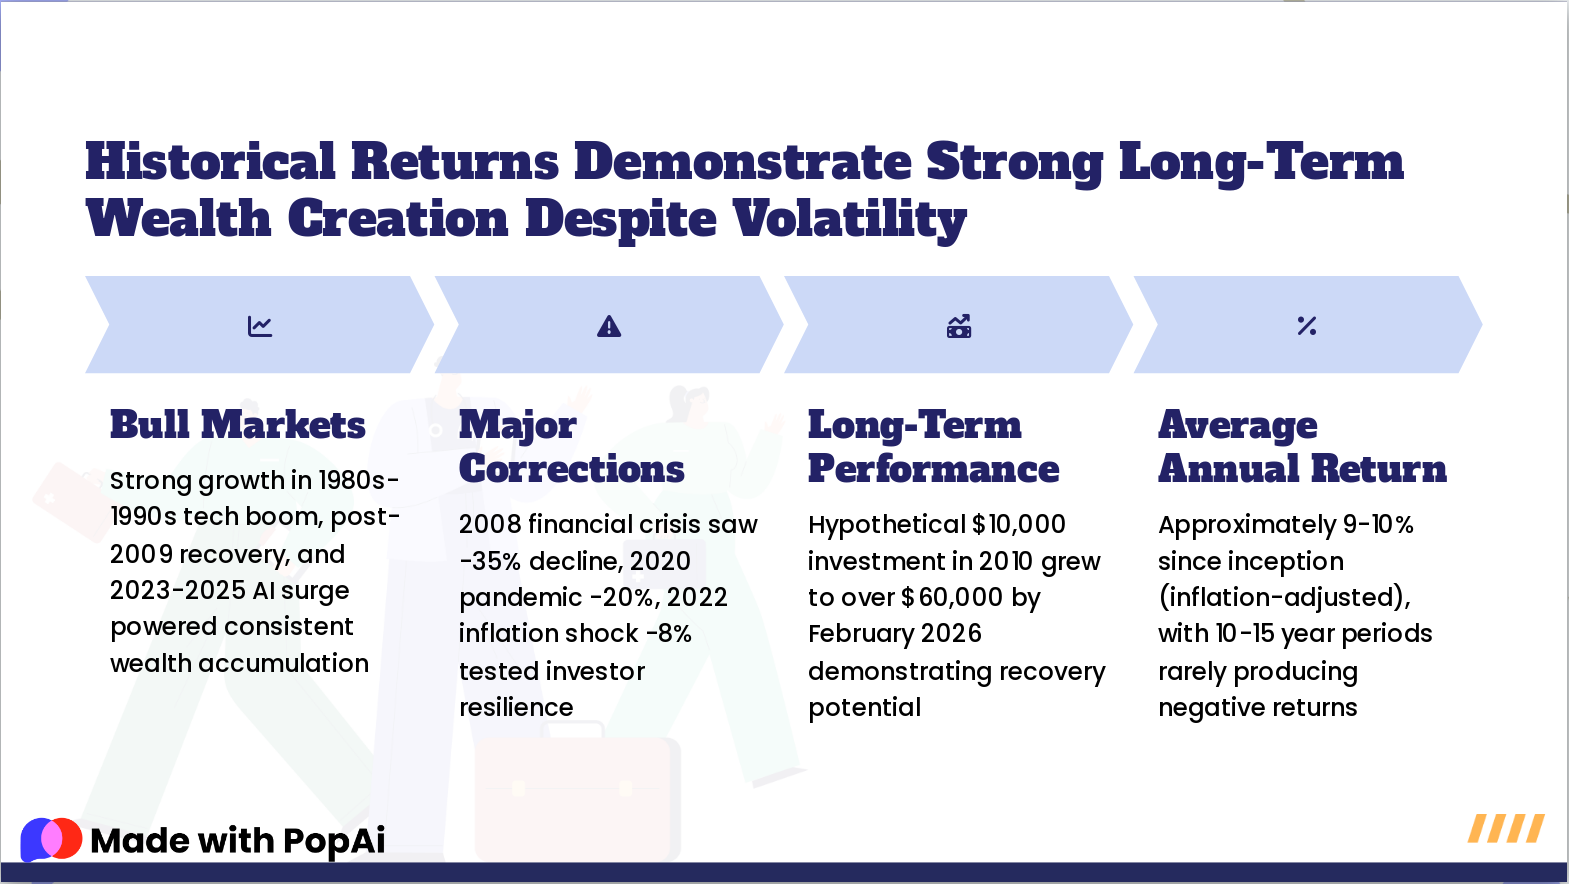
Slide 9: Historical Returns Demonstrate Strong Long-Term Wealth Creation Despite Volatility
- Bull Markets: Strong growth in 1980s-1990s tech boom, post-2009 recovery, and 2023-2025 AI surge powered consistent wealth accumulation
- Major Corrections: 2008 financial crisis saw -35% decline, 2020 pandemic -20%, 2022 inflation shock -8% tested investor resilience
- Long-Term Performance: Hypothetical $10,000 investment in 2010 grew to over $60,000 by February 2026 demonstrating recovery potential
- Average Annual Return: Approximately 9-10% since inception (inflation-adjusted), with 10-15 year periods rarely producing negative returns
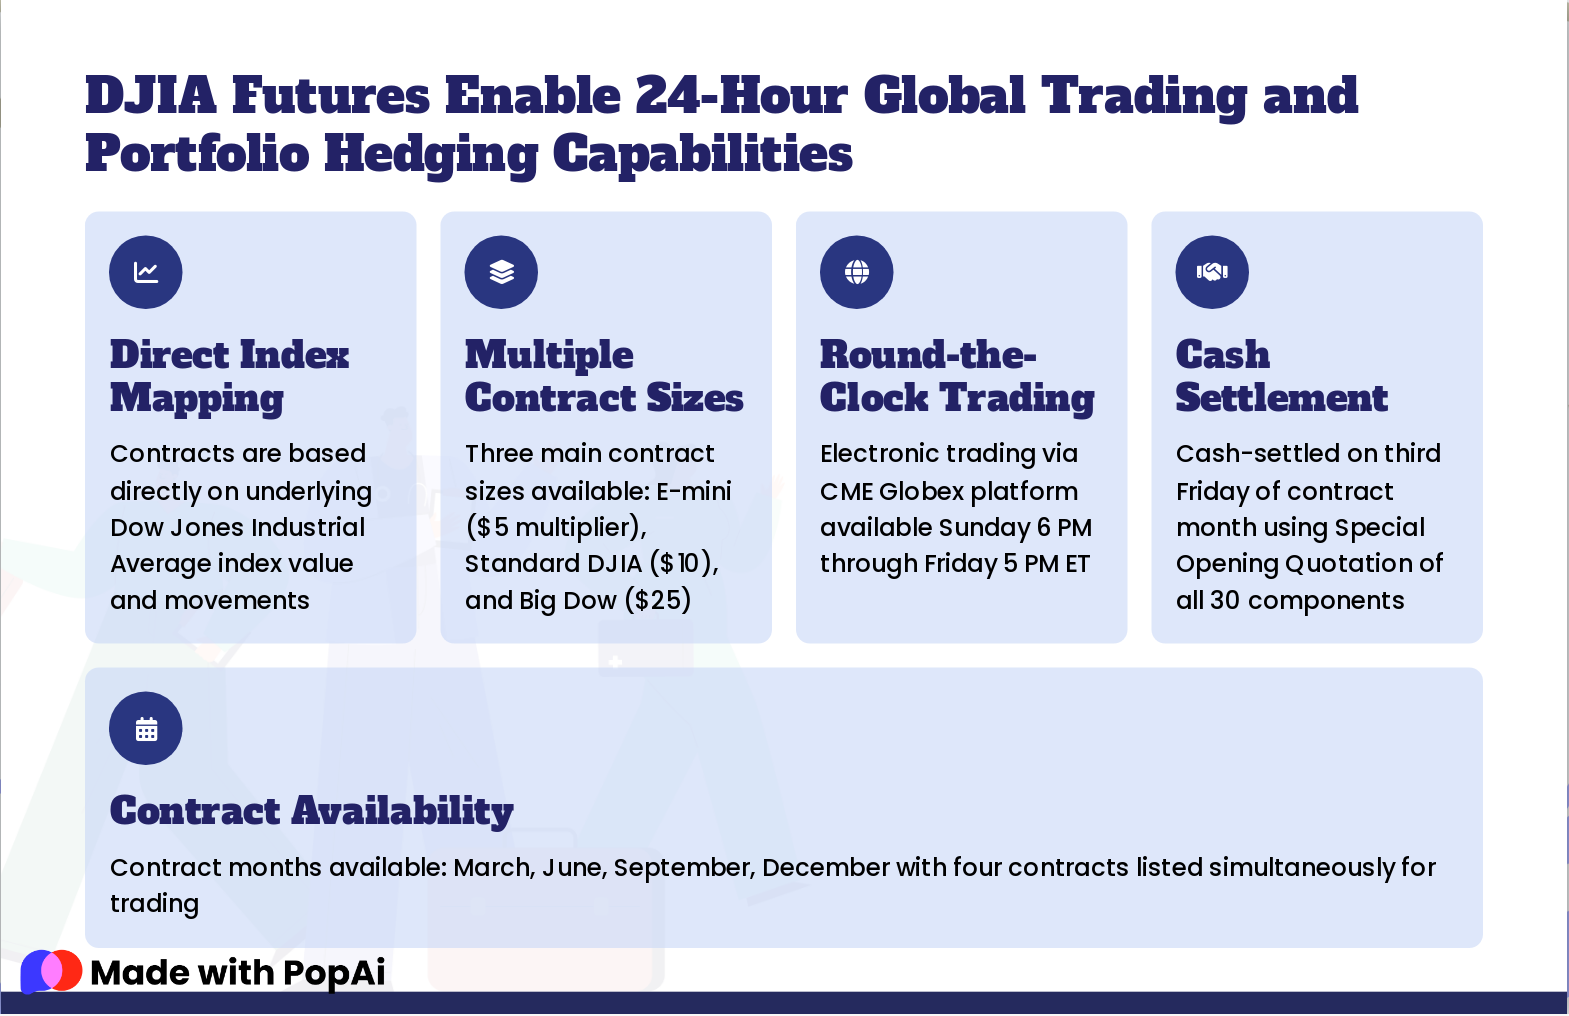
Slide 10: DJIA Futures Enable 24-Hour Global Trading and Portfolio Hedging Capabilities
- Direct Index Mapping: Contracts are based directly on underlying Dow Jones Industrial Average index value and movements
- Multiple Contract Sizes: Three main contract sizes available: E-mini ($5 multiplier), Standard DJIA ($10), and Big Dow ($25)
- Round-the-Clock Trading: Electronic trading via CME Globex platform available Sunday 6 PM through Friday 5 PM ET
- Cash Settlement: Cash-settled on third Friday of contract month using Special Opening Quotation of all 30 components
- Contract Availability: Contract months available: March, June, September, December with four contracts listed simultaneously for trading
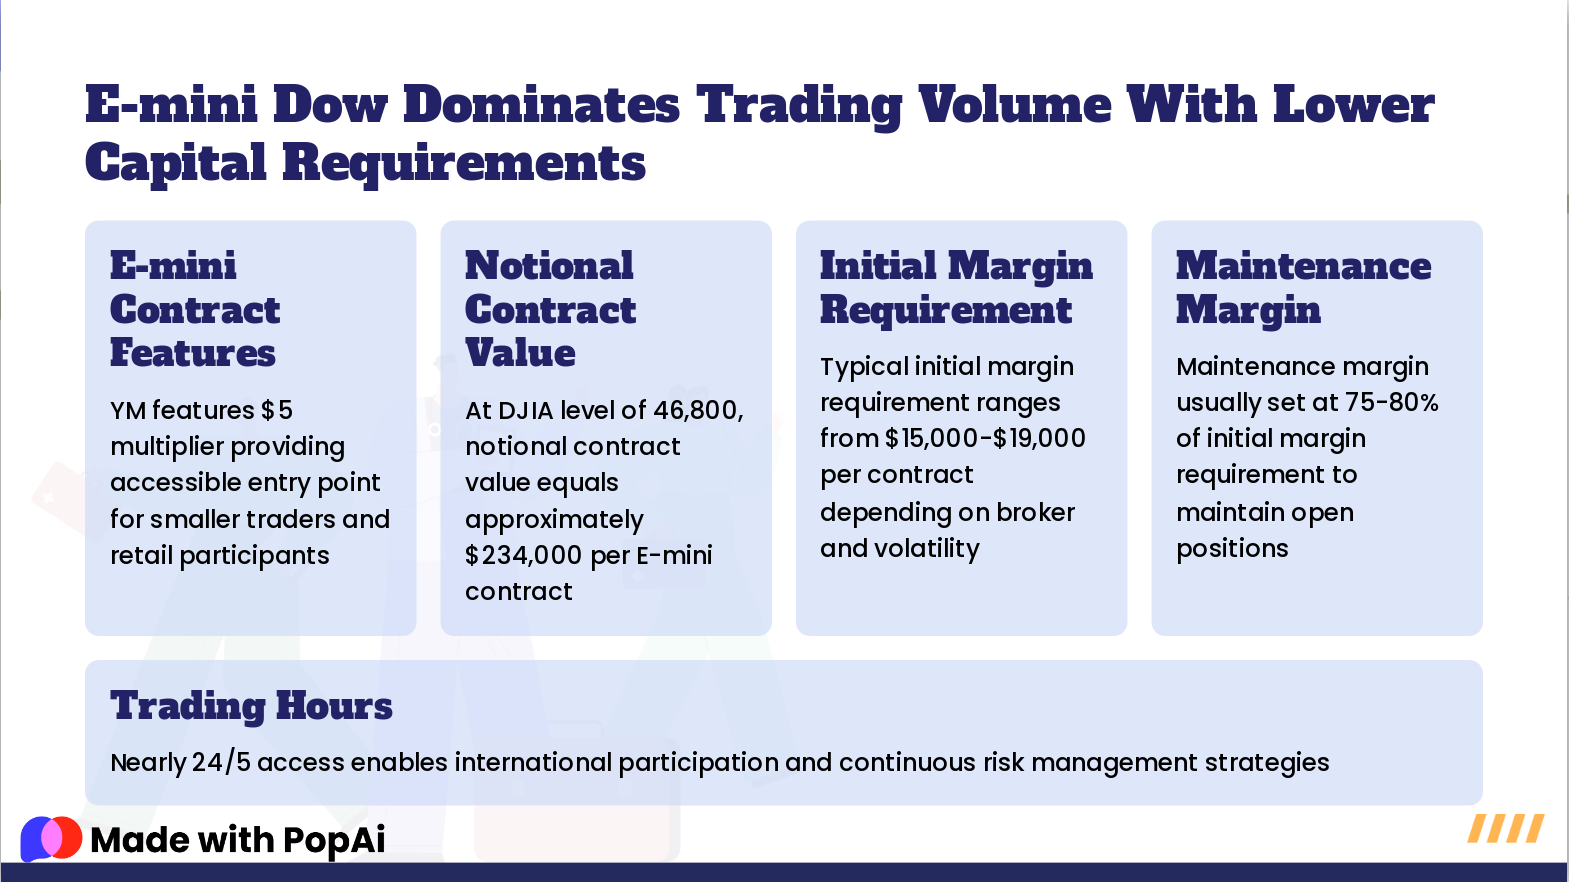
Slide 11: E-mini Dow Dominates Trading Volume With Lower Capital Requirements
- E-mini Contract Features: YM features $5 multiplier providing accessible entry point for smaller traders and retail participants
- Notional Contract Value: At DJIA level of 46,800, notional contract value equals approximately $234,000 per E-mini contract
- Initial Margin Requirement: Typical initial margin requirement ranges from $15,000-$19,000 per contract depending on broker and volatility
- Maintenance Margin: Maintenance margin usually set at 75-80% of initial margin requirement to maintain open positions
- Trading Hours: Nearly 24/5 access enables international participation and continuous risk management strategies
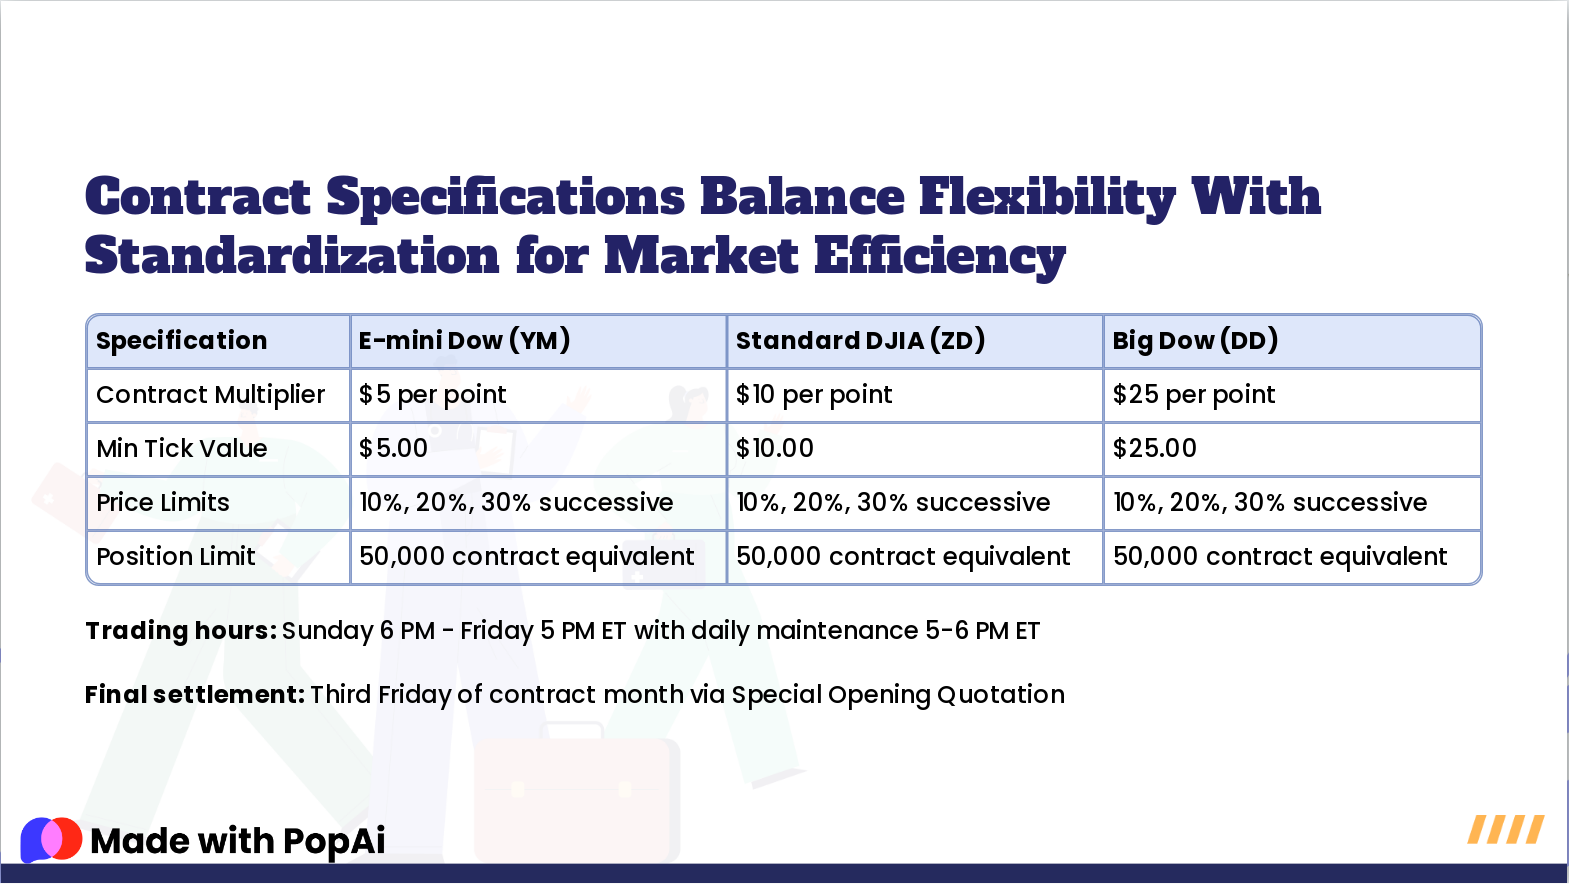
Slide 12: Contract Specifications Balance Flexibility With Standardization for Market Efficiency
Trading hours: Sunday 6 PM - Friday 5 PM ET with daily maintenance 5-6 PM ET
Final settlement: Third Friday of contract month via Special Opening Quotation
- Specification: Contract Multiplier, E-mini Dow (YM): $5 per point, Standard DJIA (ZD): $10 per point, Big Dow (DD): $25 per point
- Specification: Min Tick Value, E-mini Dow (YM): $5.00, Standard DJIA (ZD): $10.00, Big Dow (DD): $25.00
- Specification: Price Limits, E-mini Dow (YM): 10%, 20%, 30% successive, Standard DJIA (ZD): 10%, 20%, 30% successive, Big Dow (DD): 10%, 20%, 30% successive
- Specification: Position Limit, E-mini Dow (YM): 50,000 contract equivalent, Standard DJIA (ZD): 50,000 contract equivalent, Big Dow (DD): 50,000 contract equivalent
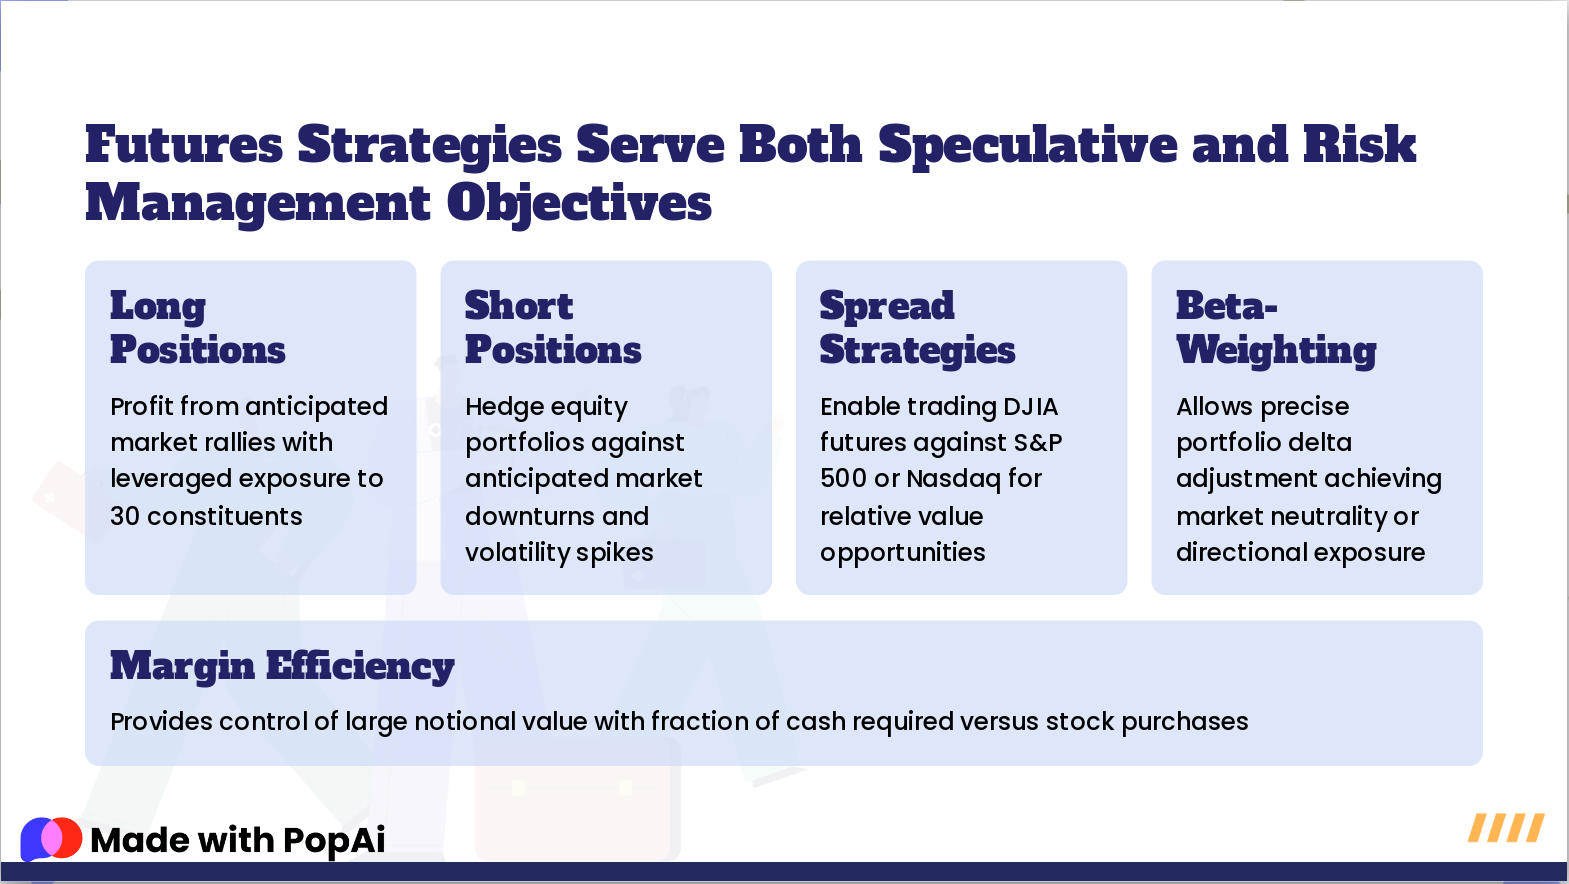
Slide 13: Futures Strategies Serve Both Speculative and Risk Management Objectives
- Long Positions: Profit from anticipated market rallies with leveraged exposure to 30 constituents
- Short Positions: Hedge equity portfolios against anticipated market downturns and volatility spikes
- Spread Strategies: Enable trading DJIA futures against S&P 500 or Nasdaq for relative value opportunities
- Beta-Weighting: Allows precise portfolio delta adjustment achieving market neutrality or directional exposure
- Margin Efficiency: Provides control of large notional value with fraction of cash required versus stock purchases
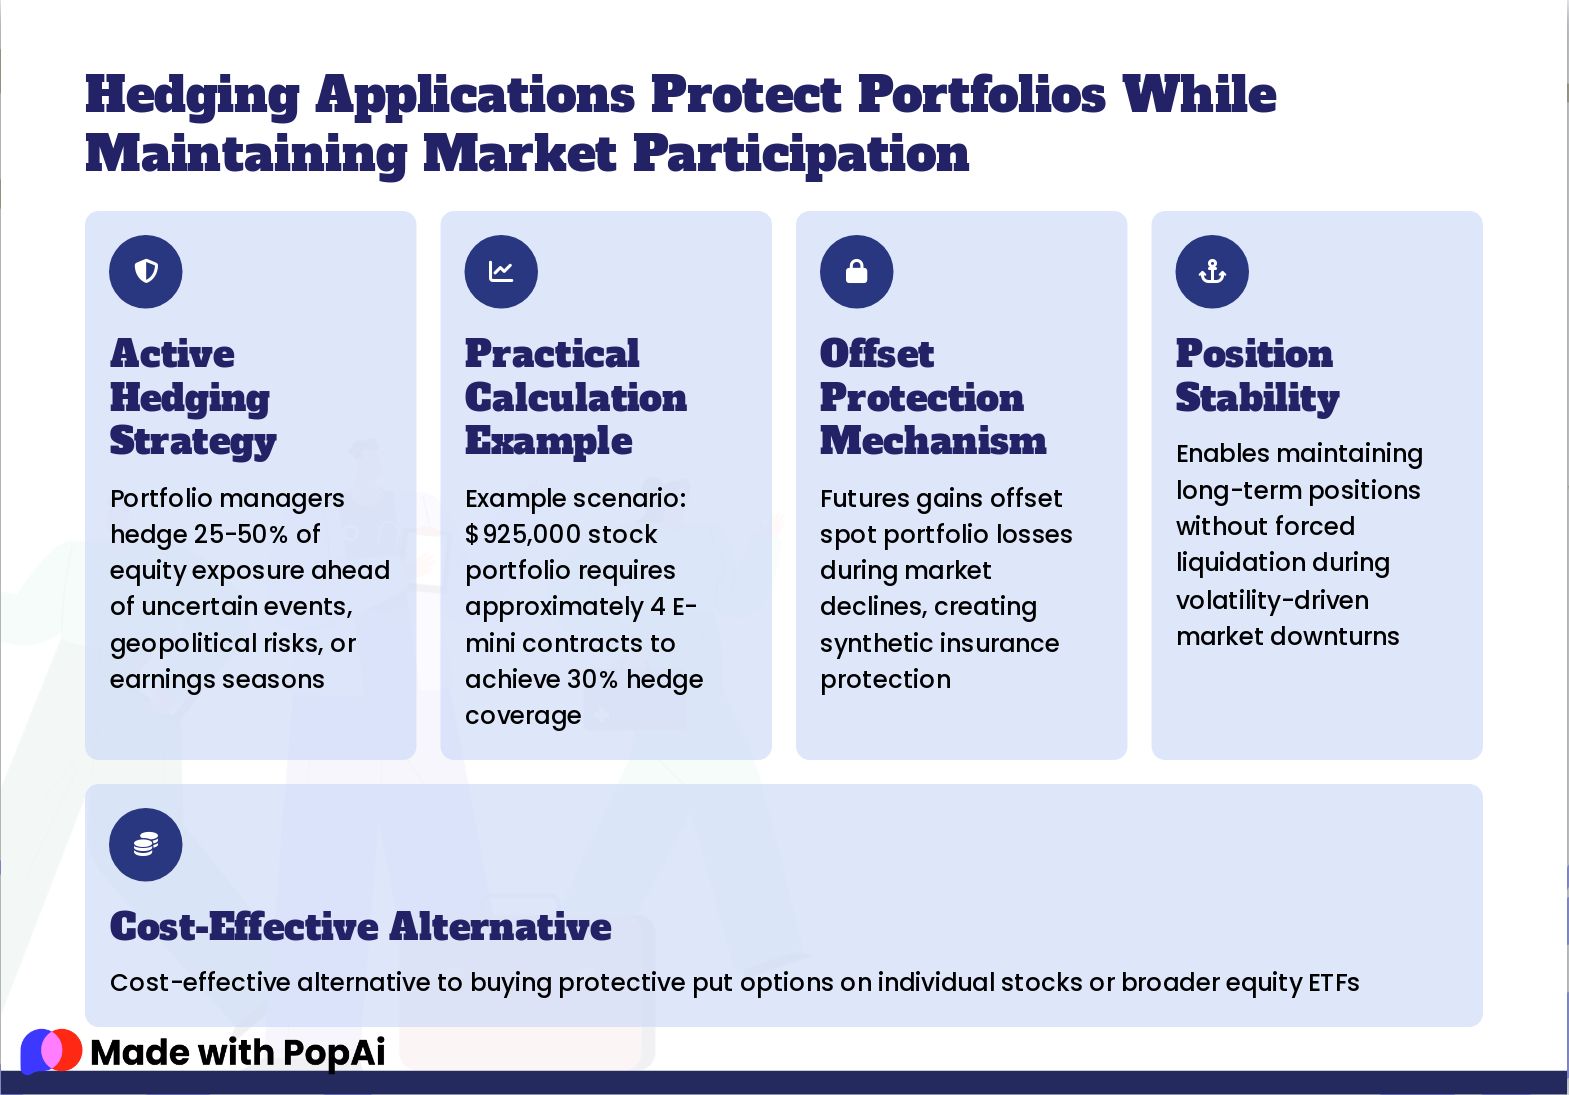
Slide 14: Hedging Applications Protect Portfolios While Maintaining Market Participation
- Active Hedging Strategy: Portfolio managers hedge 25-50% of equity exposure ahead of uncertain events, geopolitical risks, or earnings seasons
- Practical Calculation Example: Example scenario: $925,000 stock portfolio requires approximately 4 E-mini contracts to achieve 30% hedge coverage
- Offset Protection Mechanism: Futures gains offset spot portfolio losses during market declines, creating synthetic insurance protection
- Position Stability: Enables maintaining long-term positions without forced liquidation during volatility-driven market downturns
- Cost-Effective Alternative: Cost-effective alternative to buying protective put options on individual stocks or broader equity ETFs
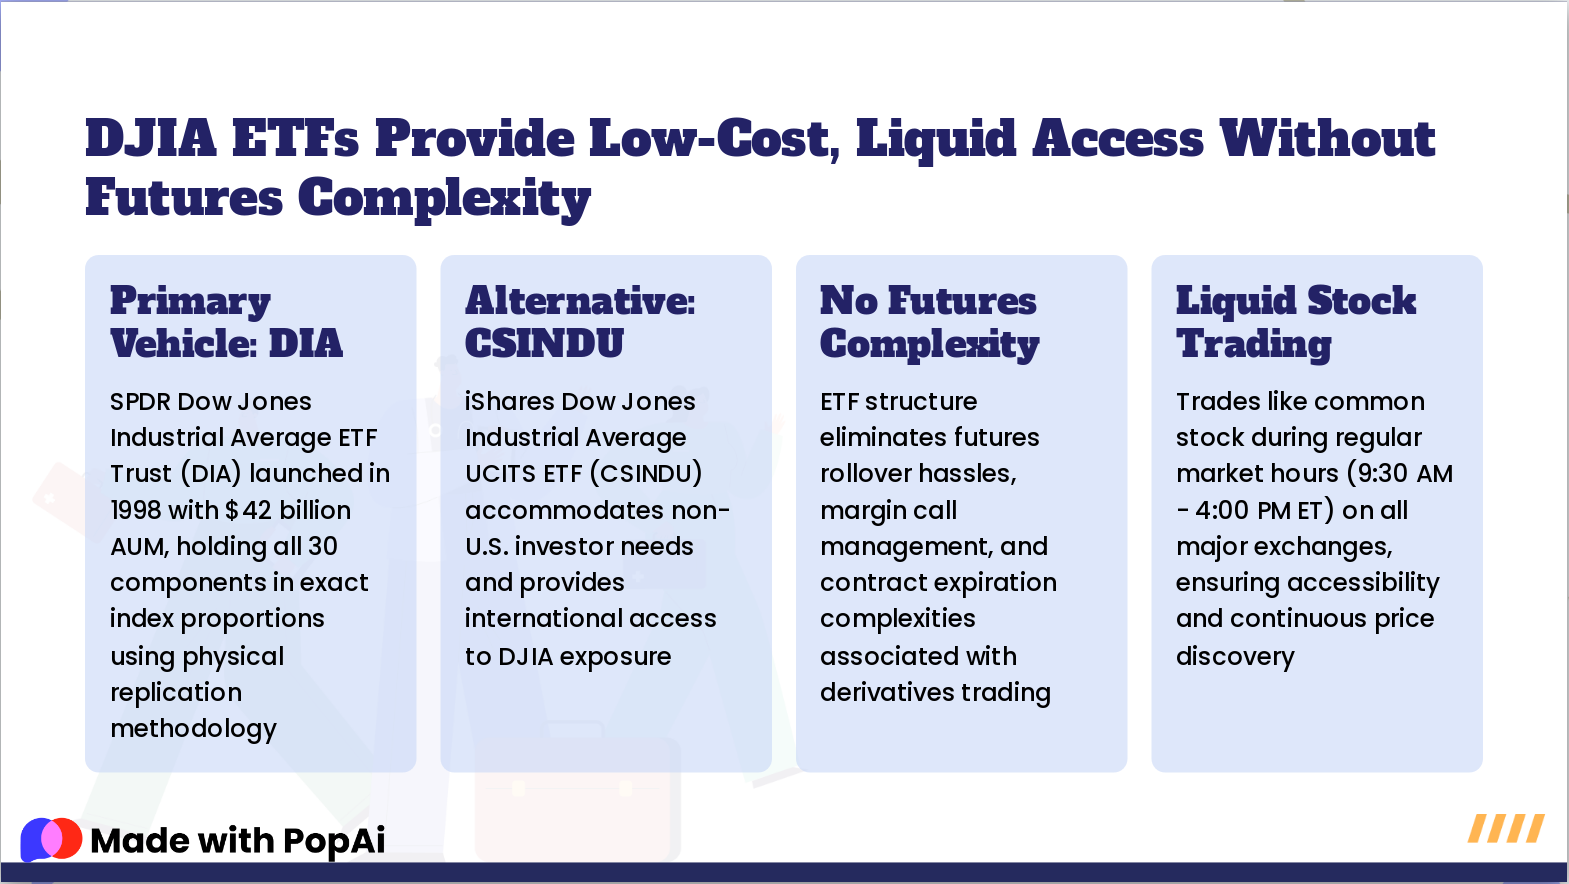
Slide 15: DJIA ETFs Provide Low-Cost, Liquid Access Without Futures Complexity
- Primary Vehicle: DIA: SPDR Dow Jones Industrial Average ETF Trust (DIA) launched in 1998 with $42 billion AUM, holding all 30 components in exact index proportions using physical replication methodology
- Alternative: CSINDU: iShares Dow Jones Industrial Average UCITS ETF (CSINDU) accommodates non-U.S. investor needs and provides international access to DJIA exposure
- No Futures Complexity: ETF structure eliminates futures rollover hassles, margin call management, and contract expiration complexities associated with derivatives trading
- Liquid Stock Trading: Trades like common stock during regular market hours (9:30 AM - 4:00 PM ET) on all major exchanges, ensuring accessibility and continuous price discovery
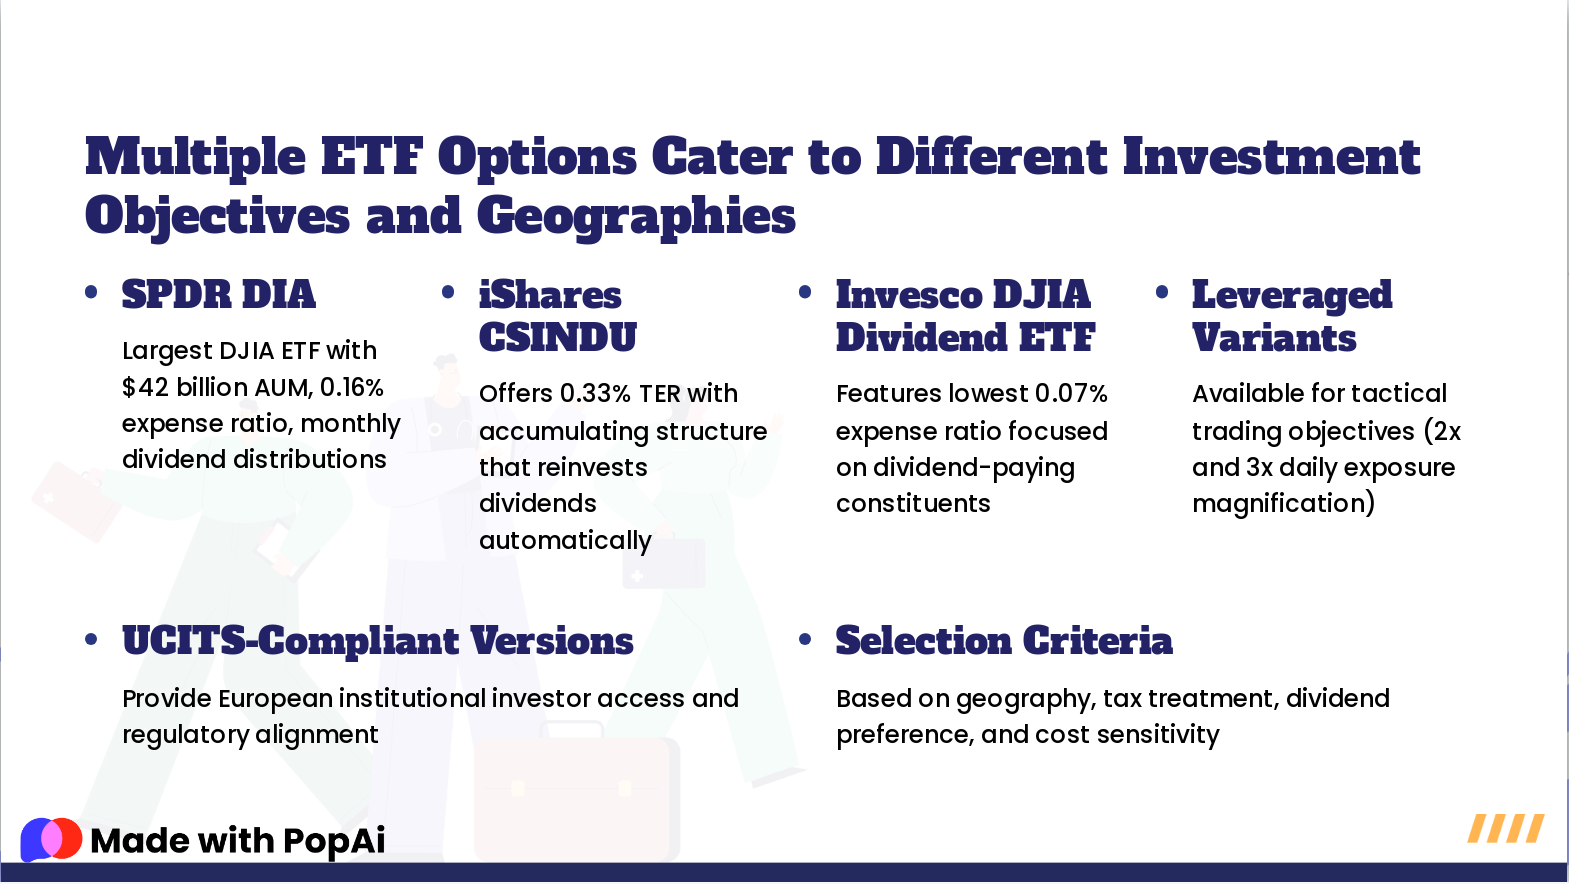
Slide 16: Multiple ETF Options Cater to Different Investment Objectives and Geographies
- SPDR DIA: Largest DJIA ETF with $42 billion AUM, 0.16% expense ratio, monthly dividend distributions
- iShares CSINDU: Offers 0.33% TER with accumulating structure that reinvests dividends automatically
- Invesco DJIA Dividend ETF: Features lowest 0.07% expense ratio focused on dividend-paying constituents
- Leveraged Variants: Available for tactical trading objectives (2x and 3x daily exposure magnification)
- UCITS-Compliant Versions: Provide European institutional investor access and regulatory alignment
- Selection Criteria: Based on geography, tax treatment, dividend preference, and cost sensitivity
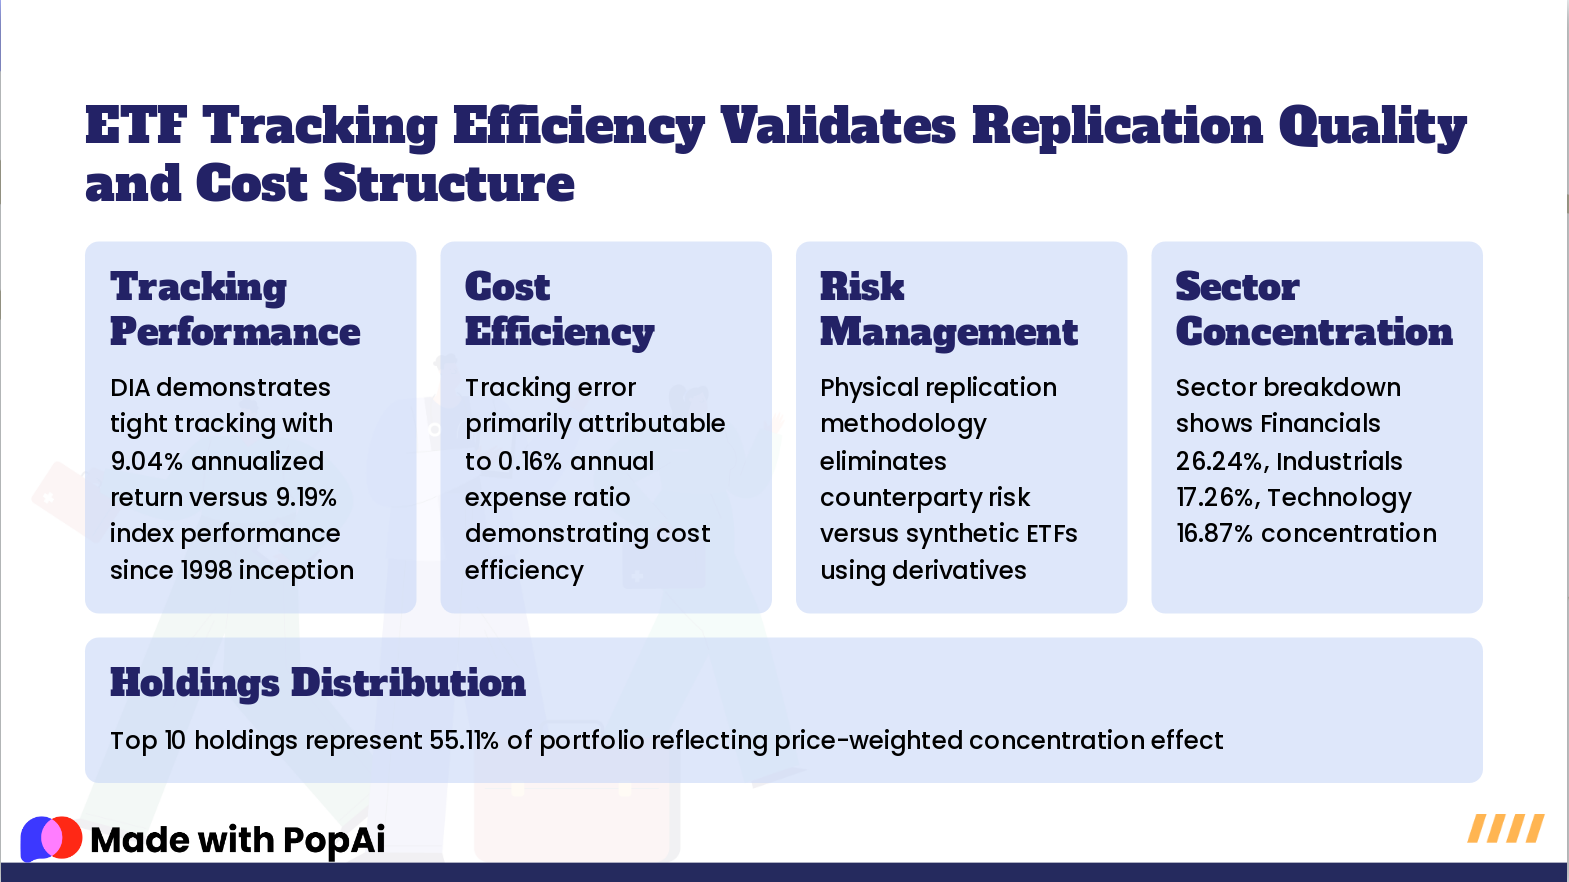
Slide 17: ETF Tracking Efficiency Validates Replication Quality and Cost Structure
- Tracking Performance: DIA demonstrates tight tracking with 9.04% annualized return versus 9.19% index performance since 1998 inception
- Cost Efficiency: Tracking error primarily attributable to 0.16% annual expense ratio demonstrating cost efficiency
- Risk Management: Physical replication methodology eliminates counterparty risk versus synthetic ETFs using derivatives
- Sector Concentration: Sector breakdown shows Financials 26.24%, Industrials 17.26%, Technology 16.87% concentration
- Holdings Distribution: Top 10 holdings represent 55.11% of portfolio reflecting price-weighted concentration effect
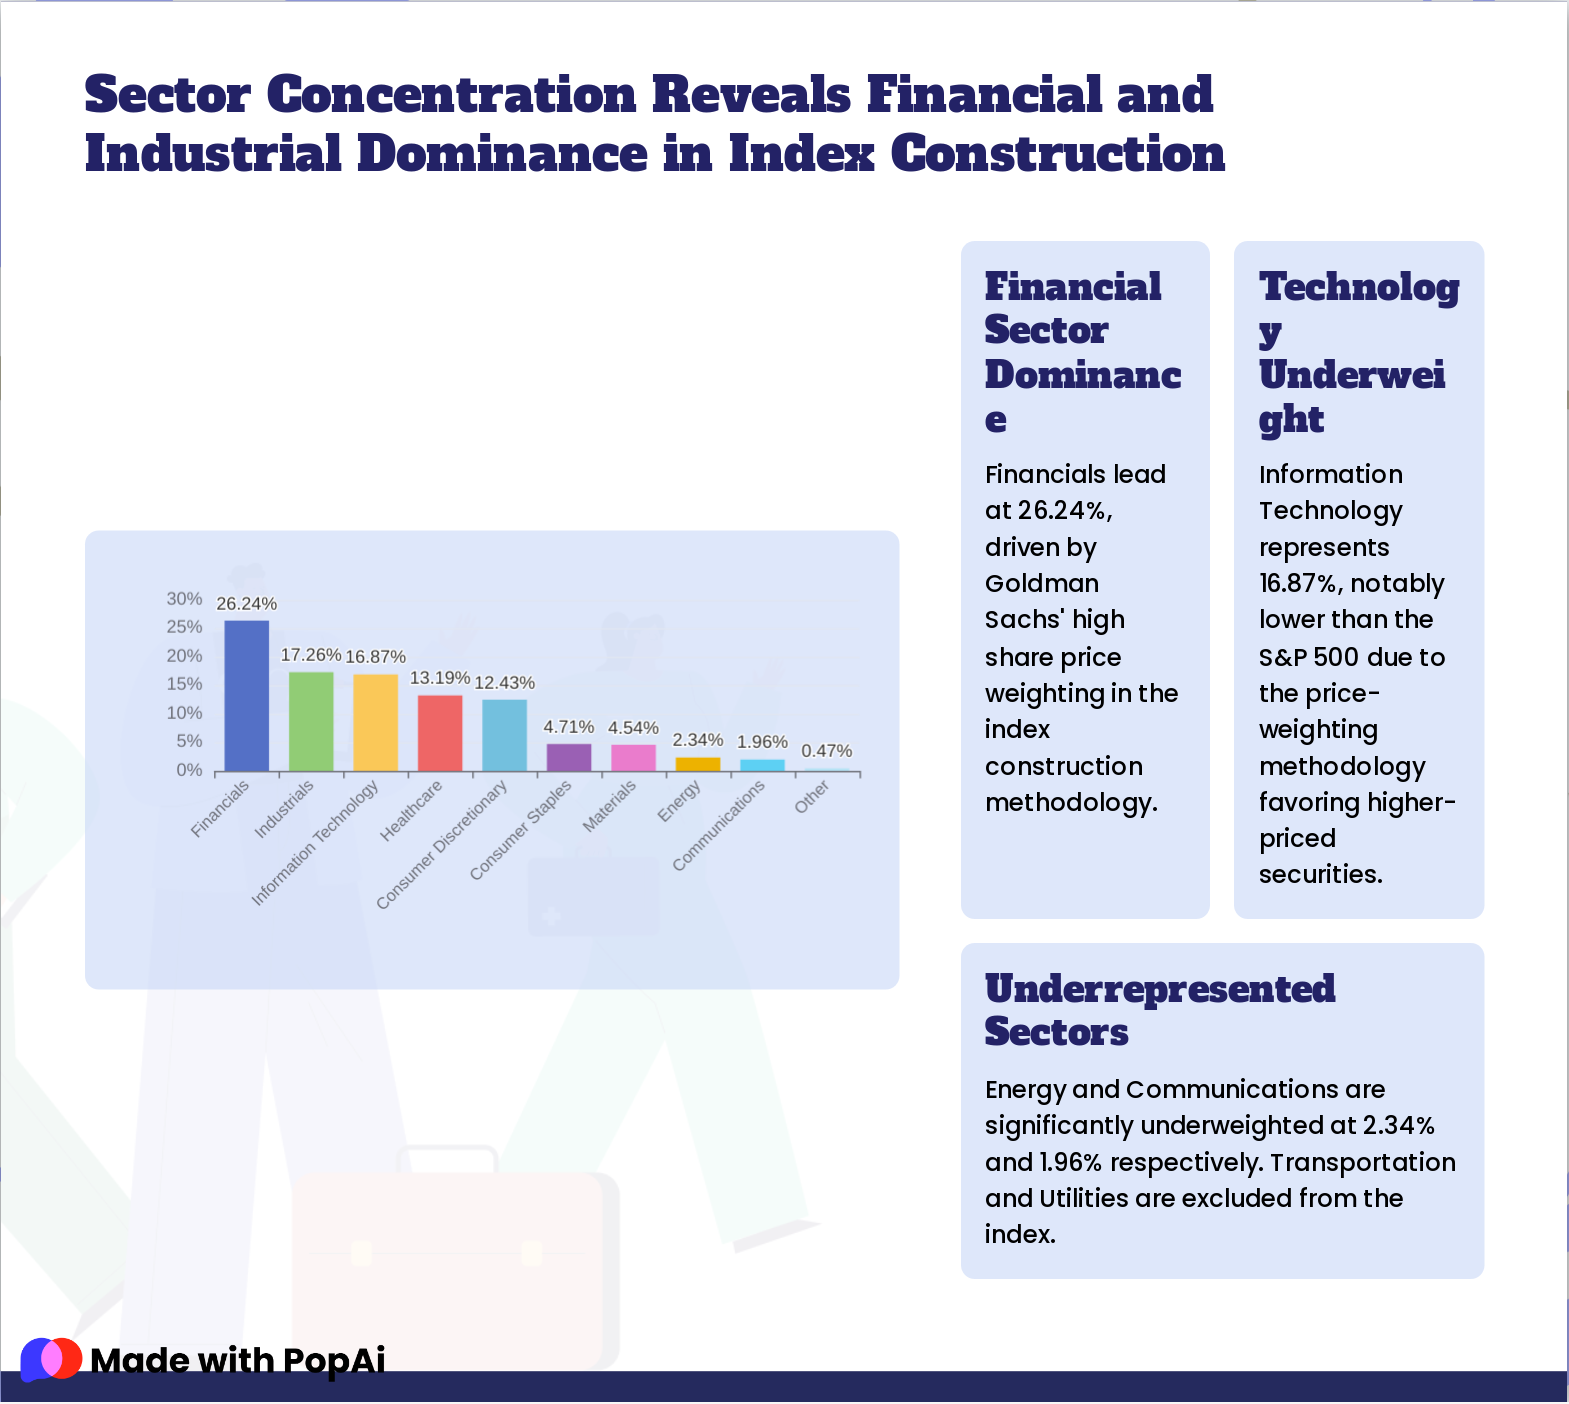
Slide 18: Sector Concentration Reveals Financial and Industrial Dominance in Index Construction
- Financial Sector Dominance: Financials lead at 26.24%, driven by Goldman Sachs' high share price weighting in the index construction methodology.
- Technology Underweight: Information Technology represents 16.87%, notably lower than the S&P 500 due to the price-weighting methodology favoring higher-priced securities.
- Underrepresented Sectors: Energy and Communications are significantly underweighted at 2.34% and 1.96% respectively. Transportation and Utilities are excluded from the index.
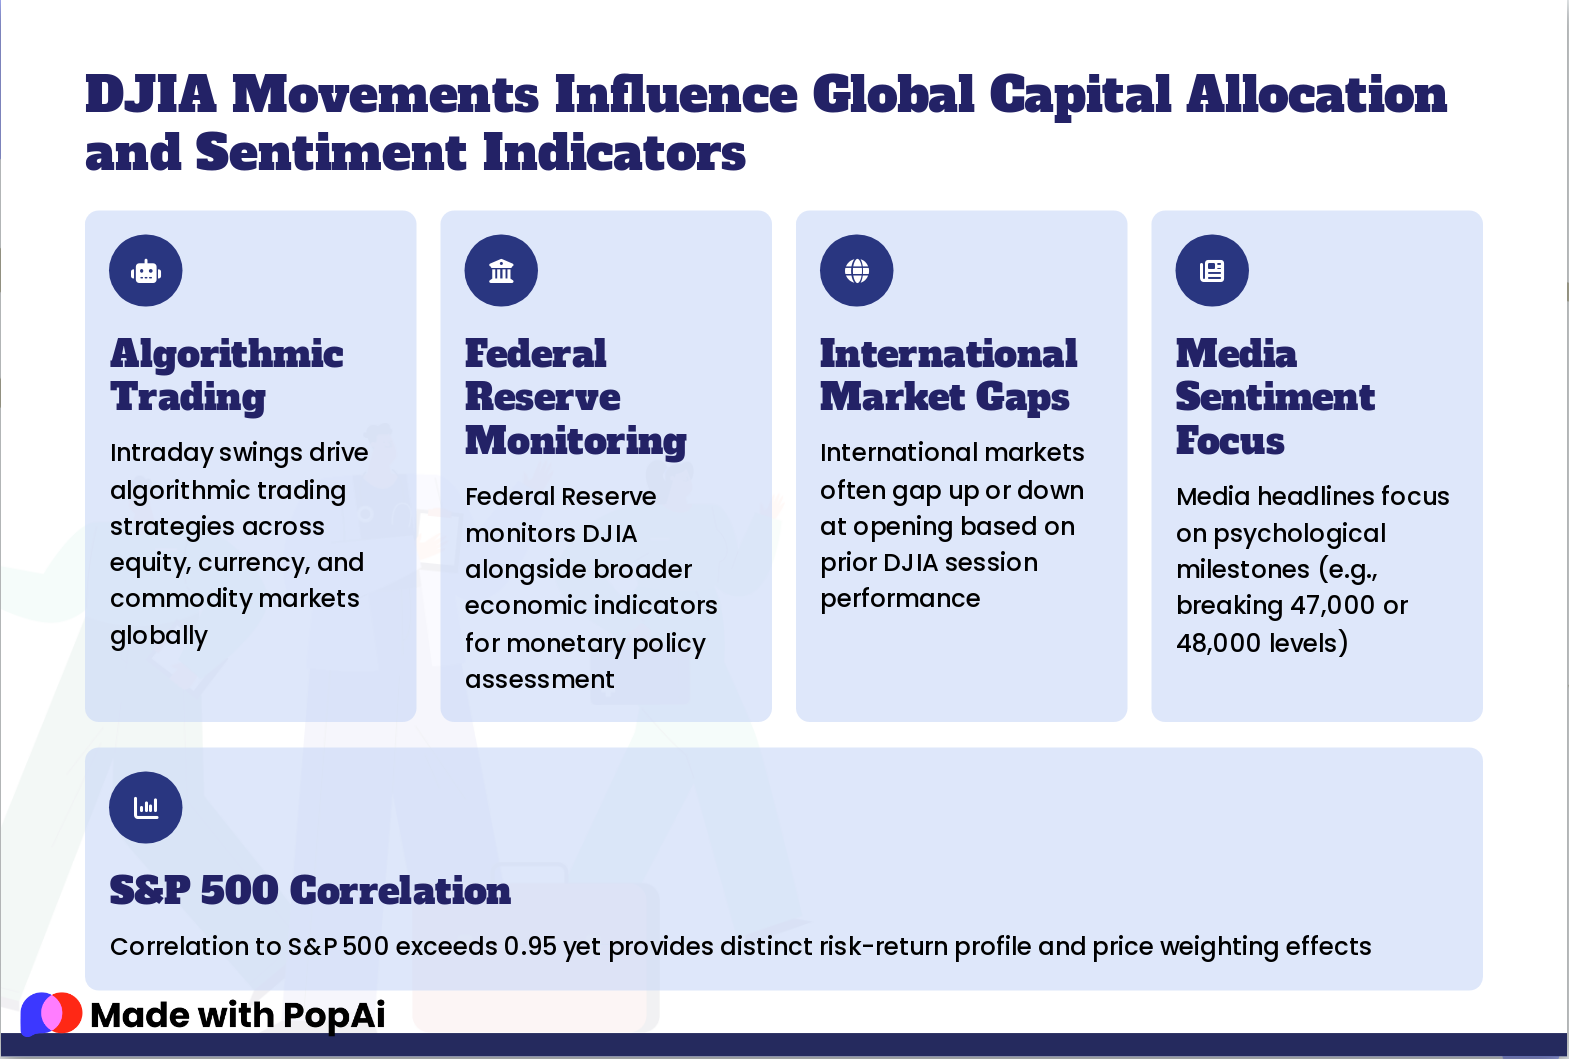
Slide 19: DJIA Movements Influence Global Capital Allocation and Sentiment Indicators
- Algorithmic Trading: Intraday swings drive algorithmic trading strategies across equity, currency, and commodity markets globally
- Federal Reserve Monitoring: Federal Reserve monitors DJIA alongside broader economic indicators for monetary policy assessment
- International Market Gaps: International markets often gap up or down at opening based on prior DJIA session performance
- Media Sentiment Focus: Media headlines focus on psychological milestones (e.g., breaking 47,000 or 48,000 levels)
- S&P 500 Correlation: Correlation to S&P 500 exceeds 0.95 yet provides distinct risk-return profile and price weighting effects
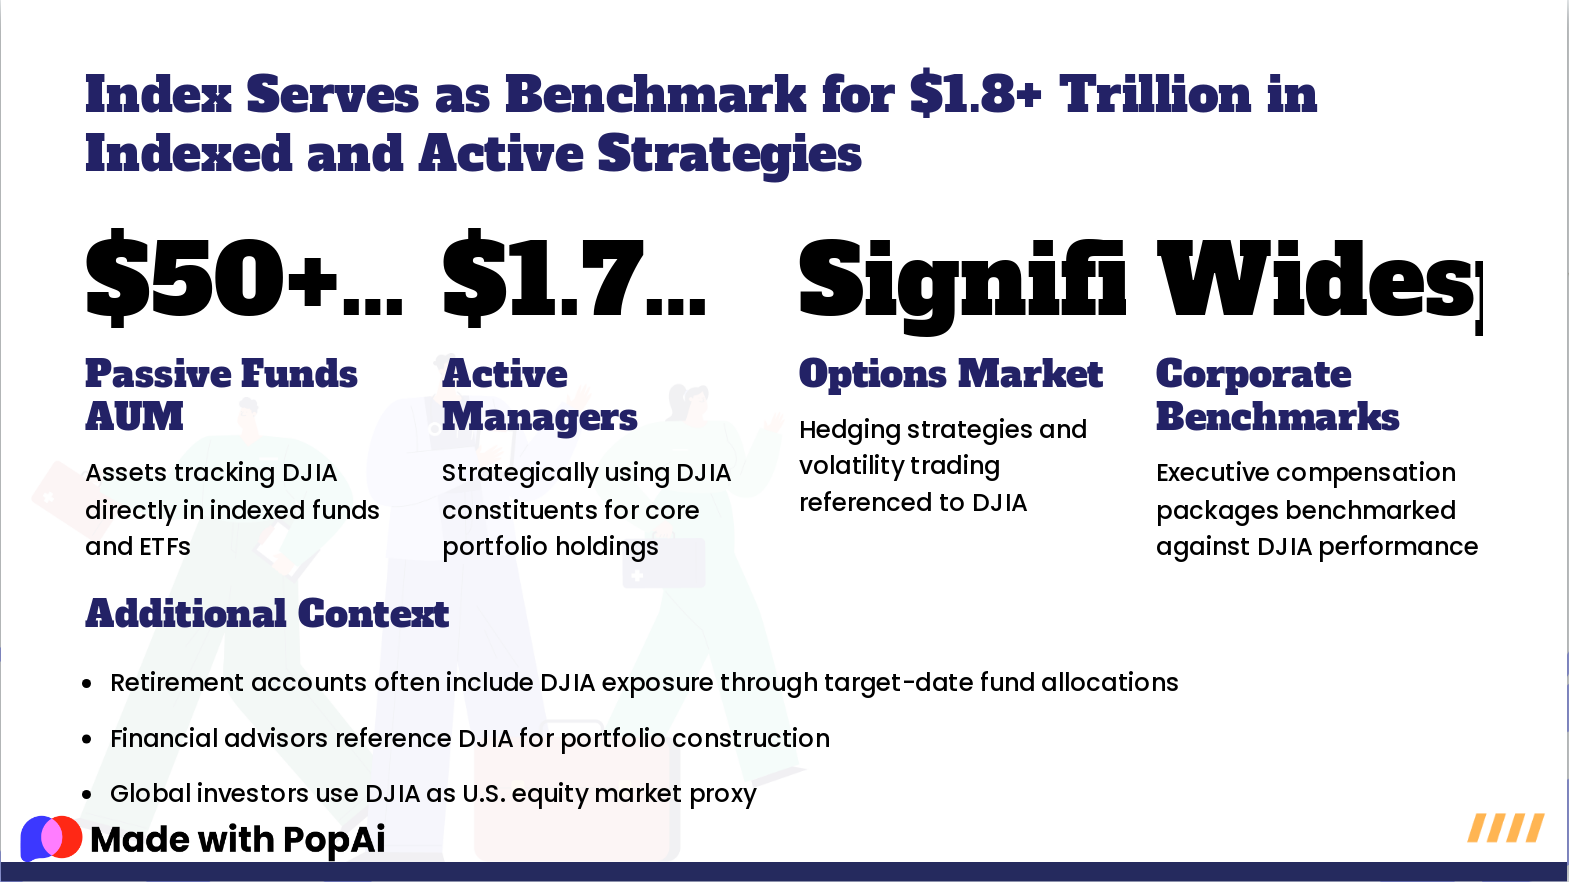
Slide 20: Index Serves as Benchmark for $1.8+ Trillion in Indexed and Active Strategies
- $50+ Billion — Passive Funds AUM
- $1.75+ Trillion — Active Managers
- Significant — Options Market
- Widespread — Corporate Benchmarks
Retirement accounts often include DJIA exposure through target-date fund allocations
Financial advisors reference DJIA for portfolio construction
Global investors use DJIA as U.S. equity market proxy
- Retirement accounts often include DJIA exposure through target-date fund allocations
- Financial advisors reference DJIA for portfolio construction
- Global investors use DJIA as U.S. equity market proxy
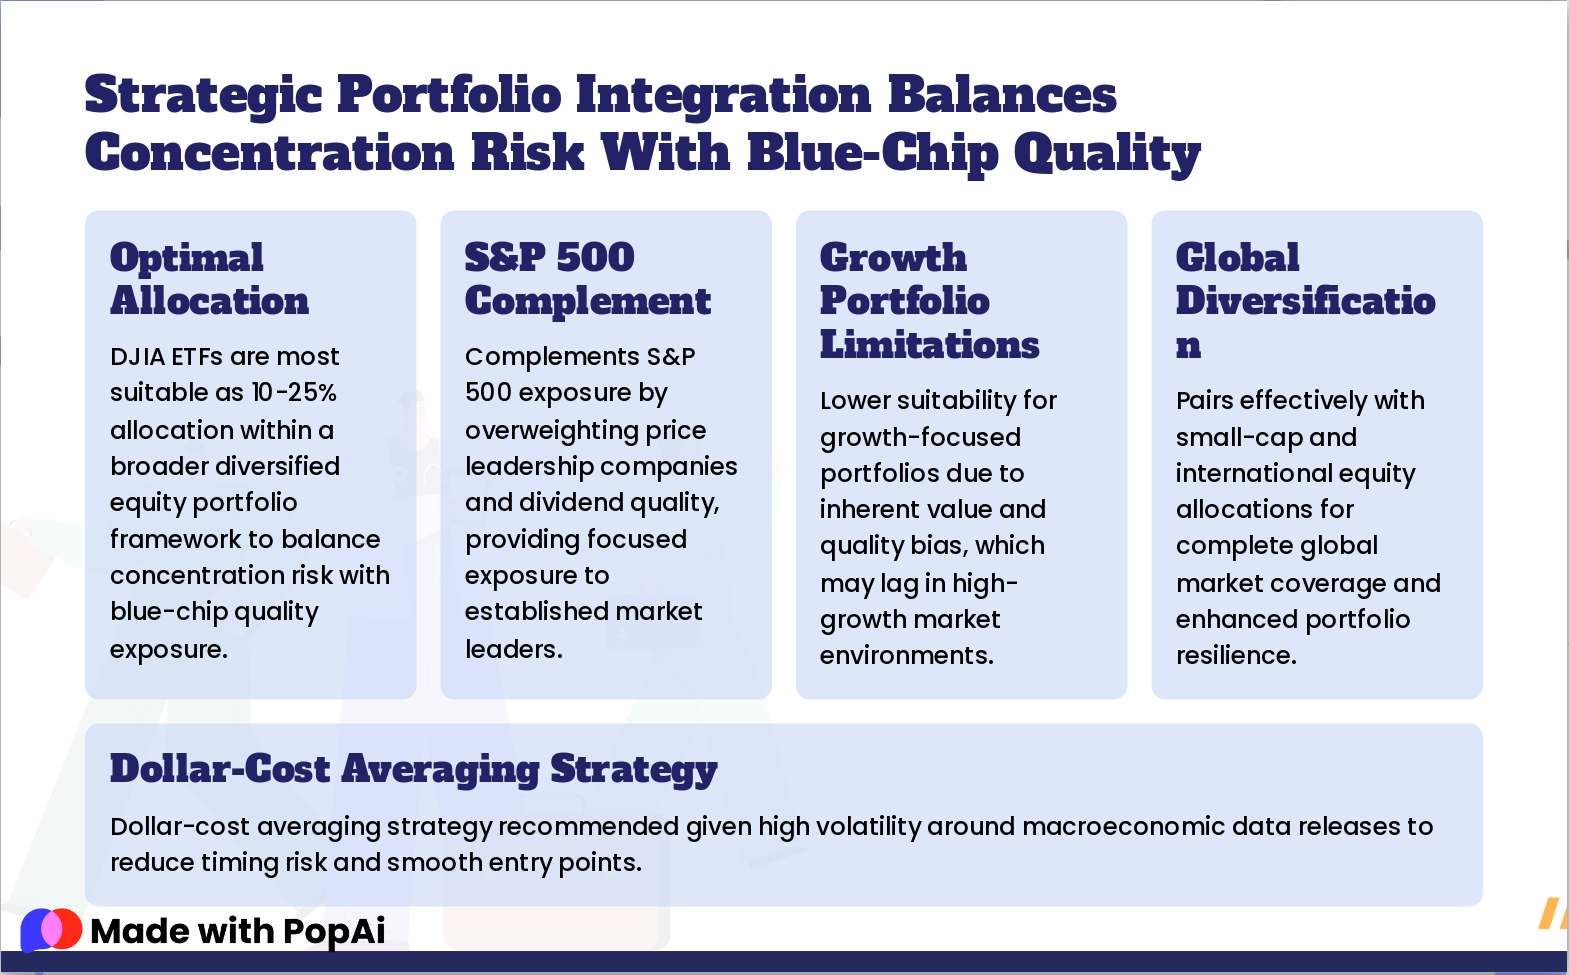
Slide 21: Strategic Portfolio Integration Balances Concentration Risk With Blue-Chip Quality
- Optimal Allocation: DJIA ETFs are most suitable as 10-25% allocation within a broader diversified equity portfolio framework to balance concentration risk with blue-chip quality exposure.
- S&P 500 Complement: Complements S&P 500 exposure by overweighting price leadership companies and dividend quality, providing focused exposure to established market leaders.
- Growth Portfolio Limitations: Lower suitability for growth-focused portfolios due to inherent value and quality bias, which may lag in high-growth market environments.
- Global Diversification: Pairs effectively with small-cap and international equity allocations for complete global market coverage and enhanced portfolio resilience.
- Dollar-Cost Averaging Strategy: Dollar-cost averaging strategy recommended given high volatility around macroeconomic data releases to reduce timing risk and smooth entry points.
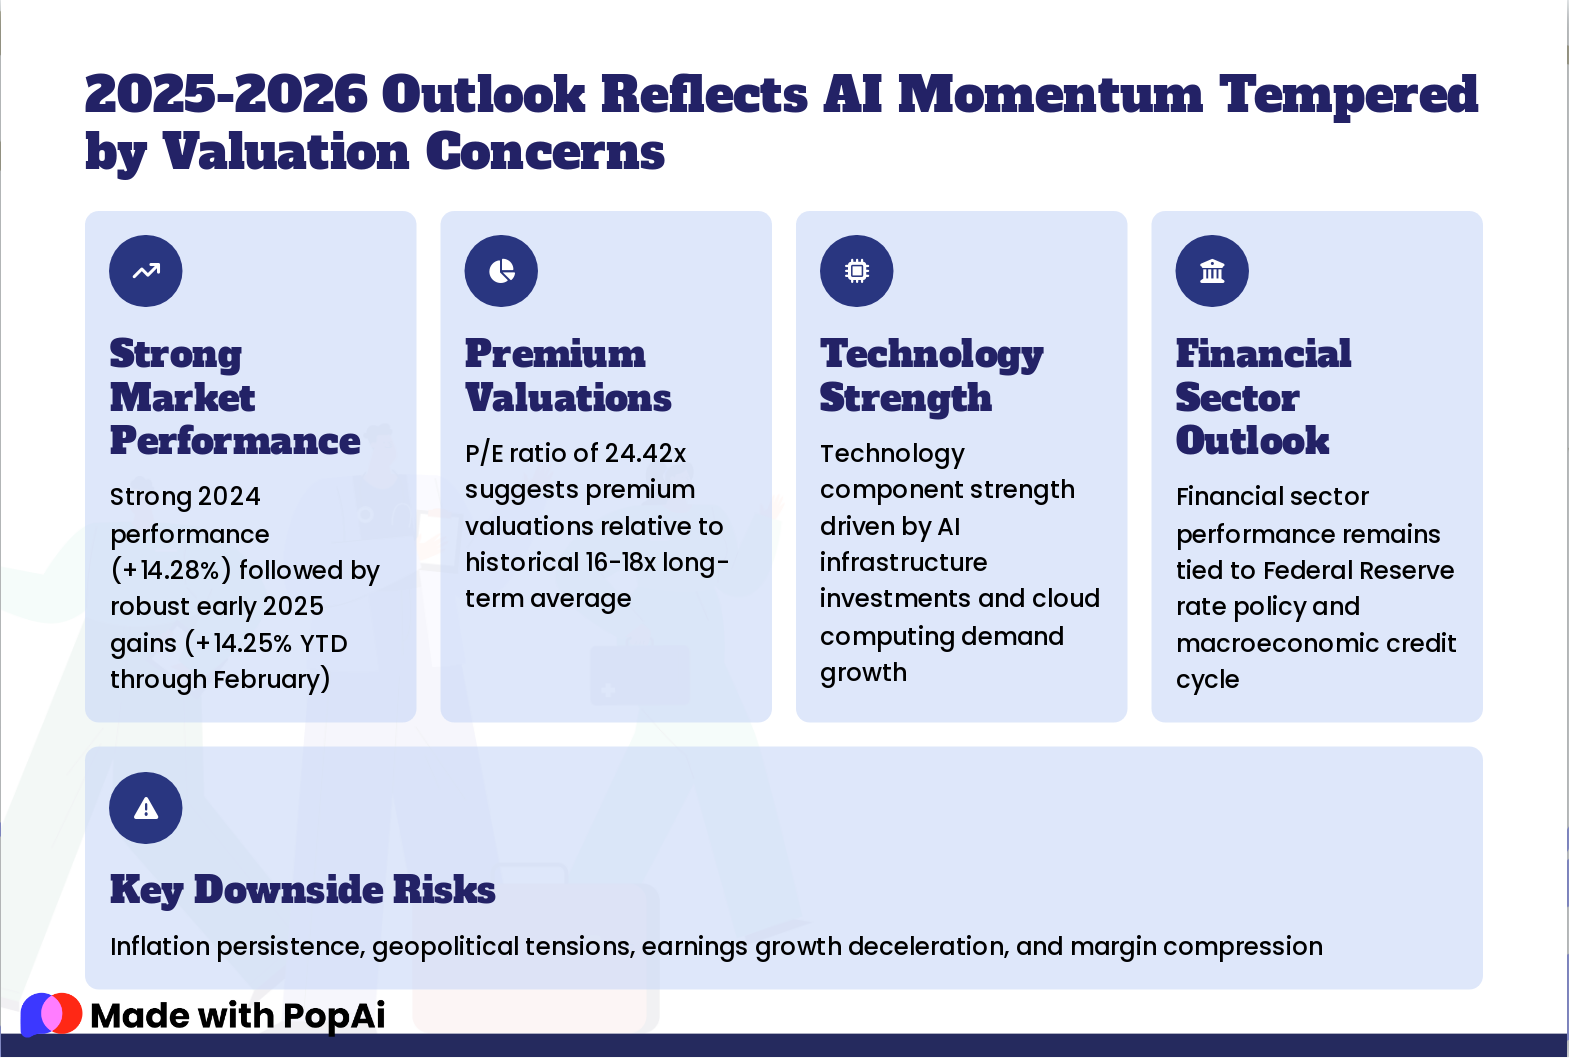
Slide 22: 2025-2026 Outlook Reflects AI Momentum Tempered by Valuation Concerns
- Strong Market Performance: Strong 2024 performance (+14.28%) followed by robust early 2025 gains (+14.25% YTD through February)
- Premium Valuations: P/E ratio of 24.42x suggests premium valuations relative to historical 16-18x long-term average
- Technology Strength: Technology component strength driven by AI infrastructure investments and cloud computing demand growth
- Financial Sector Outlook: Financial sector performance remains tied to Federal Reserve rate policy and macroeconomic credit cycle
- Key Downside Risks: Inflation persistence, geopolitical tensions, earnings growth deceleration, and margin compression
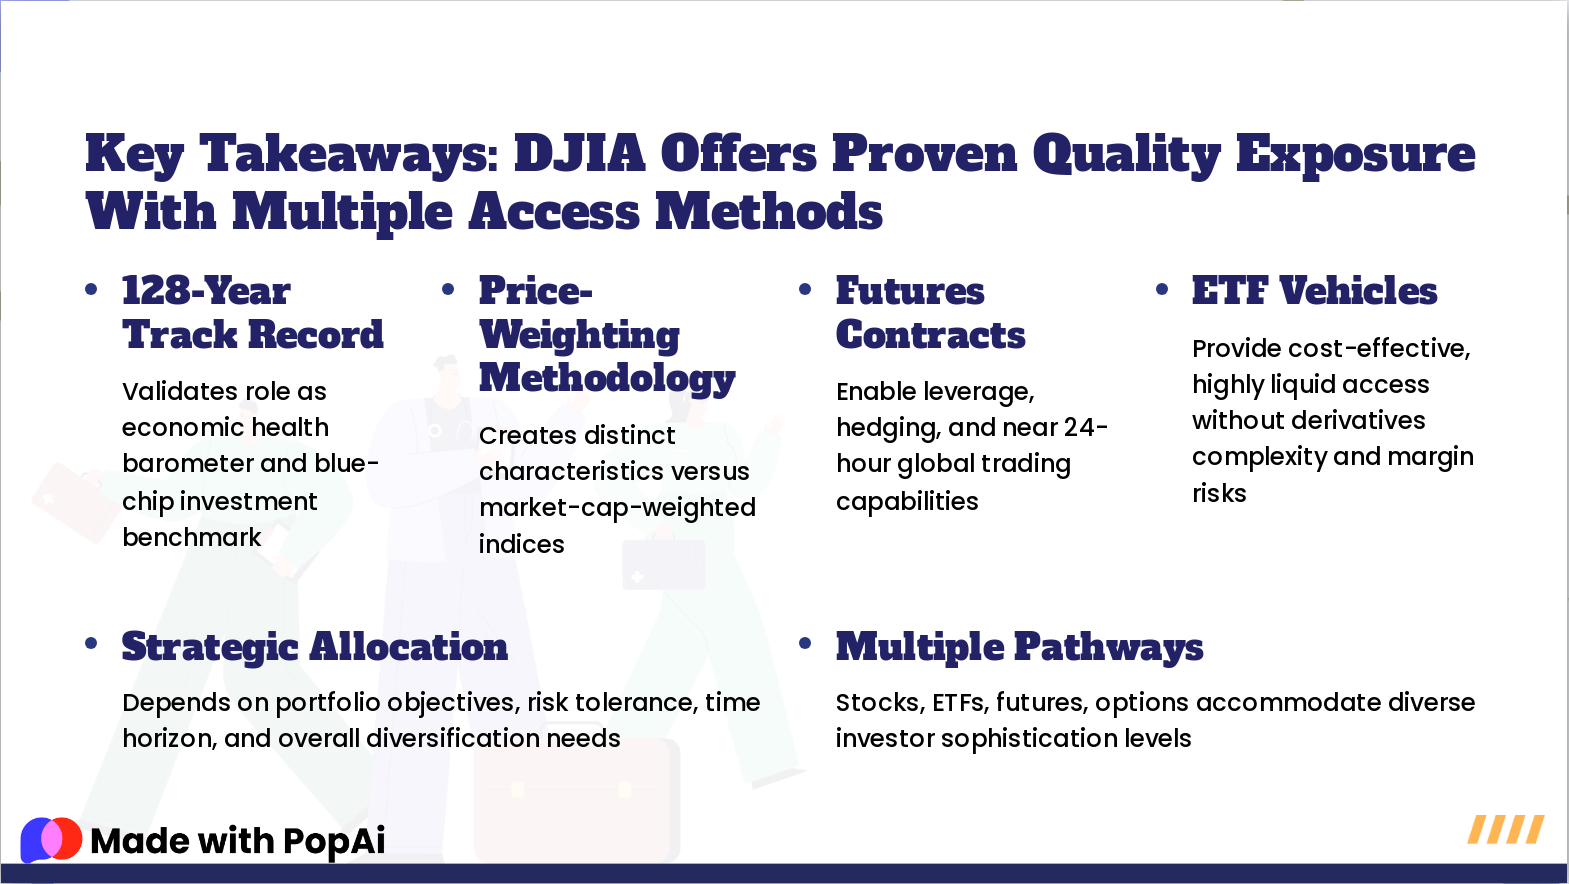
Slide 23: Key Takeaways: DJIA Offers Proven Quality Exposure With Multiple Access Methods
- 128-Year Track Record: Validates role as economic health barometer and blue-chip investment benchmark
- Price-Weighting Methodology: Creates distinct characteristics versus market-cap-weighted indices
- Futures Contracts: Enable leverage, hedging, and near 24-hour global trading capabilities
- ETF Vehicles: Provide cost-effective, highly liquid access without derivatives complexity and margin risks
- Strategic Allocation: Depends on portfolio objectives, risk tolerance, time horizon, and overall diversification needs
- Multiple Pathways: Stocks, ETFs, futures, options accommodate diverse investor sophistication levels
Slide 24: Thank You
Thank You The Dow Jones Industrial Average represents a century-plus of American enterprise and market leadership. Whether through direct stock ownership, ETF exposure, or derivatives trading, understanding DJIA mechanics enhances investment decision-making quality. For personalized strategy develop...